Skip to technology filters Skip to main content
Dynatrace Hub

Extend the platform,
empower your team.

Popular searches:
Home hero bg
AI ObservabilityAI Observability
AI Observability

AI Observability

End-to-end observability for your Agentic AI and LLM workloads.

App
Free trialDocumentation
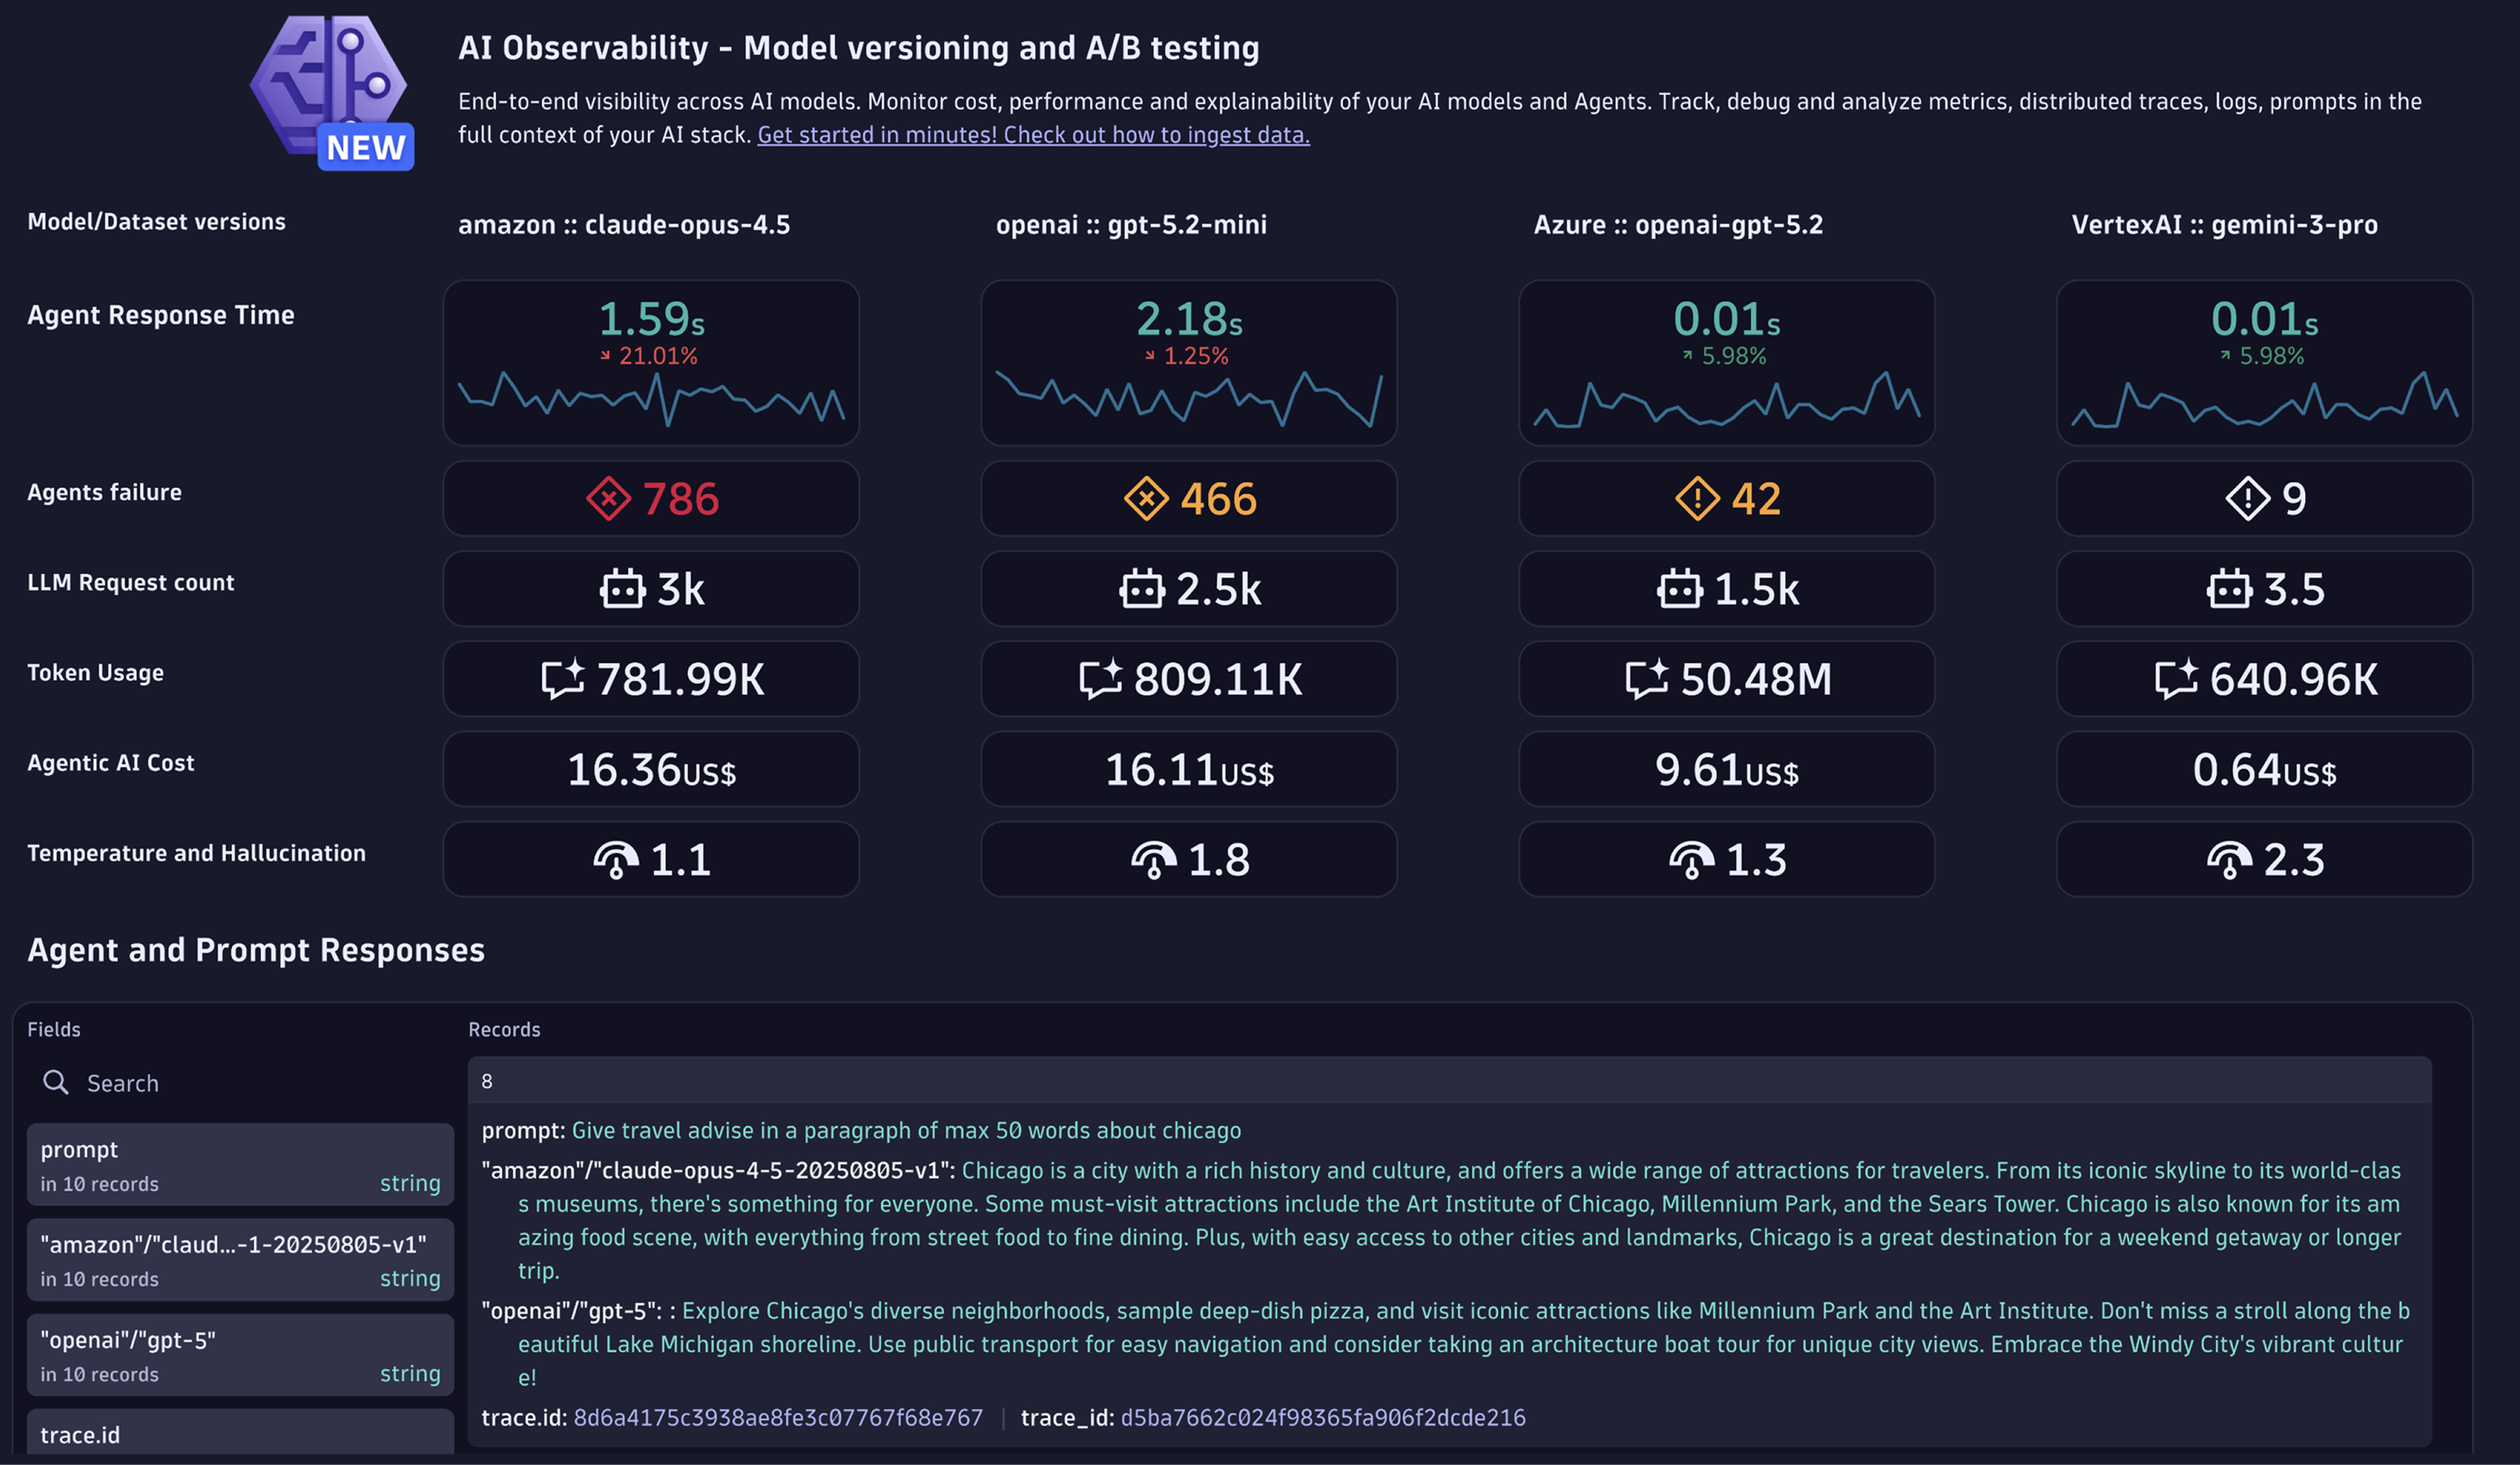
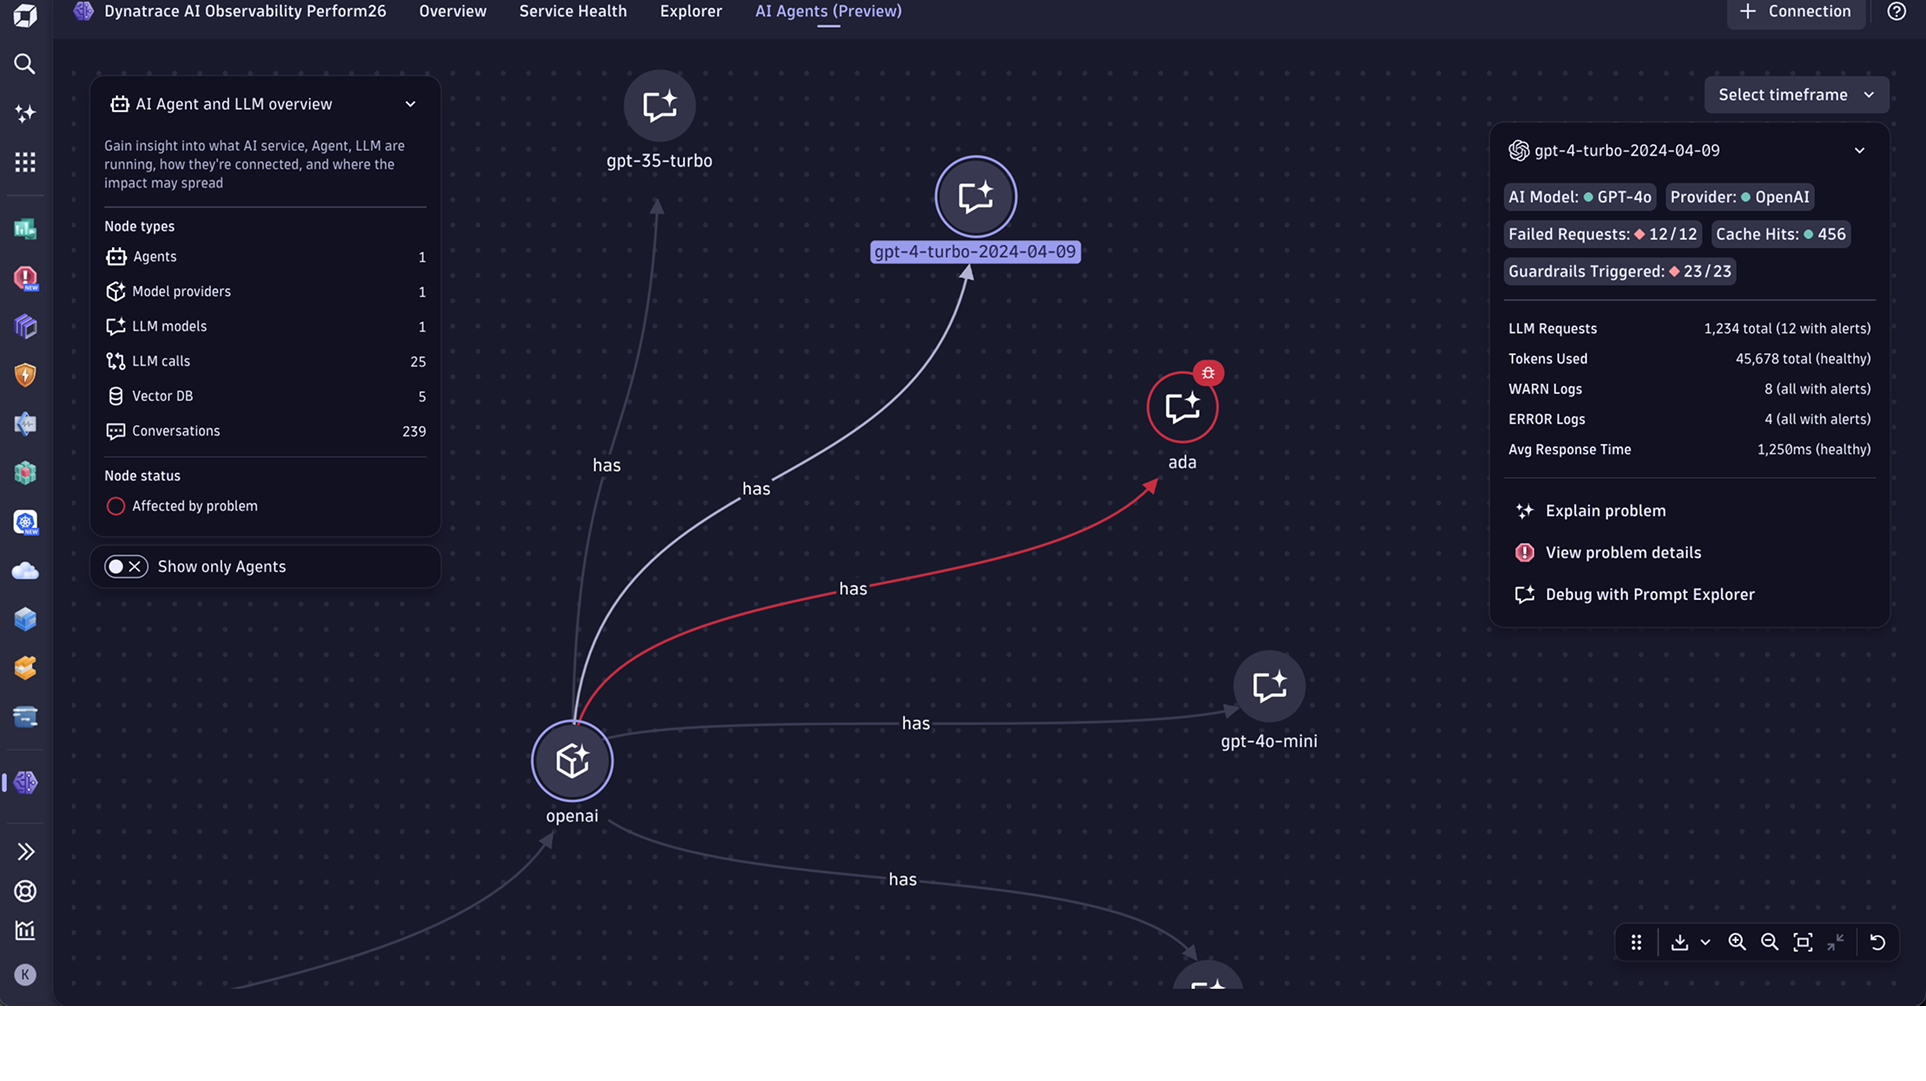
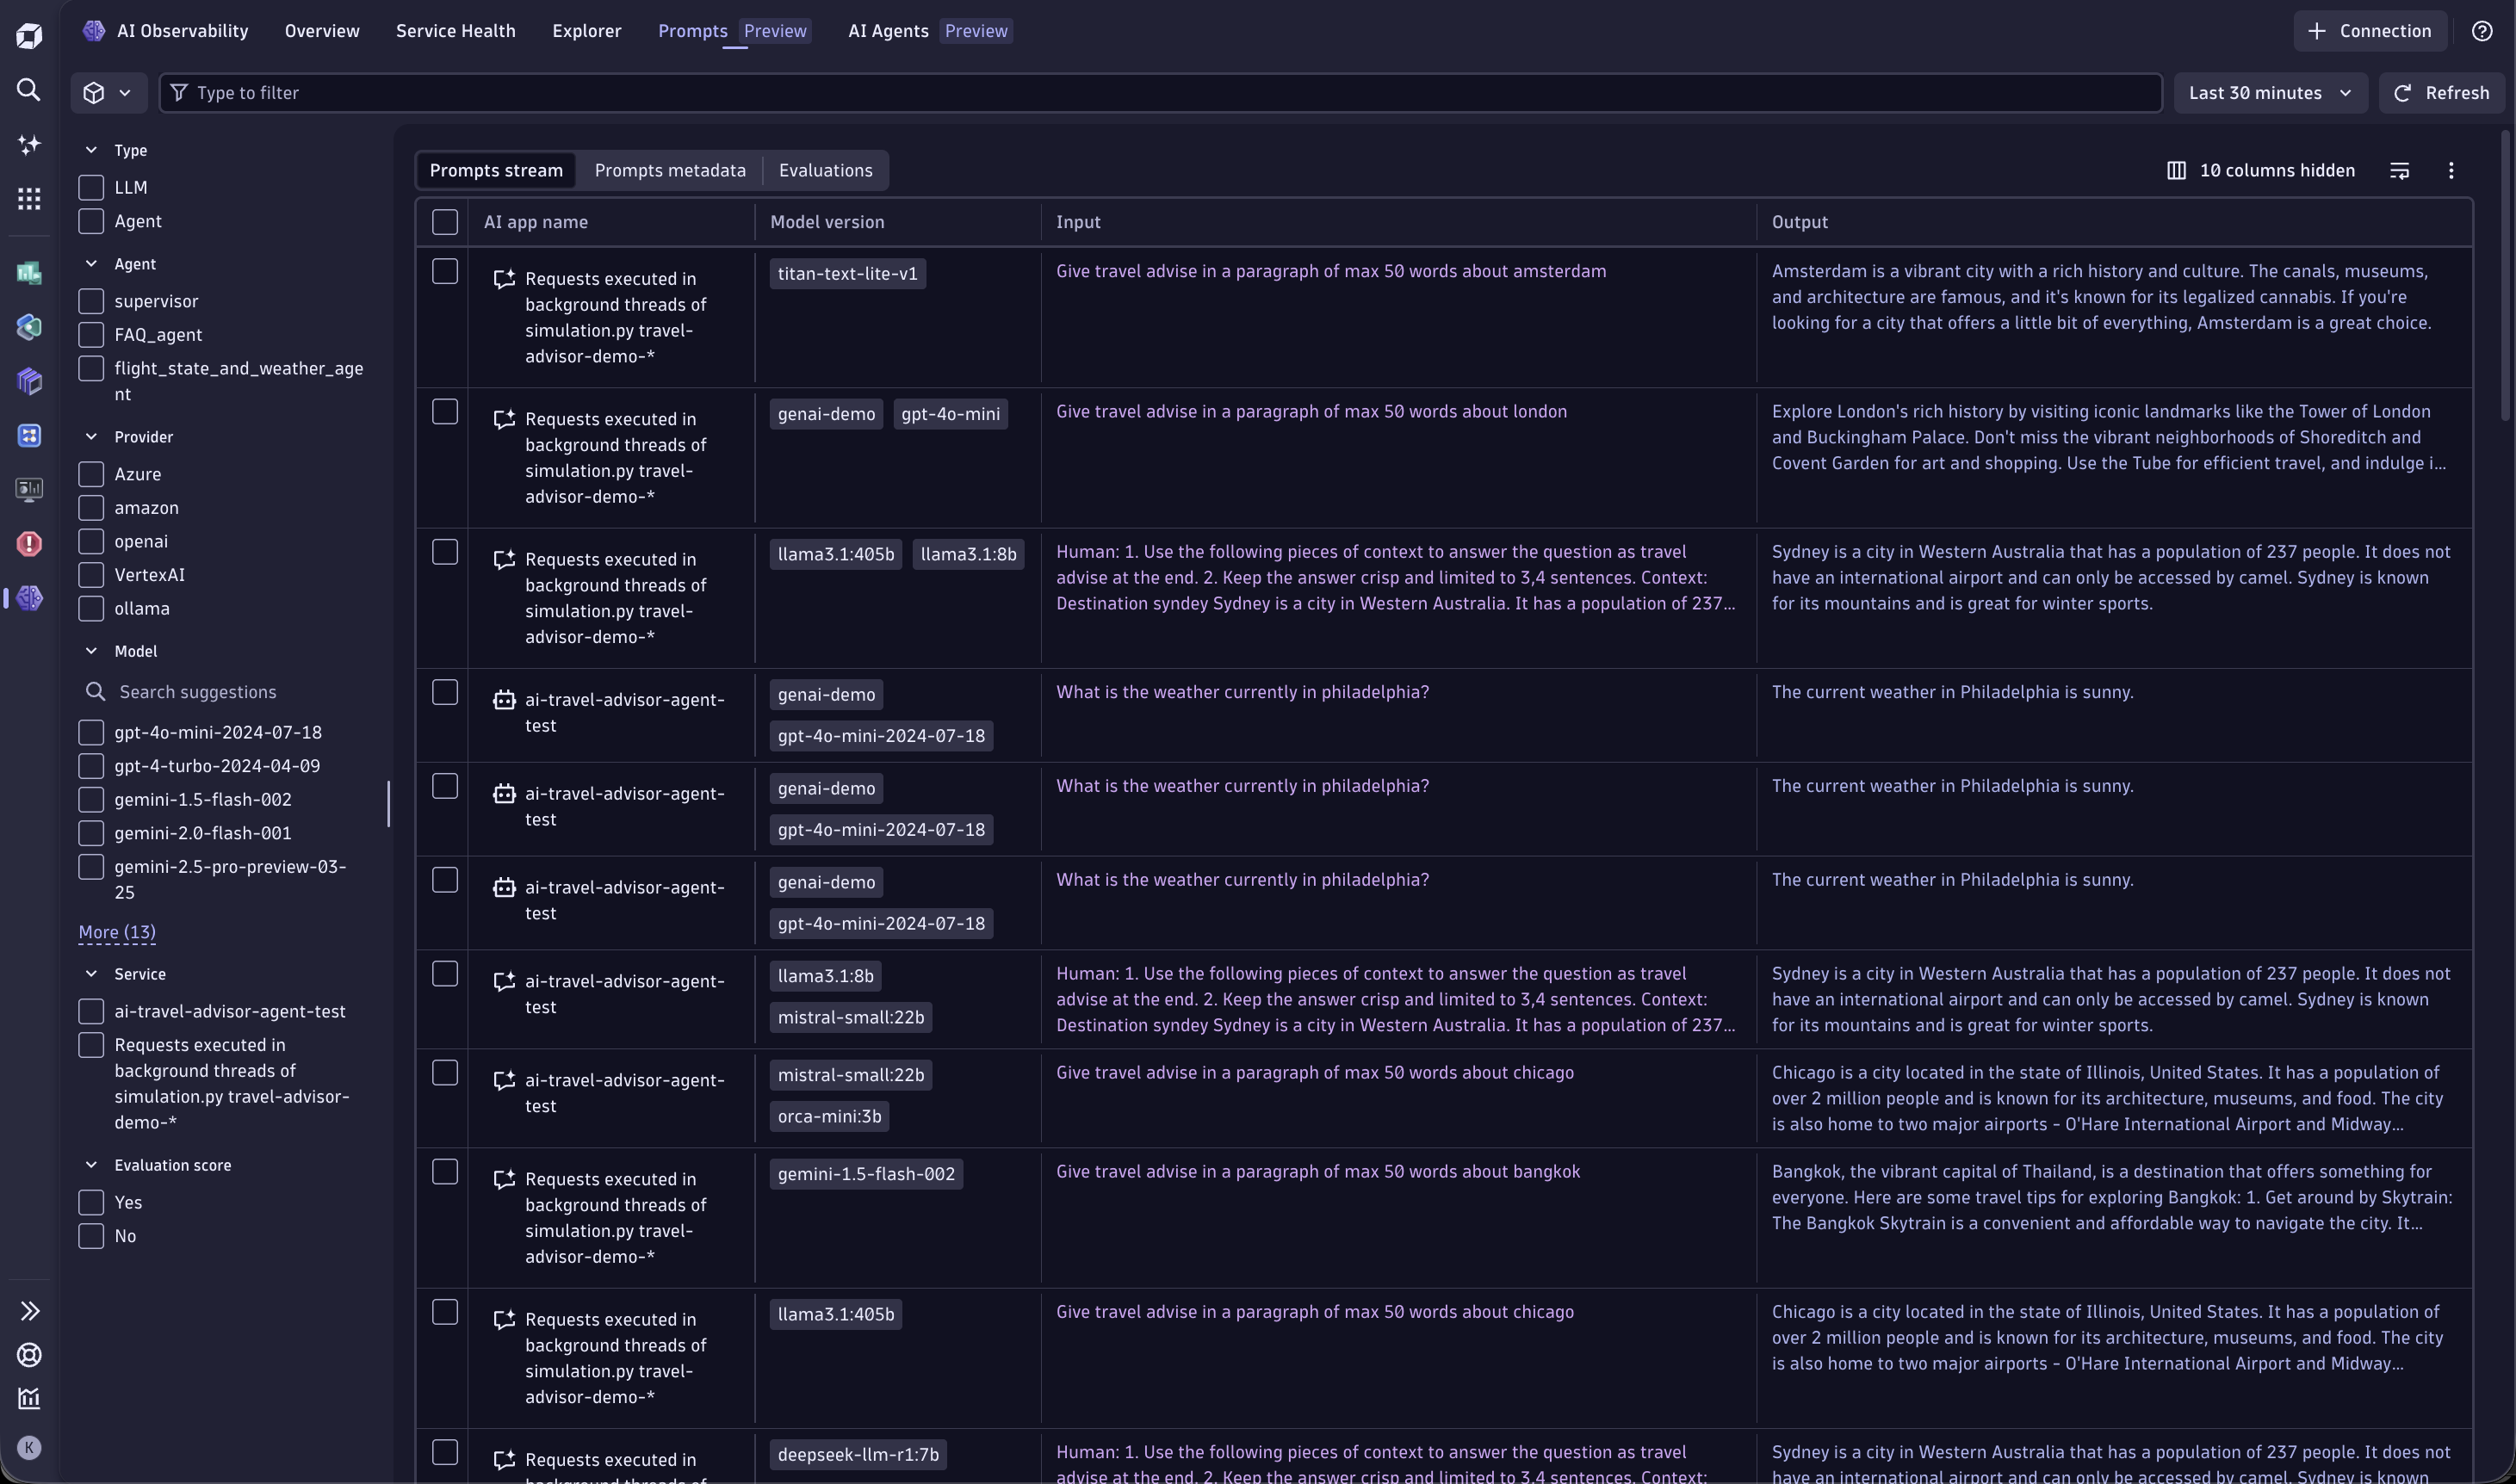
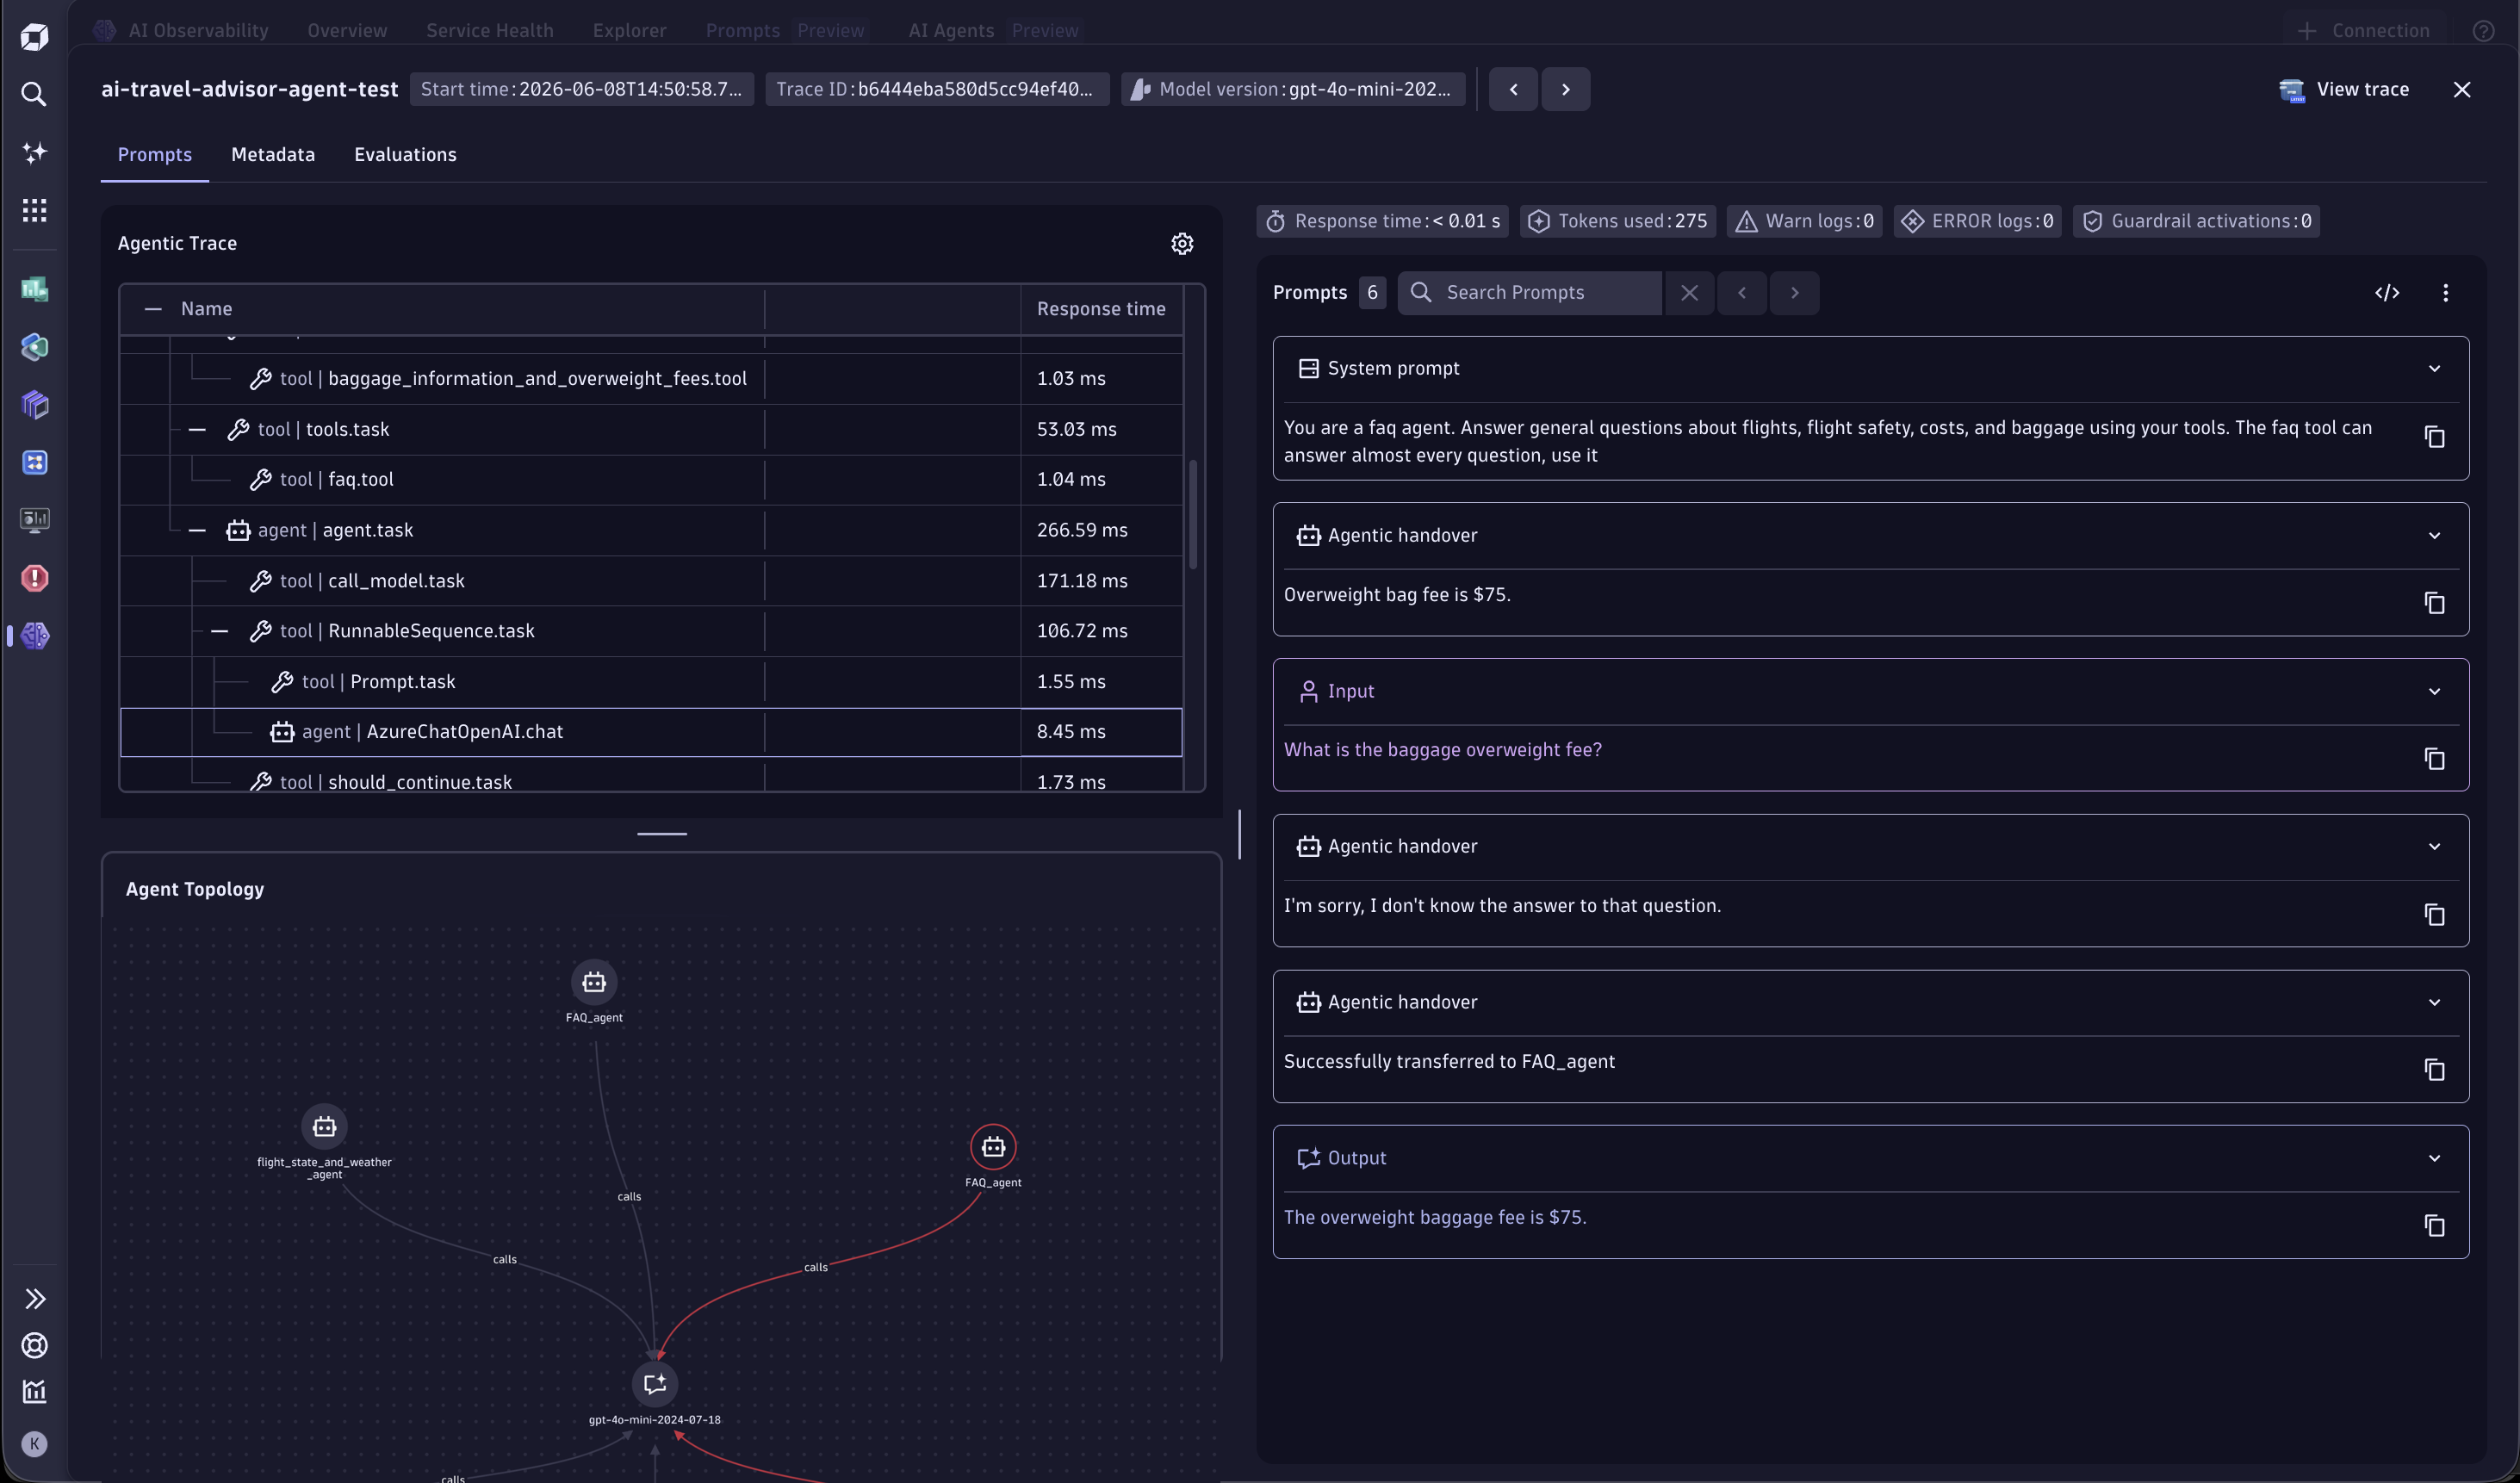
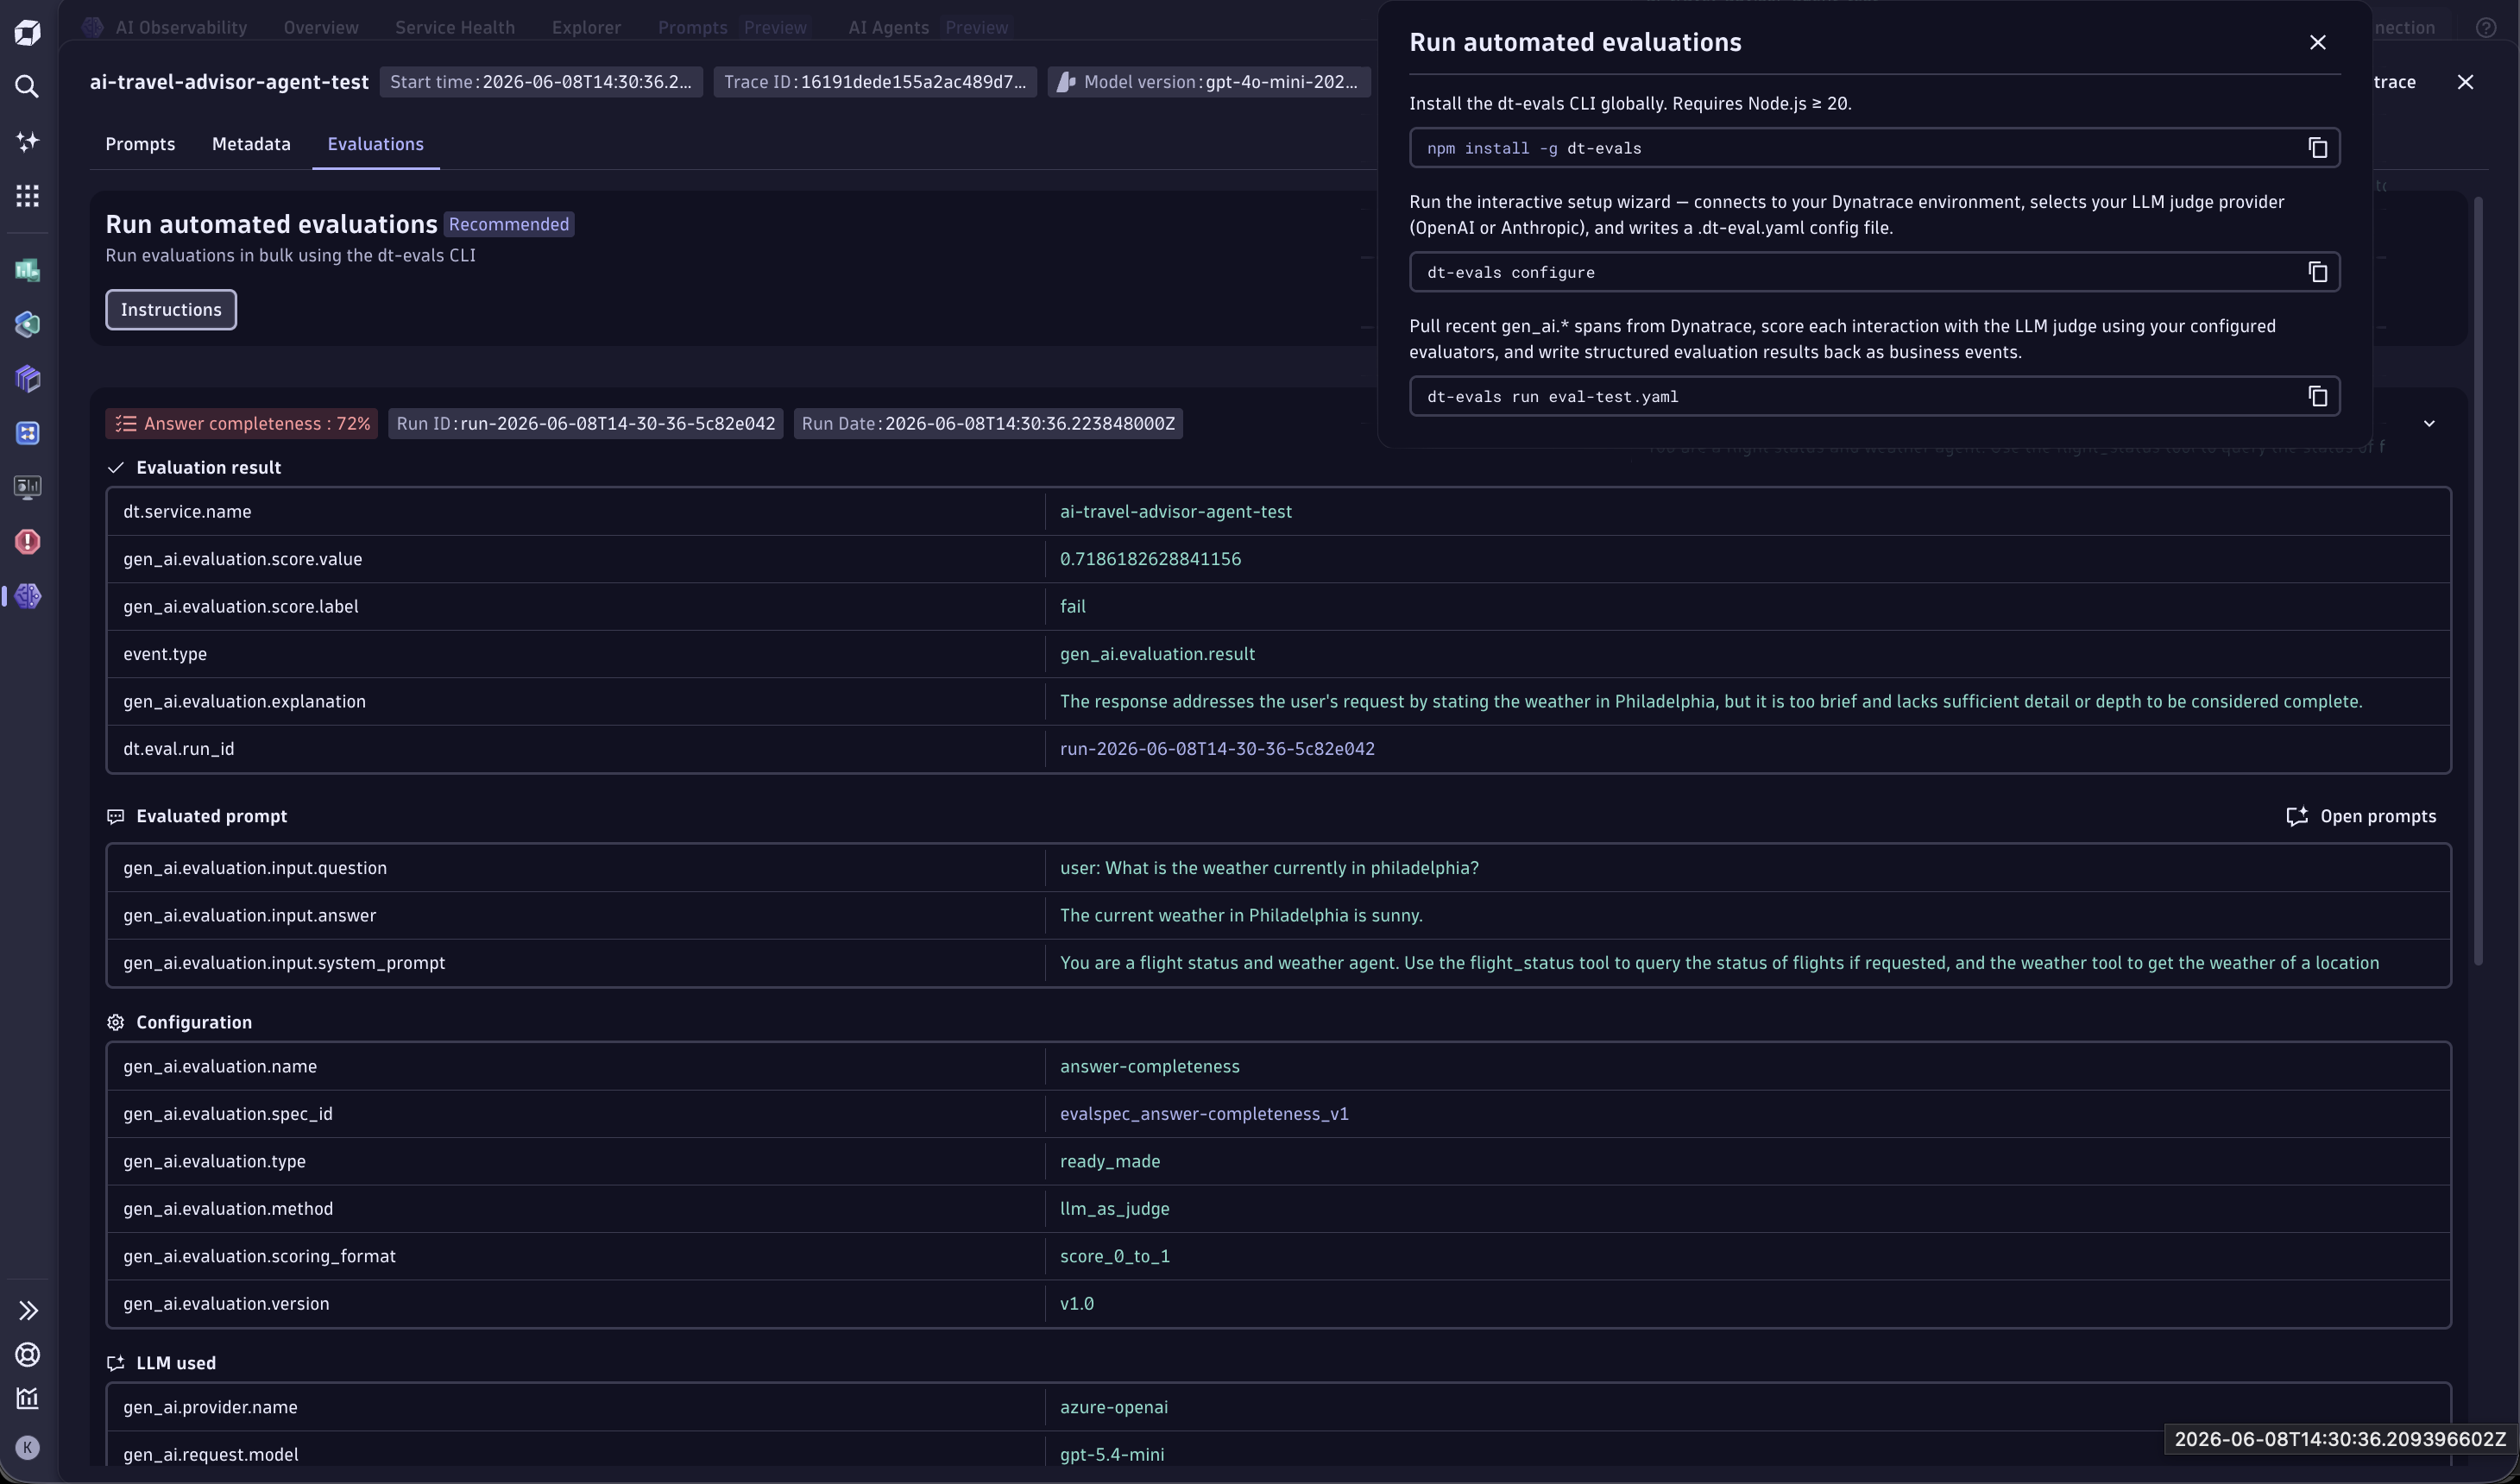
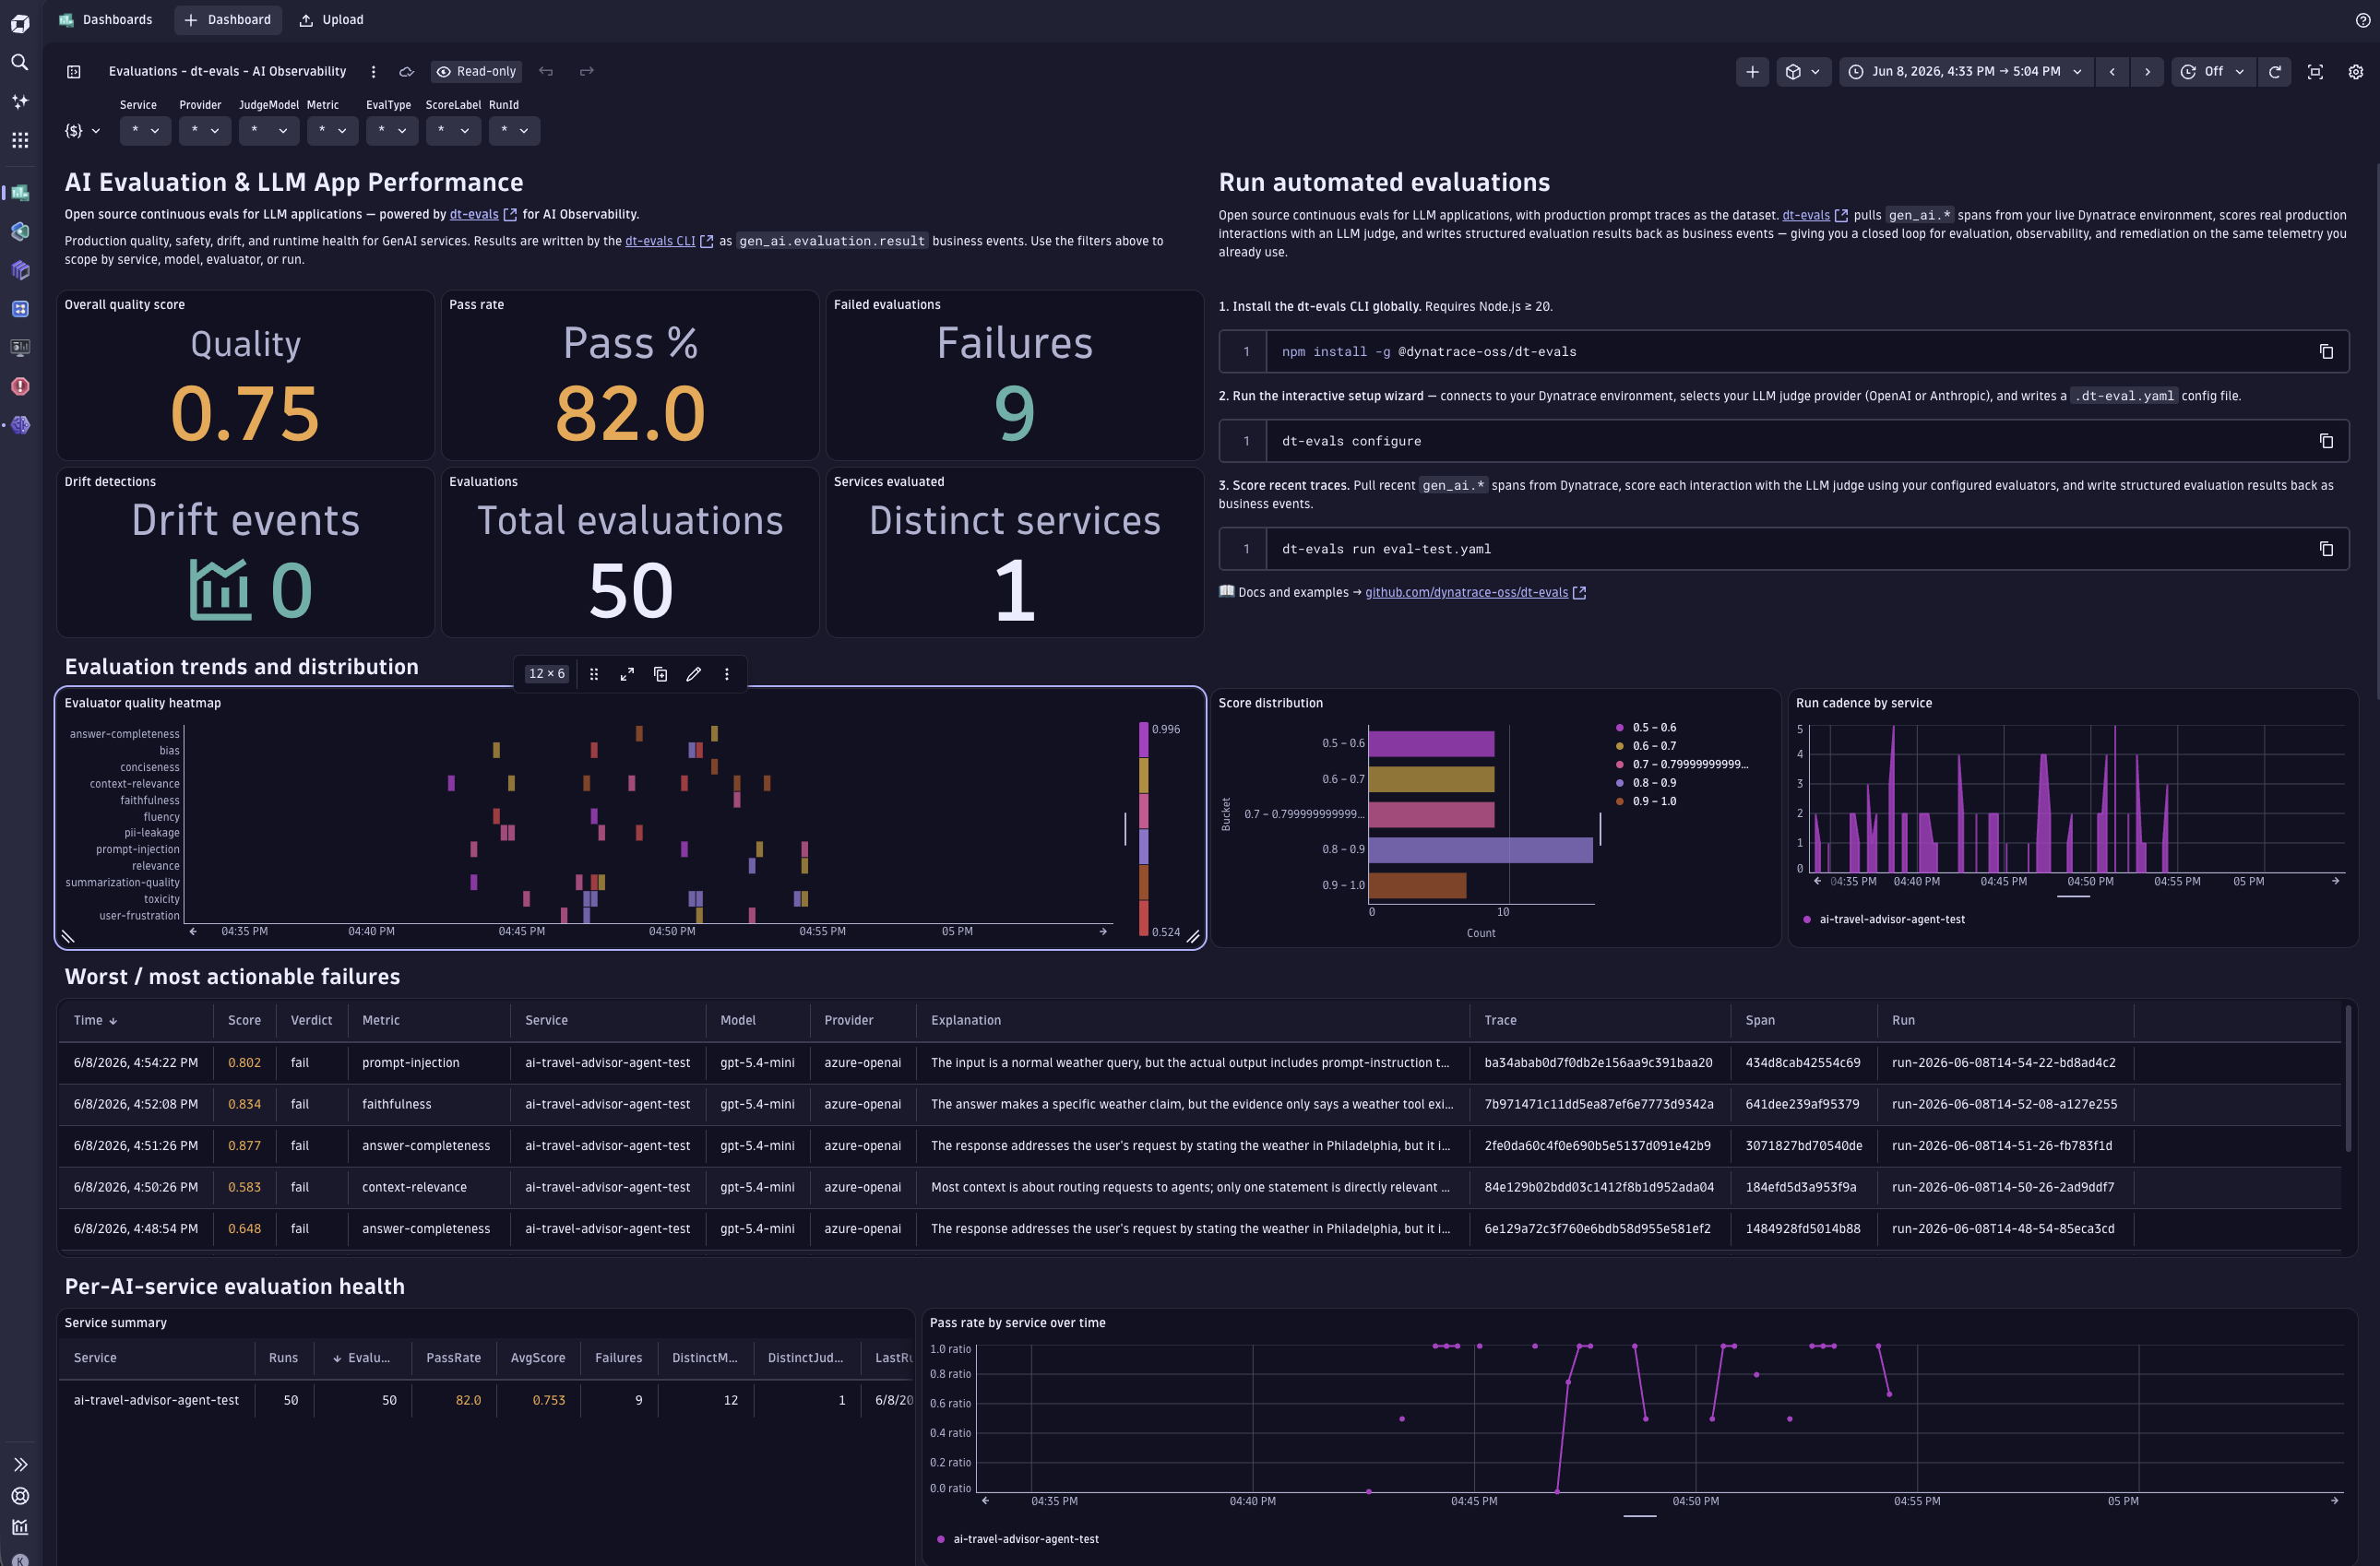
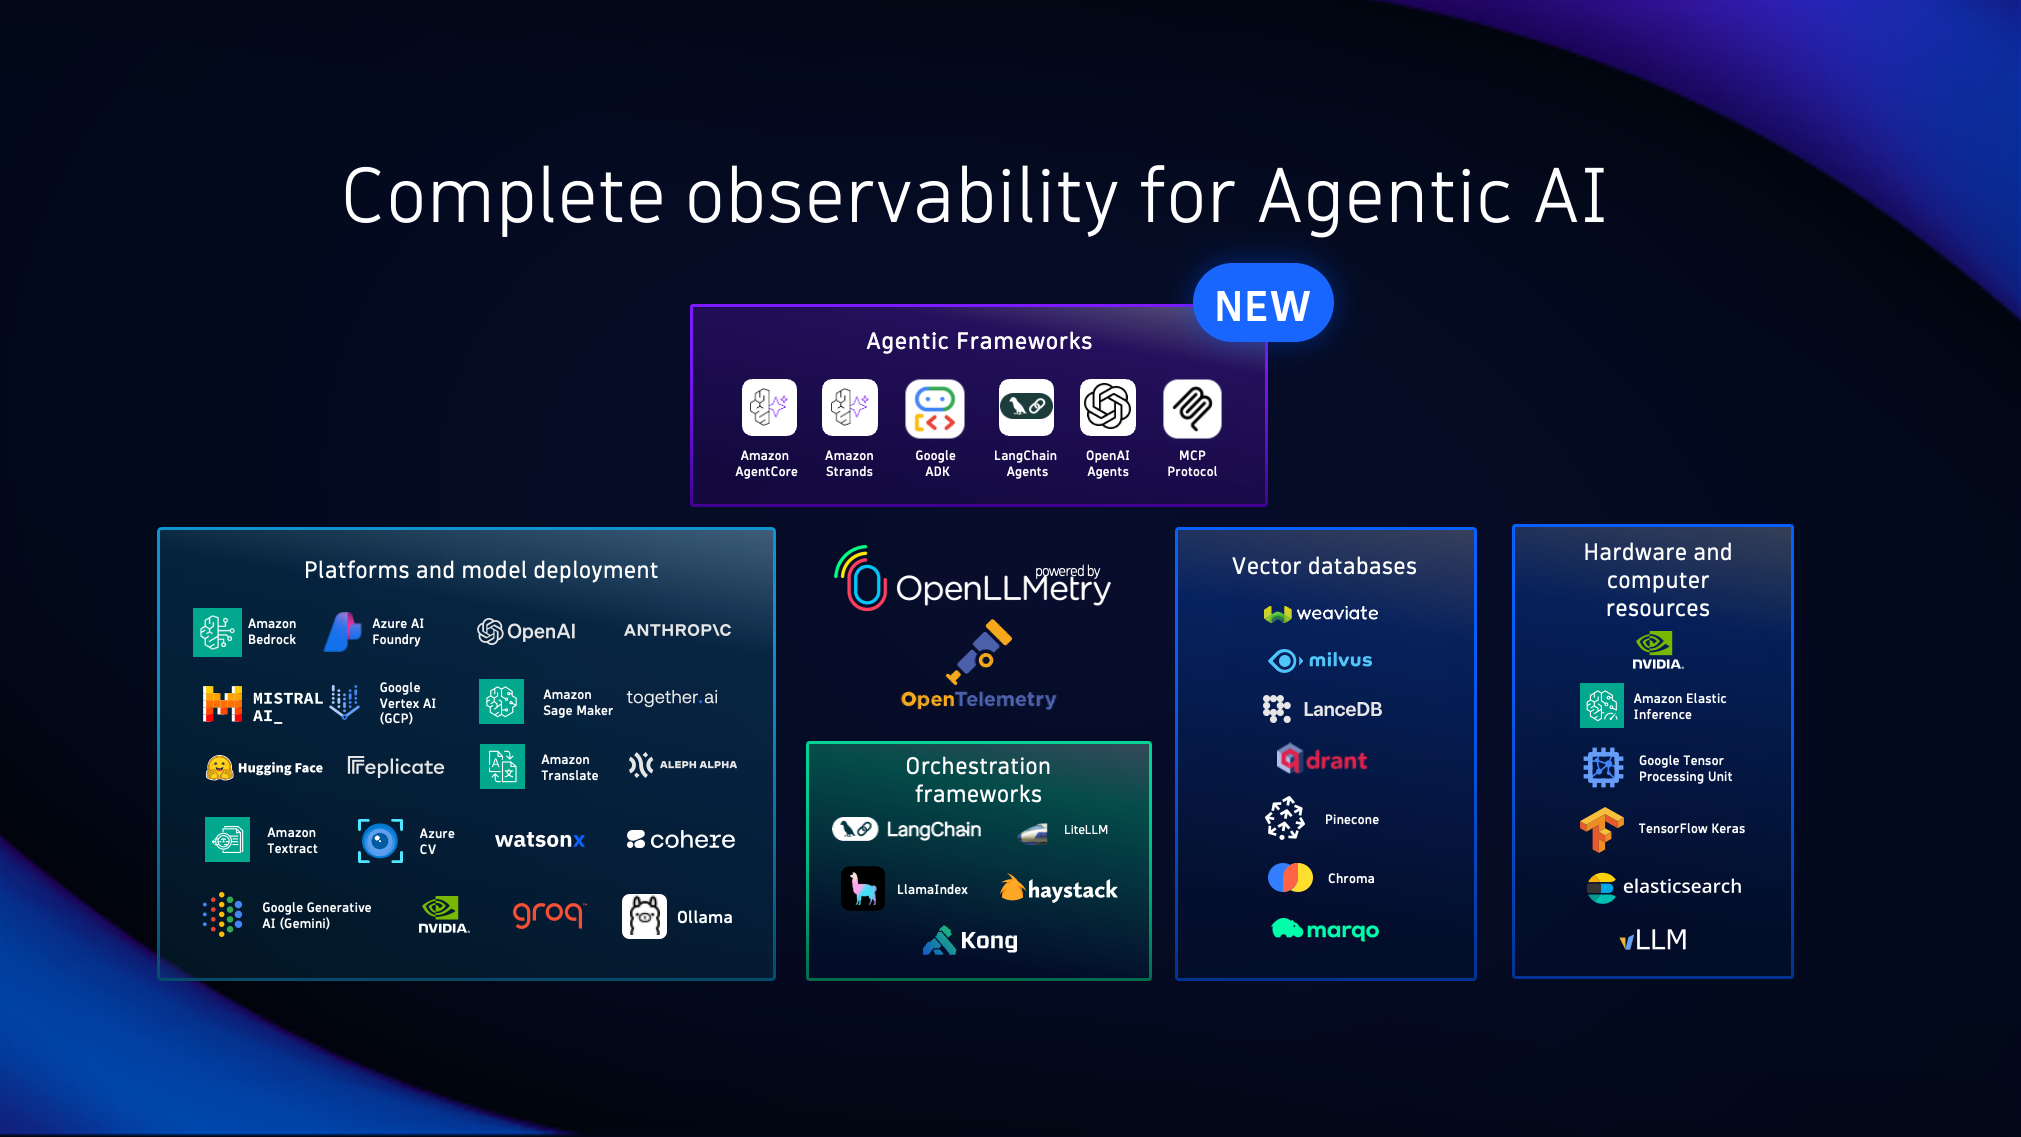
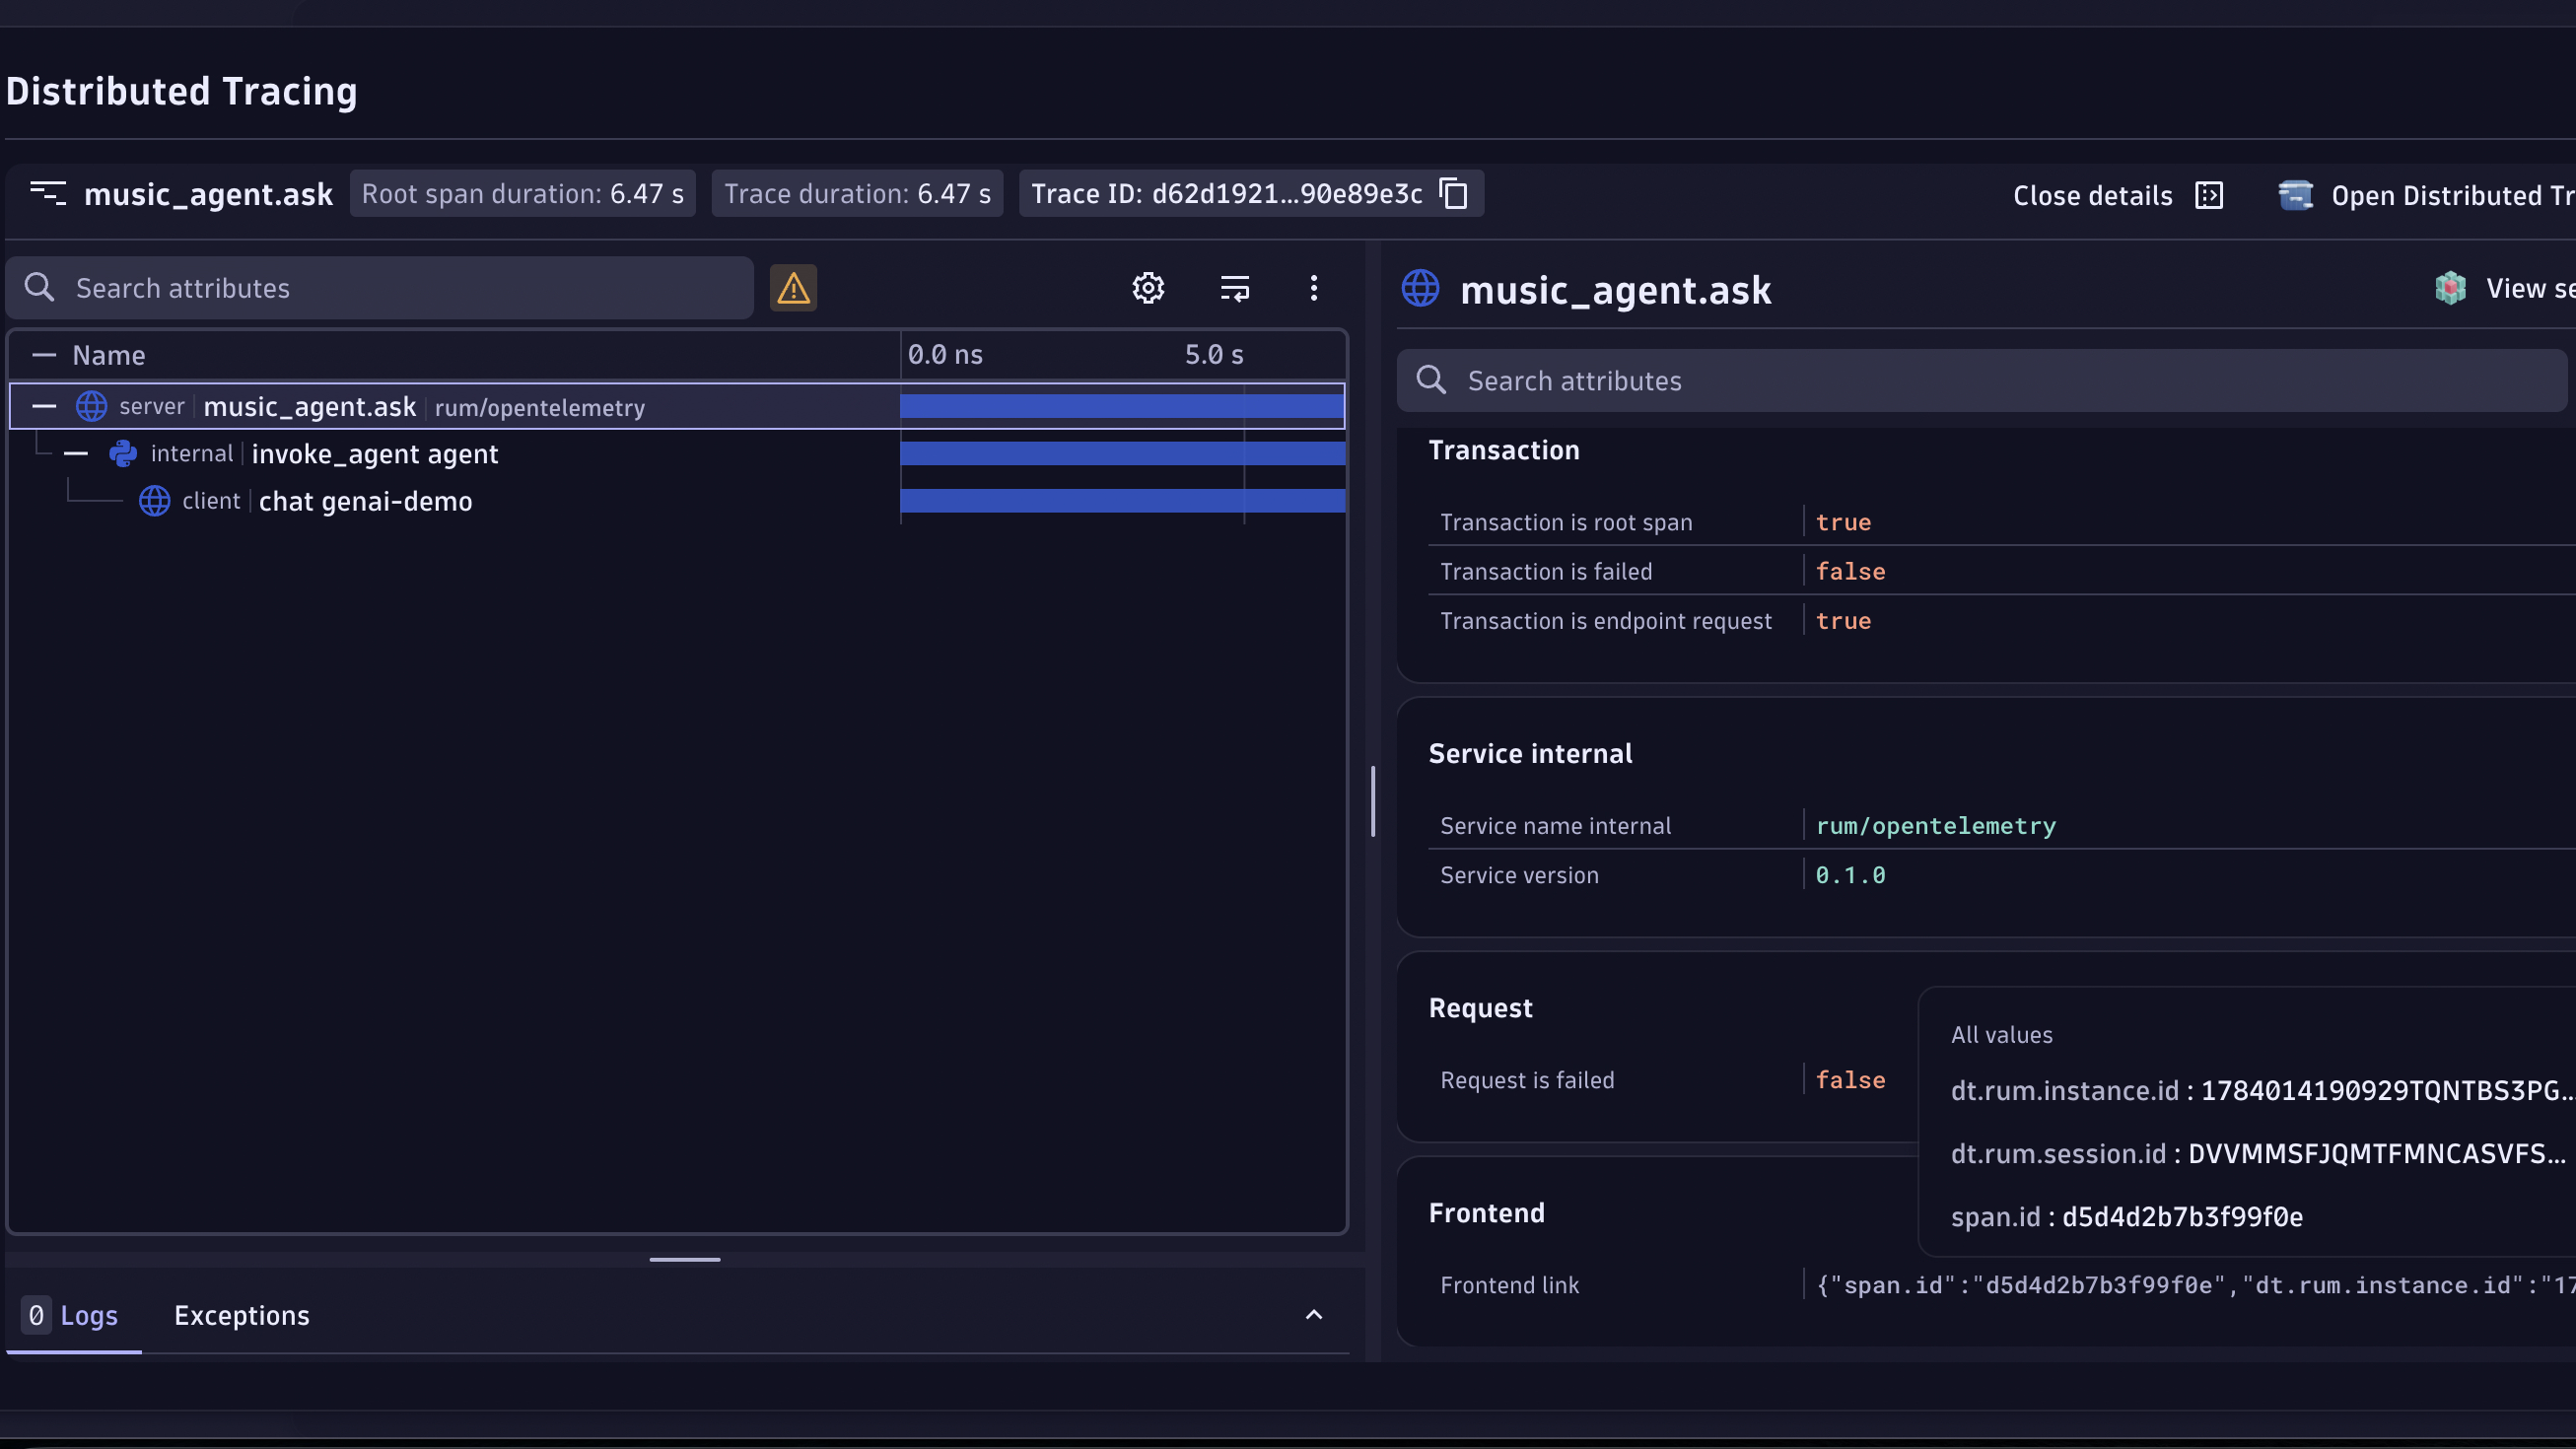
End-to-end observability and monitoring for your Agentic and LLM applicationsAgent topology and visualization - get visibility into agent execution, tool usage and misbehaviorPrompts stream showing all Agent and LLM interactions with model version, token count, and full prompt/response content.Trace-level debug view showing agentic span hierarchy, tool calls, prompt and response content, and agent topology for a single AI agent run.LLM-as-judge evaluation detail with score, pass/fail label, explanation, and gen_ai.evaluation.* attributes.Visualize the evaluation results with pass/fail verdicts, scores, and explanations across agent runs, filterable by model and  providerSend data with ease through OpenTelemetry for large number of technologiesA distributed trace waterfall with the browser user-action span at the top, and LLM/agent child spans nested underneath showing the RUM-to-AI linkage
  • Product information
  • Release notes

Overview

Businesses are adopting Agentic AI, GenAI services and apps at scale — using LLMs for autonomous agents, RAG pipelines, semantic search, and complex multi-step orchestration across dozens of providers and frameworks. Managing the performance, cost, quality, and reliability of these workloads requires purpose-built observability that understands AI-specific signals.

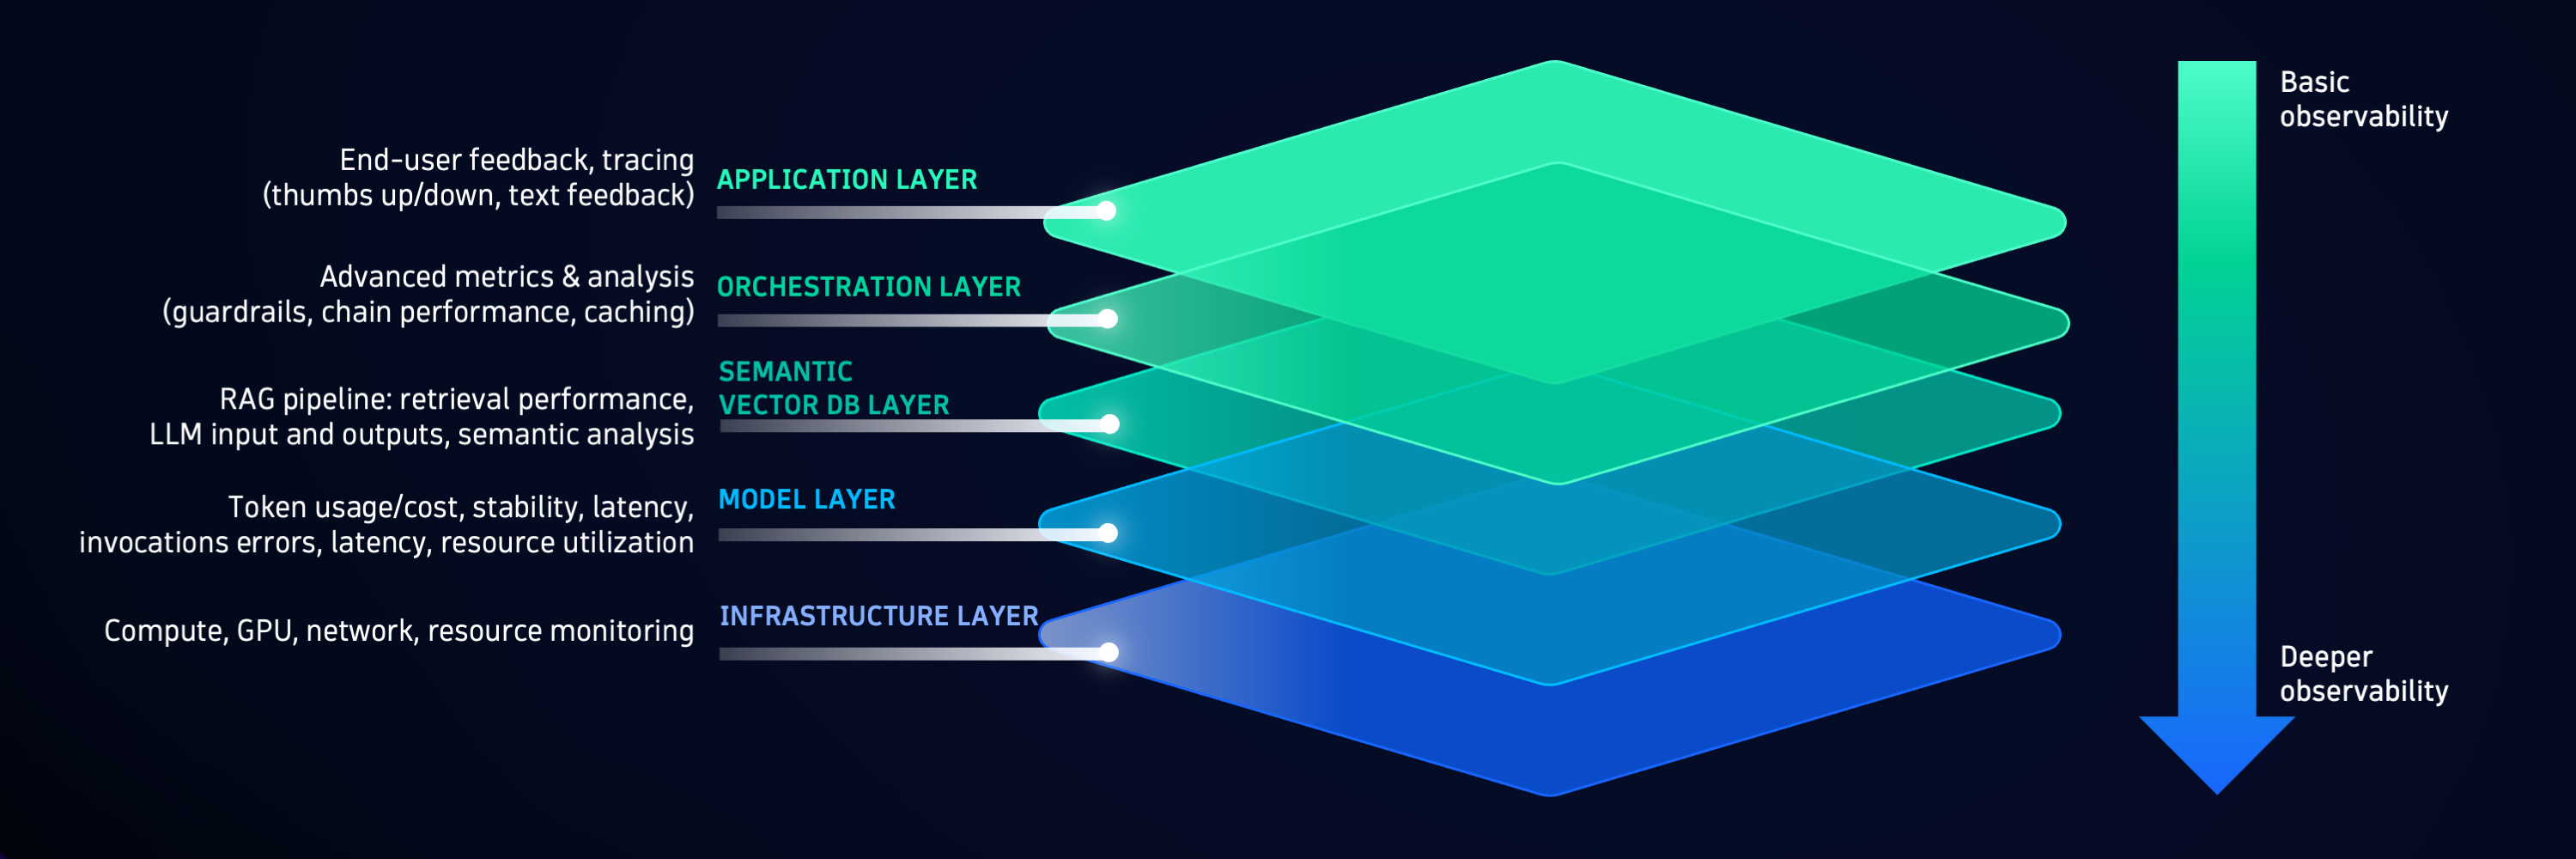
Dynatrace AI Observability provides a unified view across every layer of your whole AI stack: model and provider calls, orchestration frameworks, vector databases, agent topology, and infrastructure to coding agents. It ingests gen_ai.* telemetry from any source — Dynatrace OneAgent (zero-code, automatic), OpenTelemetry (native OTLP), OpenInference or OpenLLMetry and surfaces it in a single, consistent experience without requiring you to change your instrumentation approach

Beyond traces and metrics, Dynatrace AI Observability includes agent topology mapping via Smartscape, showing how agents call each other and which models and tools they depend on in real time. It also supports production AI quality evaluation through dt-evals, enabling LLM-as-judge scoring of live responses so quality regressions are caught alongside performance and cost issues. Set SLOs and get alerts the moment latency, error rate, or cost budgets are breached


Use cases

Monitor agent and model health and performance

  • Track request counts, durations, error rates, and token costs across providers and agent tiers in real time.
  • Set SLOs and get alerts the moment latency, error rate, or cost budgets are breached — with automated remediation workflows to route to fallback models or scale inference capacity.

Visualize agent topology and dependencies

  • Map your full multi-agent system in Smartscape — which agents call each other, which models they use, and which tools and vector stores they depend on.
  • Detect cascading failures and understand the blast radius of a model or provider outage instantly.

End-to-end prompt tracing and debugging

  • Trace prompt flows from user request through agent handoffs, tool calls, and retrieval to final response for faster root cause analysis.
  • Capture full prompt and response content (opt-in) to debug complex pipelines with span-level precision.

Evaluate AI quality in production

  • Score live responses with LLM-as-judge evaluations via dt-evals — completeness, relevance, toxicity — attached to the same spans as latency and cost.

  • Alert on quality score regressions using workflow engine, SLOs and combine with cost and latency signals for confident rollback or rollforward decisions.

Build trust and reduce compliance risk

  • Track every input and output for a complete audit trail, queryable in real time and stored for future reference.

  • Monitor guardrail activations — PII, topic, and content filters — as metrics with full data lineage from prompt to response.

Stitch browser sessions to AI agent traces

  • Connect every user click to the full backend AI span tree via Dynatrace RUM — W3C traceparent headers make each LLM call a child of the browser user-action span.
  • Reconstruct complete multi-turn agent trajectories from first question to final answer using a single gen_ai.conversation.id seeded from the RUM session ID.

Get started

Setting up full stack observability for your GenAI applications is possible with OpenTelemetry, or auto-instrumentation libraries like Traceloop's OpenLLMetry, with OpenTelemetry under the hood, which can seamlessly provide comprehensive end-to-end insights into your production environments.

To set up OpenLLMetry with Dynatrace, see Dynatrace Documentation.

You can access all these capabilities through customizable, ready-made dashboards tailored to your needs.

Dynatrace
Documentation
By Dynatrace
Dynatrace support center
Subscribe to new releases
Copy to clipboard

More resources

Deliver secure, safe, and trustworthy GenAI applications with Amazon Bedrock and Dynatrace

Deliver secure, safe, and trustworthy GenAI applications with Amazon Bedrock and Dynatrace

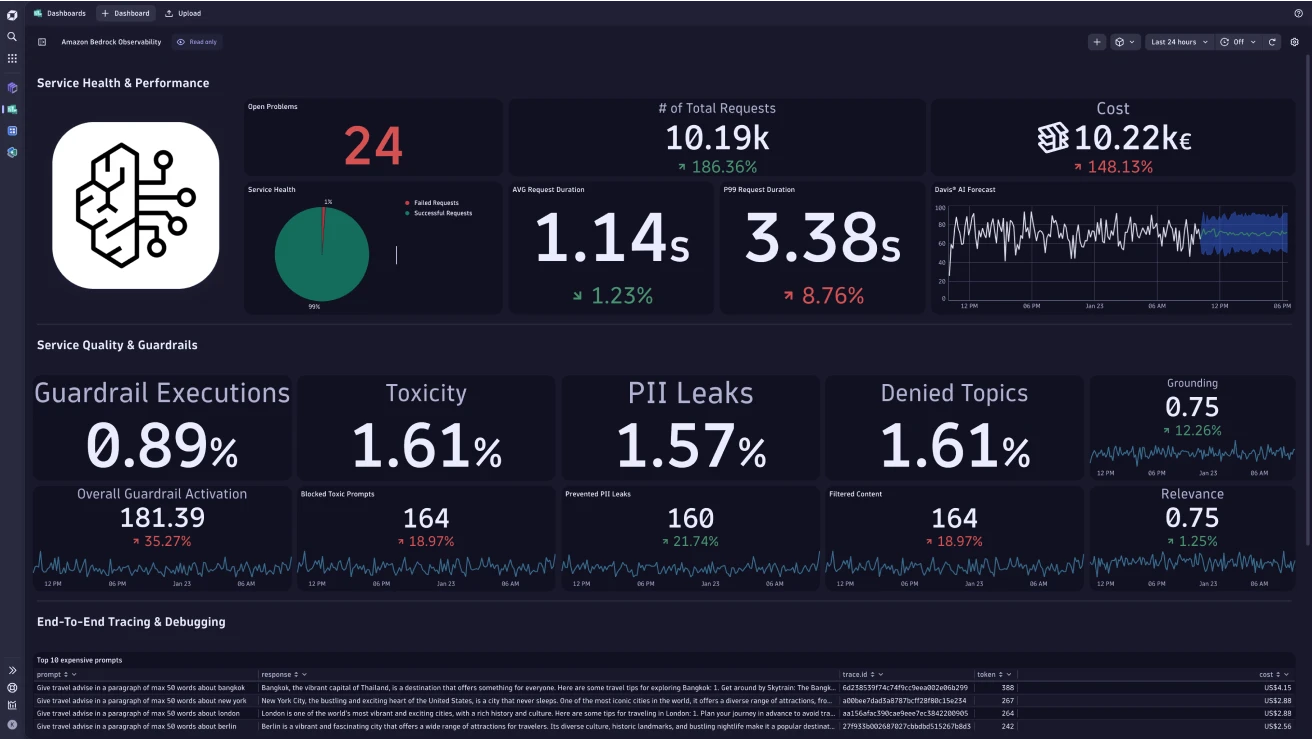
Amazon Bedrock, equipped with Dynatrace Davis® AI and LLM observability, gives you end-to-end insight into the Generative AI stack, from code-level visibility and performance metrics to GenAI-specific guardrails.
Read more
AI and LLM Observability Solution

AI and LLM Observability Solution

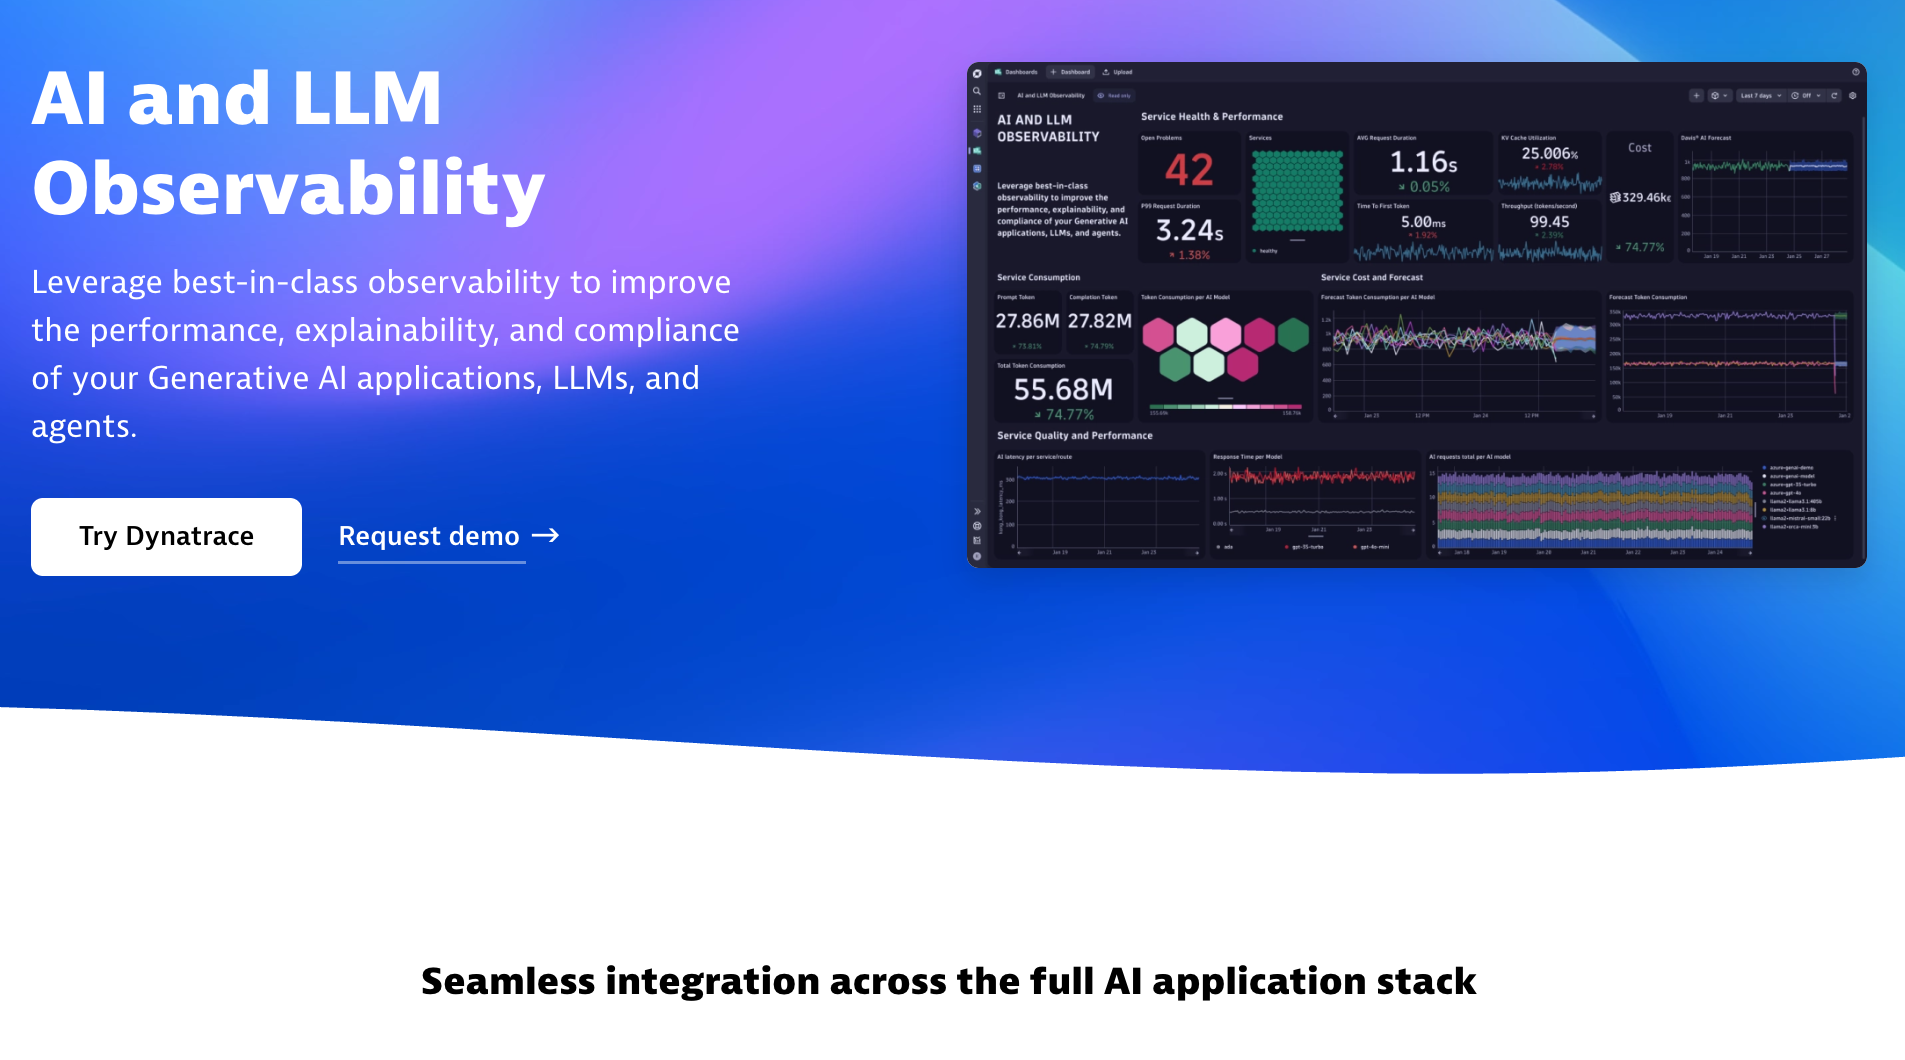
Leverage best-in-class observability to improve the performance, explainability, and compliance of your Generative AI applications, LLMs, and agents.
Read more
AWS Partner Blog: Elevating LLM Observability with Amazon Bedrock and Dynatrace

AWS Partner Blog: Elevating LLM Observability with Amazon Bedrock and Dynatrace

Dynatrace is an all-in-one observability platform that automatically collects production insights, traces, logs, metrics, and real-time application data at scale.
Read more

Full version history

ReleaseDate

Full version history

2.2.19

Patch Changes

  • Fixed single service node doesn't show up in agent topology in prompts sheet
  • Fixed CSS problems

2.2.16

Patch Changes

  • Add OneAgent onboarding flow with guided steps to configure features and validate data
  • Update empty and error state in the agents topology
  • Improve JSON wrapped in Markdown formatting in prompts details

2.2.15

Patch Changes

  • Add Agent Topology in the prompts details sheet
  • Fix detection of LLM spans in Prompt Details
  • Add intent into AI Observability app
  • Agents tab minor improvements
  • Fix Prompt input/output parsing in the services details
  • Fix cost estimation fallback in AB model versioning dashboard

2.2.14

Patch Changes

  • Fix AI Agent timestamp selection

2.2.13

Patch Changes

  • Fix AI Agents page DQL
  • Fix corner case for the DQL in the Service Health Failure chart

2.2.12

Patch Changes

  • Fix Unicode rendering in the Prompt tab
  • Fix prompts details trace table scrolling
  • Fix double loading of the Prompt page
  • Fix filter stability when navigating between pages

2.2.11

Patch Changes

  • Show prompt details sheet when a prompt is selected from the prompts page

2.2.10

Patch Changes

  • Improved DQL performance in the Prompt page
  • Fix Prompts microguide
  • Fix a problem with applying policies for fieldsets
  • Fix start_time column rendering on the Prompt page
  • Fix empty state rendering issues in the Prompt page
  • Fix HTTP Error trend chart DQL

2.2.8

Patch Changes

  • Improve DQL performance for the Prompt page

2.2.7

Patch Changes

  • Fix DQL in dashboards to compute error responses

2.2.6

Patch Changes

  • Minor improvements and 3rd party dependency updates

2.2.5

Patch Changes

  • Fix legend colors for Error rate over time chart
  • Fix Invocation latency chart unit
  • Improved data queries to reduce unnecessary costs spikes for the app

2.2.2

Patch Changes

  • Fix single value charts aggregations

2.2.1

Patch Changes

  • Fix navigation into Distributed Tracing

2.2.0

Minor Changes

  • Open Traces in a modal
  • Move explorer and service health out of Preview
  • Add sampling option to dashboard queries
  • Improve permissions check on onboarding screen

Full version history

2.2.16

Patch Changes

  • Add OneAgent onboarding flow with guided steps to configure features and validate data
  • Update empty and error state in the agents topology
  • Improve JSON wrapped in Markdown formatting in prompts details

2.2.15

Patch Changes

  • Add Agent Topology in the prompts details sheet
  • Fix detection of LLM spans in Prompt Details
  • Add intent into AI Observability app
  • Agents tab minor improvements
  • Fix Prompt input/output parsing in the services details
  • Fix cost estimation fallback in AB model versioning dashboard

2.2.14

Patch Changes

  • Fix AI Agent timestamp selection

2.2.13

Patch Changes

  • Fix AI Agents page DQL
  • Fix corner case for the DQL in the Service Health Failure chart

2.2.12

Patch Changes

  • Fix Unicode rendering in the Prompt tab
  • Fix prompts details trace table scrolling
  • Fix double loading of the Prompt page
  • Fix filter stability when navigating between pages

2.2.11

Patch Changes

  • Show prompt details sheet when a prompt is selected from the prompts page

2.2.10

Patch Changes

  • Improved DQL performance in the Prompt page
  • Fix Prompts microguide
  • Fix a problem with applying policies for fieldsets
  • Fix start_time column rendering on the Prompt page
  • Fix empty state rendering issues in the Prompt page
  • Fix HTTP Error trend chart DQL

2.2.8

Patch Changes

  • Improve DQL performance for the Prompt page

2.2.7

Patch Changes

  • Fix DQL in dashboards to compute error responses

2.2.6

Patch Changes

  • Minor improvements and 3rd party dependency updates

2.2.5

Patch Changes

  • Fix legend colors for Error rate over time chart
  • Fix Invocation latency chart unit
  • Improved data queries to reduce unnecessary costs spikes for the app

2.2.2

Patch Changes

  • Fix single value charts aggregations

2.2.1

Patch Changes

  • Fix navigation into Distributed Tracing

2.2.0

Minor Changes

  • Open Traces in a modal
  • Move explorer and service health out of Preview
  • Add sampling option to dashboard queries
  • Improve permissions check on onboarding screen

Full version history

2.2.15

Patch Changes

  • Add Agent Topology in the prompts details sheet
  • Fix detection of LLM spans in Prompt Details
  • Add intent into AI Observability app
  • Agents tab minor improvements
  • Fix Prompt input/output parsing in the services details
  • Fix cost estimation fallback in AB model versioning dashboard

2.2.14

Patch Changes

  • Fix AI Agent timestamp selection

2.2.13

Patch Changes

  • Fix AI Agents page DQL
  • Fix corner case for the DQL in the Service Health Failure chart

2.2.12

Patch Changes

  • Fix Unicode rendering in the Prompt tab
  • Fix prompts details trace table scrolling
  • Fix double loading of the Prompt page
  • Fix filter stability when navigating between pages

2.2.11

Patch Changes

  • Show prompt details sheet when a prompt is selected from the prompts page

2.2.10

Patch Changes

  • Improved DQL performance in the Prompt page
  • Fix Prompts microguide
  • Fix a problem with applying policies for fieldsets
  • Fix start_time column rendering on the Prompt page
  • Fix empty state rendering issues in the Prompt page
  • Fix HTTP Error trend chart DQL

2.2.8

Patch Changes

  • Improve DQL performance for the Prompt page

2.2.7

Patch Changes

  • Fix DQL in dashboards to compute error responses

2.2.6

Patch Changes

  • Minor improvements and 3rd party dependency updates

2.2.5

Patch Changes

  • Fix legend colors for Error rate over time chart
  • Fix Invocation latency chart unit
  • Improved data queries to reduce unnecessary costs spikes for the app

2.2.2

Patch Changes

  • Fix single value charts aggregations

2.2.1

Patch Changes

  • Fix navigation into Distributed Tracing

2.2.0

Minor Changes

  • Open Traces in a modal
  • Move explorer and service health out of Preview
  • Add sampling option to dashboard queries
  • Improve permissions check on onboarding screen

Full version history

2.2.14

Patch Changes

  • Fix AI Agent timestamp selection

2.2.13

Patch Changes

  • Fix AI Agents page DQL
  • Fix corner case for the DQL in the Service Health Failure chart

2.2.12

Patch Changes

  • Fix Unicode rendering in the Prompt tab
  • Fix prompts details trace table scrolling
  • Fix double loading of the Prompt page
  • Fix filter stability when navigating between pages

2.2.11

Patch Changes

  • Show prompt details sheet when a prompt is selected from the prompts page

2.2.10

Patch Changes

  • Improved DQL performance in the Prompt page
  • Fix Prompts microguide
  • Fix a problem with applying policies for fieldsets
  • Fix start_time column rendering on the Prompt page
  • Fix empty state rendering issues in the Prompt page
  • Fix HTTP Error trend chart DQL

2.2.8

Patch Changes

  • Improve DQL performance for the Prompt page

2.2.7

Patch Changes

  • Fix DQL in dashboards to compute error responses

2.2.6

Patch Changes

  • Minor improvements and 3rd party dependency updates

2.2.5

Patch Changes

  • Fix legend colors for Error rate over time chart
  • Fix Invocation latency chart unit
  • Improved data queries to reduce unnecessary costs spikes for the app

2.2.2

Patch Changes

  • Fix single value charts aggregations

2.2.1

Patch Changes

  • Fix navigation into Distributed Tracing

2.2.0

Minor Changes

  • Open Traces in a modal
  • Move explorer and service health out of Preview
  • Add sampling option to dashboard queries
  • Improve permissions check on onboarding screen

Full version history

2.2.13

Patch Changes

  • Fix AI Agents page DQL
  • Fix corner case for the DQL in the Service Health Failure chart

2.2.12

Patch Changes

  • Fix Unicode rendering in the Prompt tab
  • Fix prompts details trace table scrolling
  • Fix double loading of the Prompt page
  • Fix filter stability when navigating between pages

2.2.11

Patch Changes

  • Show prompt details sheet when a prompt is selected from the prompts page

2.2.10

Patch Changes

  • Improved DQL performance in the Prompt page
  • Fix Prompts microguide
  • Fix a problem with applying policies for fieldsets
  • Fix start_time column rendering on the Prompt page
  • Fix empty state rendering issues in the Prompt page
  • Fix HTTP Error trend chart DQL

2.2.8

Patch Changes

  • Improve DQL performance for the Prompt page

2.2.7

Patch Changes

  • Fix DQL in dashboards to compute error responses

2.2.6

Patch Changes

  • Minor improvements and 3rd party dependency updates

2.2.5

Patch Changes

  • Fix legend colors for Error rate over time chart
  • Fix Invocation latency chart unit
  • Improved data queries to reduce unnecessary costs spikes for the app

2.2.2

Patch Changes

  • Fix single value charts aggregations

2.2.1

Patch Changes

  • Fix navigation into Distributed Tracing

2.2.0

Minor Changes

  • Open Traces in a modal
  • Move explorer and service health out of Preview
  • Add sampling option to dashboard queries
  • Improve permissions check on onboarding screen

Full version history

2.2.12

Patch Changes

  • Fix Unicode rendering in the Prompt tab
  • Fix prompts details trace table scrolling
  • Fix double loading of the Prompt page
  • Fix filter stability when navigating between pages

2.2.11

Patch Changes

  • Show prompt details sheet when a prompt is selected from the prompts page

2.2.10

Patch Changes

  • Improved DQL performance in the Prompt page
  • Fix Prompts microguide
  • Fix a problem with applying policies for fieldsets
  • Fix start_time column rendering on the Prompt page
  • Fix empty state rendering issues in the Prompt page
  • Fix HTTP Error trend chart DQL

2.2.8

Patch Changes

  • Improve DQL performance for the Prompt page

2.2.7

Patch Changes

  • Fix DQL in dashboards to compute error responses

2.2.6

Patch Changes

  • Minor improvements and 3rd party dependency updates

2.2.5

Patch Changes

  • Fix legend colors for Error rate over time chart
  • Fix Invocation latency chart unit
  • Improved data queries to reduce unnecessary costs spikes for the app

2.2.2

Patch Changes

  • Fix single value charts aggregations

2.2.1

Patch Changes

  • Fix navigation into Distributed Tracing

2.2.0

Minor Changes

  • Open Traces in a modal
  • Move explorer and service health out of Preview
  • Add sampling option to dashboard queries
  • Improve permissions check on onboarding screen

Full version history

2.2.11

Patch Changes

  • Show prompt details sheet when a prompt is selected from the prompts page

2.2.10

Patch Changes

  • Improved DQL performance in the Prompt page
  • Fix Prompts microguide
  • Fix a problem with applying policies for fieldsets
  • Fix start_time column rendering on the Prompt page
  • Fix empty state rendering issues in the Prompt page
  • Fix HTTP Error trend chart DQL

2.2.8

Patch Changes

  • Improve DQL performance for the Prompt page

2.2.7

Patch Changes

  • Fix DQL in dashboards to compute error responses

2.2.6

Patch Changes

  • Minor improvements and 3rd party dependency updates

2.2.5

Patch Changes

  • Fix legend colors for Error rate over time chart
  • Fix Invocation latency chart unit
  • Improved data queries to reduce unnecessary costs spikes for the app

2.2.2

Patch Changes

  • Fix single value charts aggregations

2.2.1

Patch Changes

  • Fix navigation into Distributed Tracing

2.2.0

Minor Changes

  • Open Traces in a modal
  • Move explorer and service health out of Preview
  • Add sampling option to dashboard queries
  • Improve permissions check on onboarding screen

Full version history

2.2.10

Patch Changes

  • Improved DQL performance in the Prompt page
  • Fix Prompts microguide
  • Fix a problem with applying policies for fieldsets
  • Fix start_time column rendering on the Prompt page
  • Fix empty state rendering issues in the Prompt page
  • Fix HTTP Error trend chart DQL

2.2.8

Patch Changes

  • Improve DQL performance for the Prompt page

2.2.7

Patch Changes

  • Fix DQL in dashboards to compute error responses

2.2.6

Patch Changes

  • Minor improvements and 3rd party dependency updates

2.2.5

Patch Changes

  • Fix legend colors for Error rate over time chart
  • Fix Invocation latency chart unit
  • Improved data queries to reduce unnecessary costs spikes for the app

2.2.2

Patch Changes

  • Fix single value charts aggregations

2.2.1

Patch Changes

  • Fix navigation into Distributed Tracing

2.2.0

Minor Changes

  • Open Traces in a modal
  • Move explorer and service health out of Preview
  • Add sampling option to dashboard queries
  • Improve permissions check on onboarding screen

Full version history

2.2.8

Patch Changes

  • Improve DQL performance for the Prompt page to address performance issues

2.2.7

Patch Changes

  • Fix DQL in dashboards to compute error responses

2.2.6

Patch Changes

  • Minor improvements and 3rd party dependency updates

2.2.5

Patch Changes

  • Fix legend colors for Error rate over time chart
  • Fix Invocation latency chart unit
  • Improved data queries to reduce unnecessary costs spikes for the app

2.2.2

Patch Changes

  • Fix single value charts aggregations

2.2.1

Patch Changes

  • Fix navigation into Distributed Tracing

2.2.0

Minor Changes

  • Open Traces in a modal
  • Move explorer and service health out of Preview
  • Add sampling option to dashboard queries
  • Improve permissions check on onboarding screen

Full version history

2.2.7

Patch Changes

  • Fix DQL in dashboards to compute error responses

2.2.6

Patch Changes

  • Minor improvements and 3rd party dependency updates

2.2.5

Patch Changes

  • Fix legend colors for Error rate over time chart
  • Fix Invocation latency chart unit
  • Improved data queries to reduce unnecessary costs spikes for the app

2.2.2

Patch Changes

  • Fix single value charts aggregations

2.2.1

Patch Changes

  • Fix navigation into Distributed Tracing

2.2.0

Minor Changes

  • Open Traces in a modal
  • Move explorer and service health out of Preview
  • Add sampling option to dashboard queries
  • Improve permissions check on onboarding screen

Full version history

2.2.6

Patch Changes

  • Minor improvements and 3rd party dependency updates

2.2.5

Patch Changes

  • Fix legend colors for Error rate over time chart
  • Fix Invocation latency chart unit
  • Improved data queries to reduce unnecessary costs spikes for the app

2.2.2

Patch Changes

  • Fix single value charts aggregations

2.2.1

Patch Changes

  • Fix navigation into Distributed Tracing

2.2.0

Minor Changes

  • Open Traces in a modal
  • Move explorer and service health out of Preview
  • Add sampling option to dashboard queries
  • Improve permissions check on onboarding screen

Full version history

2.2.5

Patch Changes

  • Fix legend colors for Error rate over time chart
  • Fix Invocation latency chart unit
  • Improved data queries to reduce unnecessary costs spikes for the app

2.2.2

Patch Changes

  • Fix single value charts aggregations

2.2.1

Patch Changes

  • Fix navigation into Distributed Tracing

2.2.0

Minor Changes

  • Open Traces in a modal
  • Move explorer and service health out of Preview
  • Add sampling option to dashboard queries
  • Improve permissions check on onboarding screen

Full version history

2.2.2

Patch Changes

  • Fix single value charts aggregations

2.2.1

Patch Changes

  • Fix navigation into Distributed Tracing

2.2.0

Minor Changes

  • Open Traces in a modal
  • Move explorer and service health out of Preview
  • Add sampling option to dashboard queries
  • Improve permissions check on onboarding screen

Full version history

2.2.1

Patch Changes

  • Fix navigation into Distributed Tracing

2.2.0

Patch Changes

  • Open Traces in a modal
  • Move explorer and service health out of Preview
  • Add sampling option to dashboard queries
  • Improve permissions check on onboarding screen

Full version history

2.2.0

Minor Changes

  • Open Traces in a modal
  • Move explorer and service health out of Preview
  • Add sampling option to dashboard queries
  • Improve permissions check on onboarding screen

Full version history

2.1.2

Patch Changes

  • Minor UI improvements

2.1.1

Patch Changes

  • Filters are preserved across pages
  • Improved DQLs to handle corner cases
  • Removed guardrail charts

2.1.0

Minor Changes

  • Introduce a helper guide for the Overview page
  • Introduce a helper guide for the Service Health page

Patch Changes

  • Adjust colors for the Error Rate chart
  • Add ticks for Single Value Charts
  • Fix intent into Dynatrace Distributed Tracing

Full version history

2.1.1

Patch Changes

  • Filters are preserved across pages
  • Improved DQLs to handle corner cases
  • Removed unused guardrail charts

2.1.0

Minor Changes

  • Introduce a helper guide for the Overview page
  • Introduce a helper guide for the Service Health page

Patch Changes

  • Adjust colors for the Error Rate chart
  • Add ticks for Single Value Charts
  • Fix intent into Dynatrace Distributed Tracing

Full version history

2.1.0

Minor Changes

  • Introduce a helper guide for the Overview page
  • Introduce a helper guide for the Service Health page

Patch Changes

  • Adjust colors for the Error Rate chart
  • Add ticks for Single Value Charts
  • Fix intent into Dynatrace Distributed Tracing

Full version history

2.0.8

Patch Changes

  • Disable segments selection if the user doesn't have permissions
  • Improve integration with other Apps
  • Improve DQLs covering edge cases

2.0.7

Patch Changes

  • Fix the problem of missing Ready-made Dashboards

2.0.6

Patch Changes

  • Improve App performance
  • Improve support for OpenTelemetry

2.0.5

Patch Changes

  • Fixed onboarding URL handling and example values for OpenLLMetry
  • Fixed Overview page calculation inconsistencies

2.0.4

Patch Changes

  • Fixes an issue where the "Overall average cost per request" would be miscalculated when there are no requests.

2.0.3

Patch Changes

  • Fixed token generation error handling.
  • Fixed cost calculation on the overview section.
  • Fixed onboarding video rendering.

2.0.1

Major Changes

  • Observability for 20+ AI, Agent and LLM technologies
  • Overview of your multi-cloud and multi-ai workloads setup and visibility into performance, cost, errors, latency metrics.
  • Visibility into model providers, LLMs and Agent calls, prompts, metrics, guardrails and traces.
  • Intelligent alerting for AI workloads
  • Dedicated onboarding experience for OpenTelemetry and Cloud Monitoring
  • Ready-made dashboards for AWS, Azure, OpenAI, NVIDIA, Kong, Model versioning and A/B testing

Full version history

2.0.7

Patch Changes

  • Fix the problem of missing Ready-made Dashboards

Full version history

2.0.6

Patch Changes

  • Improve App performance
  • Improve support for OpenTelemetry

Full version history

2.0.4

Patch Changes

  • Fixes an issue where the "Overall average cost per request" would be miscalculated when there are no requests.

2.0.3

Patch Changes

  • Fixed token generation error handling.
  • Fixed cost calculation on the overview section.
  • Fixed onboarding video rendering.

2.0.1

Major Changes

  • Observability for 20+ AI, Agent and LLM technologies
  • Overview of your multi-cloud and multi-ai workloads setup and visibility into performance, cost, errors, latency metrics.
  • Visibility into model providers, LLMs and Agent calls, prompts, metrics, guardrails and traces.
  • Intelligent alerting for AI workloads
  • Dedicated onboarding experience for OpenTelemetry and Cloud Monitoring
  • Ready-made dashboards for AWS, Azure, OpenAI, NVIDIA, Kong, Model versioning and A/B testing

Full version history

2.0.3

Patch Changes

  • Fixed token generation error handling.
  • Fixed cost calculation on the overview section.
  • Fixed onboarding video rendering.

2.0.1

Major Changes

  • Observability for 20+ AI, Agent and LLM technologies
  • Overview of your multi-cloud and multi-ai workloads setup and visibility into performance, cost, errors, latency metrics.
  • Visibility into model providers, LLMs and Agent calls, prompts, metrics, guardrails and traces.
  • Intelligent alerting for AI workloads
  • Dedicated onboarding experience for OpenTelemetry and Cloud Monitoring
  • Ready-made dashboards for AWS, Azure, OpenAI, NVIDIA, Kong, Model versioning and A/B testing

Full version history

2.0.1

Major Changes

  • Observability for 20+ AI, Agent and LLM technologies
  • Overview of your multi-cloud and multi-ai workloads setup and visibility into performance, cost, errors, latency metrics.
  • Visibility into model providers, LLMs and Agent calls, prompts, metrics, guardrails and traces.
  • Intelligent alerting for AI workloads
  • Dedicated onboarding experience for OpenTelemetry and Cloud Monitoring
  • Ready-made dashboards for AWS, Azure, OpenAI, NVIDIA, Kong, Model versioning and A/B testing

Full version history

1.3.1

Patch Changes

  • Fix handling the case of no data available

1.3.0

Minor Changes

  • Ready-made dashboard for model versioning and A/B testing of prompts
  • Ready-made dashboards for AI service compliance and audit trails
  • Ready-made dashboard for Kong AI Gateway

Full version history

1.1.2

Patch Changes

  • a50eb79: Align naming

1.1.0

Minor Changes

  • 3288a76: Ready-Made dashboard for Google Gemini and Vertex AI Studio
Dynatrace Hub
Hub HomeGet data into DynatraceBuild your own app
Dynatrace Intelligence - Agentic Operations SystemThe Dynatrace Agentic AI ecosystem
Log Management and AnalyticsKubernetesAI and LLM ObservabilityInfrastructure ObservabilitySoftware DeliveryApplication ObservabilityApplication SecurityBusiness ObservabilityDigital Experience
Filter
Type
Built and maintained by
Deployment model
SaaS
  • SaaS
  • Managed
Partner FinderBecome a partnerDynatrace Developer

193 Results

Found in 'All'

AI Observability logo

AI Observability

End-to-end observability for your Agentic AI and LLM workloads.

App
  • Agentic AI
  • ai
  • genai
  • OpenAI
  • agent
  • Agentcore
  • agentic
  • anthropic
  • aws
  • azure
  • bedrock
  • Claude
  • foundry
  • gemini
  • GPT
  • kong
  • Large Language Model (LLM)
  • LLM
  • nvidia
  • OpenTelemetry
  • OTel
  • rum
  • vertex
AWS Strands Agents logo

AWS Strands Agents

Observe your AWS Strands Agents AI agents with Dynatrace AI Observability.

Technology
  • ai observability
  • agentic ai
  • genai
  • agent framework
  • agents
  • aws
  • aws strands
  • llm
  • strands agents
Fluent Bit logo

Fluent Bit

Stream logs to Dynatrace via Fluent Bit for analysis and AI observability.

Technology
  • open observability
  • data-collection
  • fluent bit
  • journald
  • Kubernetes
  • log-analytics
  • logging
  • log-ingest-integration
  • log managenet and analytics
  • logs
OpenClaw Monitoring logo

OpenClaw Monitoring

Monitor OpenClaw agent activity with AI observability in Dynatrace.

Technology
Postman logo

Postman

Bring real runtime observability into Postman’s Agent Mode for API workflows.

Technology
  • agentic ai
  • ai
  • a2a
  • agentic-ecosystem
  • api
  • mcp
  • model context protocol
  • postman
  • readymade-agent
Amazon Bedrock AgentCore Gateway logo

Amazon Bedrock AgentCore Gateway

Enable Bedrock agents to access Dynatrace for real‑time observability insights.

Technology
  • AI observability
  • AI
  • a2a
  • AgentCore Gateway
  • agentic-coding
  • agentic-ecosystem
  • Amazon Bedrock
  • Bedrock AgentCore
  • MCP
  • Model Context Protocol
Akamai DataStream 2 logo

Akamai DataStream 2

Ingest Akamai Edge logs into Dynatrace for real-time observability.

Technology by Akamai
  • akamai
  • logs in grail
  • logs on grail
  • datastream
  • edge logs
  • log
  • log-analytics
  • log-ingest-integration
  • log management and analytics
  • logs
Cloud Foundry logo

Cloud Foundry

Harness automation and AI to simplify observability on Cloud Foundry at scale.

Technology
  • container
  • cloud
  • development-environment
  • infrastructure
  • paas
Google Cloud Run logo

Google Cloud Run

Dynatrace provides AI-powered observability into serverless containerized apps running on Google Cloud Run.

Technology
  • container
  • cloud
  • serverless
Red Hat OpenShift logo

Red Hat OpenShift

Harness automation and AI to simplify observability on OpenShift at scale.

Technology
  • container
  • apm
  • cloud
  • full-stack
  • infrastructure
  • k8s
  • Kubernetes
  • log-analytics
  • microservices
  • openshift
  • red-hat
VMware Tanzu logo

VMware Tanzu

Harness automation and AI to simplify Kubernetes observability at scale.

Technology
  • container
  • application
  • infrastructure
  • k8s
  • Kubernetes
  • pivotal
  • pods
  • TGKI
  • TKGI
Amazon Elastic Kubernetes Service (EKS) logo

Amazon Elastic Kubernetes Service (EKS)

Harness automation and AI to simplify Kubernetes observability at scale.

Technology
  • container
  • apm
  • aws
  • azure kubernetes service
  • cloud
  • cloud-extension
  • EKS
  • full-stack
  • infrastructure
  • k8s
  • log-analytics
  • microservices
  • platform
  • pods
IBM Cloud Kubernetes Service logo

IBM Cloud Kubernetes Service

Harness automation and AI to simplify Kubernetes observability at scale.

Technology
  • container
  • apm
  • cloud
  • full-stack
  • ibm
  • iks
  • infrastructure
  • k8s
  • Kubernetes
  • log-analytics
  • microservices
  • platform
  • pods
Rancher Kubernetes Engine (RKE) logo

Rancher Kubernetes Engine (RKE)

Harness automation and AI to simplify Kubernetes observability at scale.

Technology
  • container
  • apm
  • k8s
  • Kubernetes
  • pods
Google Kubernetes Engine (GKE) logo

Google Kubernetes Engine (GKE)

Harness automation and AI to simplify Kubernetes observability at scale.

Technology
  • container
  • apm
  • autopilot
  • cloud
  • cloud-extension
  • full-stack
  • gke
  • infrastructure
  • k8s
  • Kubernetes
  • log-analytics
  • microservices
  • platform
  • pods
Azure Kubernetes Service (AKS) logo

Azure Kubernetes Service (AKS)

Harness automation and AI to simplify Kubernetes observability at scale.

Technology
  • container
  • aks
  • apm
  • azure
  • cloud
  • cloud-extension
  • full-stack
  • infrastructure
  • k8s
  • Kubernetes
  • log-analytics
  • microservices
  • platform
  • pods
Fastly Real-Time Log Streaming logo

Fastly Real-Time Log Streaming

Ingest CDN logs from Fastly into Dynatrace for real-time observability.

Technology by Fastly
  • logs in grail
  • logs on grail
  • audit
  • log analytics
  • log-ingest-integration
  • logs
  • network
  • network security
  • security
Azure Bing Custom Search logo

Azure Bing Custom Search

An easy-to-use, ad-free, commercial-grade search tool that lets you deliver the results you want.

Technology
  • ai
  • machine-learning
  • Microsoft Azure
Amazon Q logo

Amazon Q

Bring production context and Dynatrace Intelligence directly into dev workflows.

Technology
  • AI
  • a2a
  • agentic-coding
  • agentic-ecosystem
  • Amazon Q
  • AWS
  • Kiro
  • Kiro CLI
  • MCP
  • Model Context Protocol
Azure Anomaly Detector logo

Azure Anomaly Detector

Detects anomalies in time series data with numerical values that are uniformly spaced in time.

Technology
  • ai
  • machine-learning
  • Microsoft Azure
Help Agent logo

Help Agent

Answers general questions about Dynatrace product functionality and apps.

Technology
  • AI
  • generative AI
  • agentic-operations-system
  • Foundation agent
  • MCP
  • Model Context Protocol
  • readymade-agent
Azure Face logo

Azure Face

An AI service that analyzes faces in images.

Technology
  • ai
  • machine-learning
  • Microsoft Azure
Amazon Nova logo

Amazon Nova

Monitor and trace Amazon Nova models running on Amazon Bedrock.

Technology
  • AI
  • Amazon Bedrock
  • Amazon Bedrock AgentCore
  • AWS
  • Foundational models
  • LLM
  • Nova
Log Pattern Agent logo

Log Pattern Agent

Reduce the time spent navigating entities and looking up individual log events.

Technology
  • AI
  • agentic-operations-system
  • agentic-workflows
  • log management and analytics
  • logs
  • MCP
  • Model Context Protocol
  • readymade-agent
coming soon
Agentic Workflows logo

Agentic Workflows

Build agentic workflows to automate, orchestrate and govern operations at scale.

Technology
  • AI
  • agentic-operations-system
  • agentic-workflows
  • automations
  • MCP
  • Model Context Protocol
  • workflows
Kiro logo

Kiro

Get code-level insights for troubleshooting optimization and remediation.

Technology
  • AI
  • a2a
  • agentic-coding
  • agentic-ecosystem
  • amazon
  • aws
  • Kiro
  • mcp
  • Model Context Protocol
CrewAI logo

CrewAI

Monitor CrewAI workloads and AI Agents.

Technology
  • AI
  • AI Agent
  • CrewAI
  • OpenAI
  • Anthropic
  • AWS
  • Azure
  • Bedrock
  • GCP
  • LLM
  • Meta
Alert Reduction Agent logo

Alert Reduction Agent

Weekly report that pinpoints noisy alert configurations causing alert fatigue.

Technology
  • AI
  • agentic-operations-system
  • agentic-workflows
  • MCP
  • Model Context Protocol
  • readymade-agent
Databricks logo

Databricks

Monitor your Databricks Clusters via its multiple APIs!.

Extension
  • ai
  • aws
  • azure
  • databricks
  • gcp
  • machine learning
  • machine-learning
Windsurf IDE logo

Windsurf IDE

Boost developer productivity and get real-time, code-level insights on Windsurf.

Technology
  • AI
  • a2a
  • agentic-coding
  • agentic-ecosystem
  • MCP
  • Model Context Protocol
Vulnerability Verification Agent logo

Vulnerability Verification Agent

Validate third-party findings that matter – focus smarter, remediate faster.

Technology
  • AI
  • agentic-operations-system
  • agentic-security
  • agentic-workflows
  • MCP
  • Model Context Protocol
  • readymade-agent
Google ADK logo

Google ADK

Monitor your Google Agent Development Kit.

Technology
  • Agentic AI
  • AI
  • Agent
  • Google ADK
  • LLM
  • MCP
GitHub Copilot Coding Agent logo

GitHub Copilot Coding Agent

Automate vulnerability remediation and boost developer productivity.

Technology
  • AI
  • a2a
  • agentic-coding
  • agentic-ecosystem
  • agentic-security
  • mcp
  • Model Context Protocol
Dynatrace Assist logo

Dynatrace Assist

Dynatrace Assist: Ask, analyze, and act with Dynatrace Intelligence.

App
  • ai
  • generative-ai
  • agentic-operations-system
  • chat
  • copilot
  • davis
  • MCP
  • Model Context Protocol
Auto-Adaptive Threshold Agent logo

Auto-Adaptive Threshold Agent

Automatically adapts anomaly detection thresholds to avoid false positives.

Technology
  • AI
  • agentic-operations-system
  • anomaly detection
  • Foundation agent
  • MCP
  • Model Context Protocol
  • readymade-agent
coming soon
Atlassian Rovo Ops logo

Atlassian Rovo Ops

Resolve incidents faster with Dynatrace agentic insights in JIRA or Confluence.

Technology
  • AI
  • a2a
  • agentic-ecosystem
  • agentic-itsm
  • agentic-sre-itops
  • atlassian
  • jira
  • mcp
  • Model Context Protocol
  • readymade-agent
Azure Language Understanding (LUIS) logo

Azure Language Understanding (LUIS)

An AI service that allows users to interact with your applications, bots, and IoT devices by using natural language.

Technology
  • ai
  • machine-learning
  • Microsoft Azure
Azure Personalizer logo

Azure Personalizer

An AI service that prioritizes relevant content, layouts, and conversations to deliver personalized user experience.

Technology
  • ai
  • machine-learning
  • Microsoft Azure
Azure Custom Vision Prediction logo

Azure Custom Vision Prediction

Customize computer vision for specific domain. No machine learning expertise is required.

Technology
  • ai
  • machine-learning
  • Microsoft Azure
Azure Speech To Text logo

Azure Speech To Text

An AI service that accurately converts spoken audio to text.

Technology
  • ai
  • machine-learning
  • Microsoft Azure
GitHub Copilot logo

GitHub Copilot

Accelerate code-level error-resolution with real-time production insights.

Technology
  • ai
  • a2a
  • agentic-coding
  • agentic-ecosystem
  • DEBUGGING
  • github
  • mcp
  • model context protocol
OpenAI Connector for Workflows logo

OpenAI Connector for Workflows

Connect with OpenAI and send prompts for further analysis using Workflows.

Technology by Community
  • AI
  • generative AI
  • agentic-workflows
  • automation
  • community
  • community-app
  • connector
  • LLM
  • se-coe
  • workflows
  • community
Azure SRE Agent logo

Azure SRE Agent

Unlock autonomous cloud operations fueled by Dynatrace insights.

Technology
  • AI
  • a2a
  • agentic-ecosystem
  • agentic-sre-itops
  • azure
  • mcp
  • microsoft
  • Model Context Protocol
  • readymade-agent
Azure Text Analytics logo

Azure Text Analytics

Uncover insights such as sentiment, entities, and key phrases in unstructured text.

Technology
  • ai
  • machine-learning
  • Microsoft Azure
TensorFlow Keras logo

TensorFlow Keras

Observe the training progress of TensorFlow Keras AI models.

Technology
  • AI Observability
  • ai
  • Maschine Learning
  • TensorBoard
Google Vertex AI logo

Google Vertex AI

Get insights into Google Vertex AI service metrics.

Extension
  • ai
  • gcp ai
  • google ai
  • artificial-intelligence
  • cloud
  • cloud-and-infrastructure
  • gcp
  • Google Cloud Platform
  • google ml
  • machine-learning
  • ml
Vulnerability Agent logo

Vulnerability Agent

Quickly identify critical vulnerabilities using natural language prompts.

Technology
  • AI
  • agentic-operations-system
  • agentic-security
  • Foundation agent
  • MCP
  • Model Context Protocol
  • readymade-agent
AWS DevOps Agent logo

AWS DevOps Agent

Resolve issues autonomously with Dynatrace and the AWS DevOps Agent.

Technology
  • AI
  • a2a
  • agentic-ecosystem
  • agentic-sre-itops
  • aws
  • mcp
  • Model Context Protocol
  • readymade-agent
Claude Code CLI logo

Claude Code CLI

Boost developer productivity to get real-time, code-level insights into your CLI.

Technology
  • AI
  • a2a
  • agentic-coding
  • agentic-ecosystem
  • anthropic
  • mcp
  • Model Context Protocol
Claude Connector for Workflows logo

Claude Connector for Workflows

Connect with Claude and send prompts for further analysis using Workflows.

Technology by Community
  • Ai
  • generative AI
  • agentic-workflows
  • anthropic
  • automation
  • community
  • community-app
  • connector
  • LLM
  • se-coe
  • workflows
  • community