



































































Skip to technology filters Skip to main content
Dynatrace Hub

Extend the platform,
empower your team.

Popular searches:
Home hero bg
Tomcat (JMX)Tomcat (JMX)
Tomcat (JMX)

Tomcat (JMX)

JMX monitoring of Tomcat connection and thread pools, and web request activity.

Extension
Free trialDocumentation
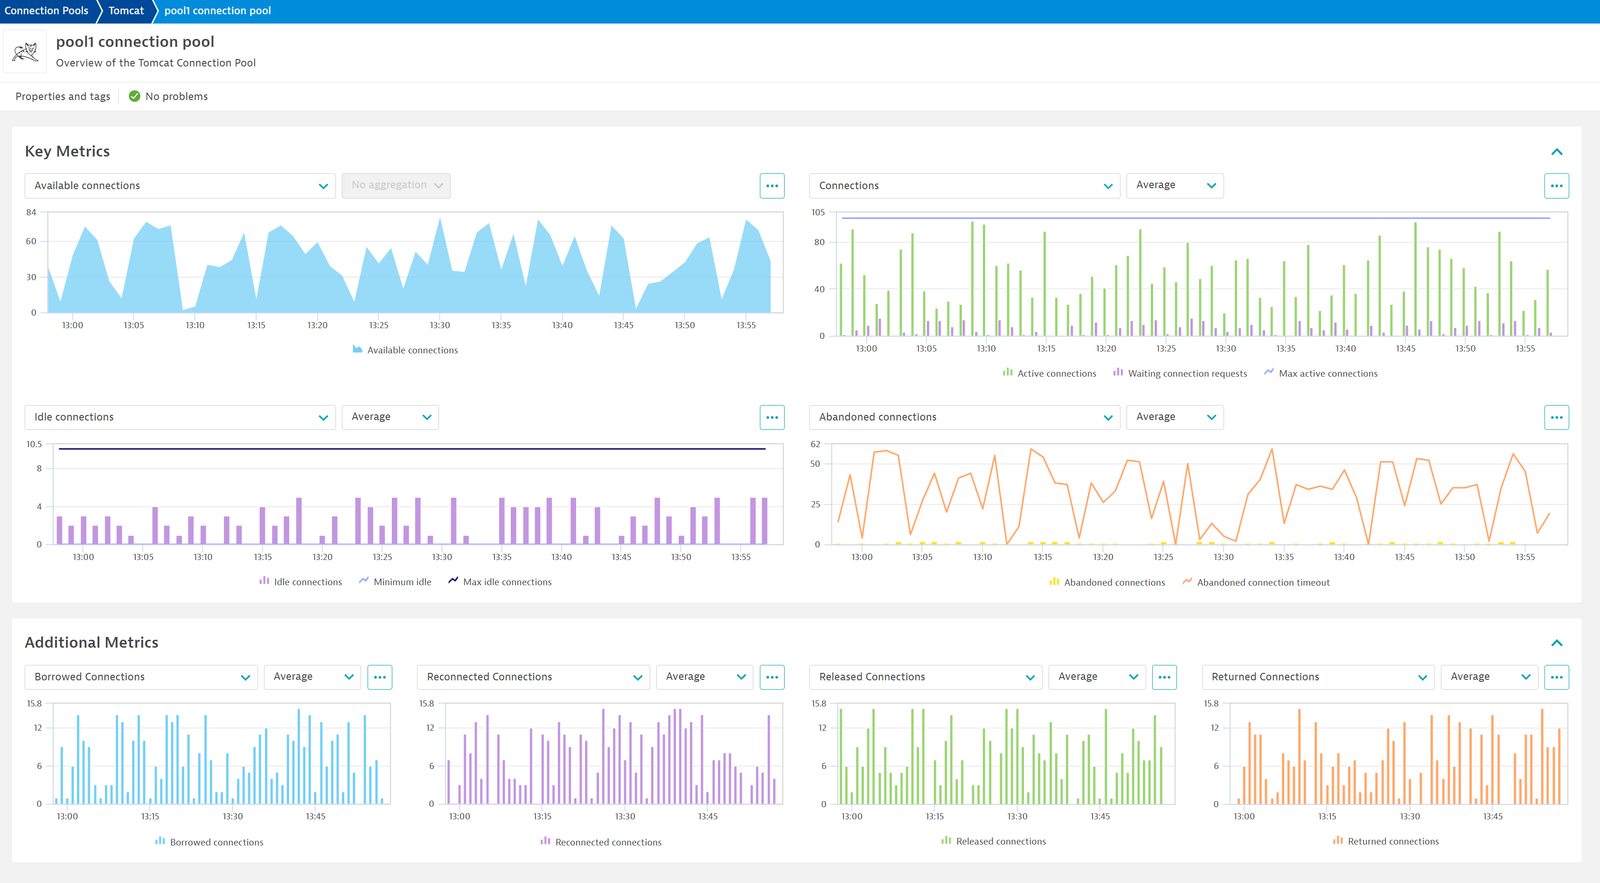
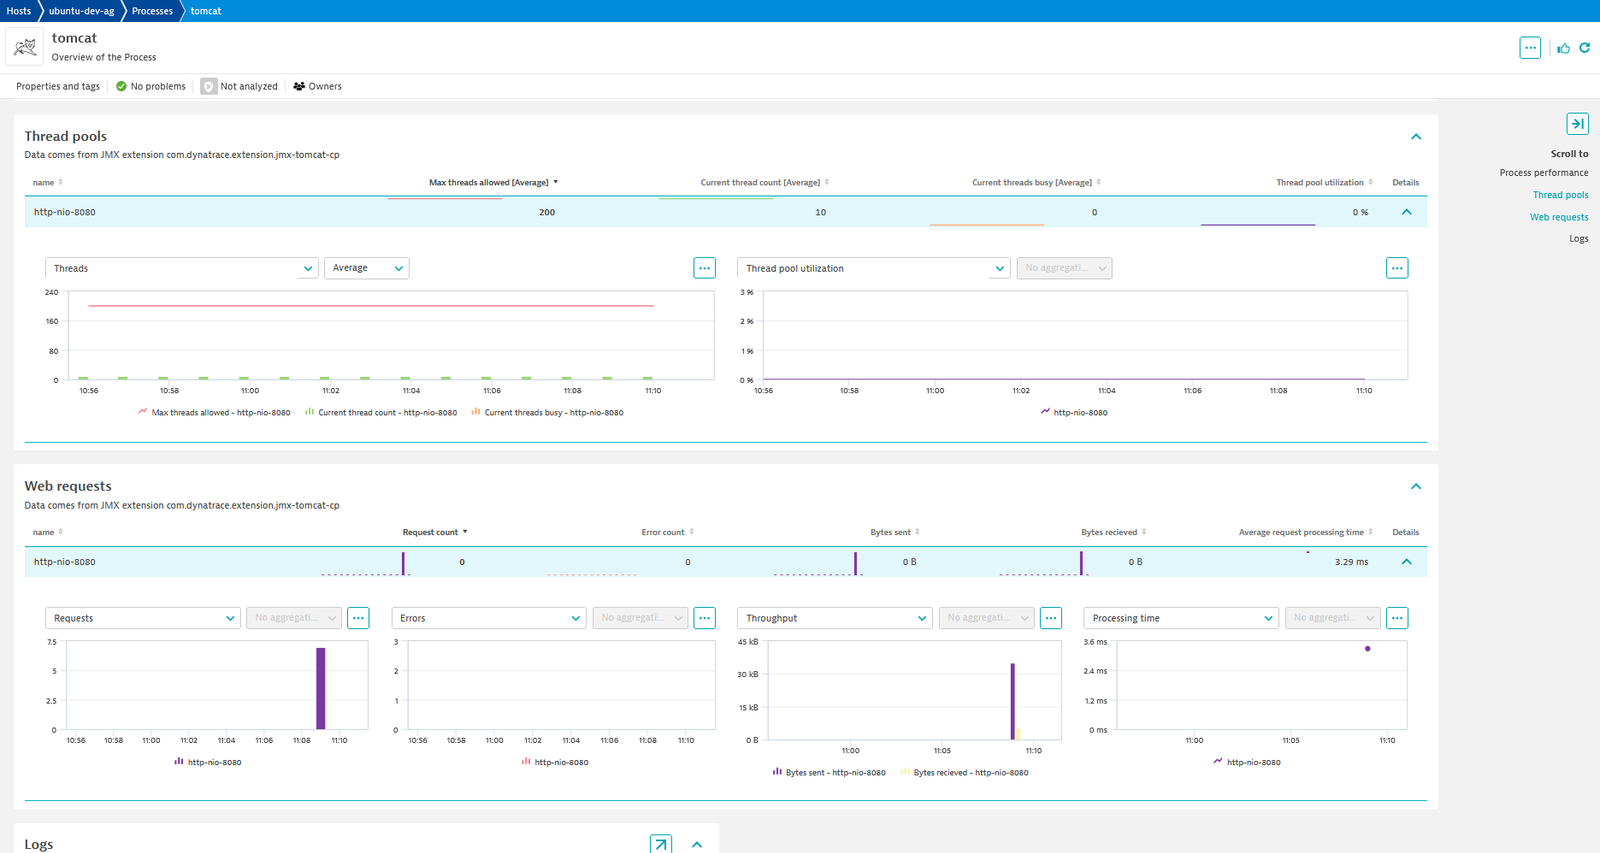
A connection pool entity screen.Data for thread pools and web request activity available in the process group instance Unified Analysis screen.
  • Product information
  • Release notes

Overview

Apache Tomcat is an open-source web server developed by the Apache Software Foundation (ASF) and one of the most popular servlet containers available today. It’s an incredibly lightweight, flexible and extremely stable platform to build on. The OneAgent will allow you to trace activity on and through your Tomcat applications. Using this JMX extension you'll be able to collect additional key performance data to identify issues and optimize your Tomcat configurations.

Use cases

  • Identify issues with connection pool utilization and activity that could impact your web applications
  • Optimize your thread and connection pool configurations to increase efficiency while not impacting your application clients
  • Monitor your web application by viewing web request activity and performance data from Tomcat's perspective in context with other key metrics

Get started

For more information on the installation and configuration, please see Tomcat (JMX) extension in the Dynatrace Documentation.

Details

Compatibility information

The following Mbeans are used for collecting data. If you not seeing metrics check that the following Mbeans exist using the tool of your choice (e.g. JConsole).

  • Connection pools:
    • Catalina:type=DataSource,name=*,class=*,context=*,host=* or Catalina:type=DataSource,name=*,class=*
  • Thread pools:
    • Catalina:type=ThreadPool,name=*
  • Web request activity
    • Catalina:type=GlobalRequestProcessor,name=*

For connection pools specifically, this extension only supports the standard Tomcat connection pooling implementation with Mbeans under the Catalina domain. It is not uncommon for a different pooling implementation to be used and in these cases you may need to create your own custom JMX extension to collect similar data (if it is available via JMX). You should consult your implementation's documentation or review available Mbeans in your Tomcat process to get started with this.

Dynatrace
DocumentationMore Information
By Dynatrace
Dynatrace support center
Subscribe to new releases
Copy to clipboard

Feature sets

Below is a complete list of the feature sets provided in this version. To ensure a good fit for your needs, individual feature sets can be activated and deactivated by your administrator during configuration.

Feature setsNumber of metrics included
Metric nameMetric keyDescriptionUnit
Bytes recievedtomcat.bytesReceived.countBytes recievedByte
Bytes senttomcat.bytesSent.countBytes sentByte
Request counttomcat.requestCount.countRequest countCount
Error counttomcat.errorCount.countError countCount
Request processing timetomcat.processingTime.countRequest processing timeMilliSecond
Metric nameMetric keyDescriptionUnit
Active connectionstomcat.connectionPool.activeConnectionsCurrently used connectionsCount
Created connectionstomcat.connectionPool.createdConnectionsNumber of connections createdCount
Idle connectionstomcat.connectionPool.idleConnectionsNumber of open but unused connectionsCount
Waiting connectionstomcat.connectionPool.numWaitersCurrently waiting connectionsCount
Abandoned connectionstomcat.connectionPool.removeAbandonedNumber of connections that have not been properly releasedCount
Abandoned connection timeouttomcat.connectionPool.removeAbandonedTimeoutTimeout before an abandoned connection can be removedSecond
Waiting connection requeststomcat.connectionPool.waitCountNumber of connection requests currently waitingCount
Metric nameMetric keyDescriptionUnit
Current thread counttomcat.threadPool.currentThreadCountCurrent thread countCount
Current threads busytomcat.threadPool.currentThreadsBusyCurrent threads busyCount
Max threads allowedtomcat.threadPool.maxThreadsMax threads allowedCount
Metric nameMetric keyDescriptionUnit
Stuck thread counttomcat.stuckThreadsStuck thread countCount
Metric nameMetric keyDescriptionUnit
Max total connectionstomcat.connectionPool.maxTotalMaximum total amount of connectionsCount
Max active connectionstomcat.connectionPool.maxActiveMaximum amount of active connections allowed concurrentlyCount
Max idle connectionstomcat.connectionPool.maxIdleThe maximum number of connections that should be kept in the pool at all timesCount
Max wait timetomcat.connectionPool.maxWaitThe maximum number of milliseconds that the pool will wait (when there are no available connections) for a connection to be returned before throwing an exceptionMillisecond
Minimum idletomcat.connectionPool.minIdleThe minimum number of established connections that should be kept in the pool at all timesCount
Metric nameMetric keyDescriptionUnit
Borrowed connectionstomcat.connectionPool.borrowedConnections-Count
Reconnected connectionstomcat.connectionPool.reconnectedConnections-Count
Released connectionstomcat.connectionPool.releasedConnections-Count
Returned connectionstomcat.connectionPool.returnedConnections-Count

Full version history

To have more information on how to install the downloaded package, please follow the instructions on this page.
ReleaseDate

Full version history

New in this version:

  • Added keyword key value pairs to extension

Full version history

  • Added gen 3 screens and dashboards

Full version history

Update that makes this a more general Tomcat extension

  • Includes feature sets and changes for App Server metrics
    • Thread pools
    • Web requests

Full version history

  • Added metrics:
    • tomcat.connectionPool.numWaiters
    • tomcat.connectionPool.maxTotal
    • func:tomcat.connectionPool.currentUsage
  • Added new charts in UA screens for these metrics

Full version history

  • Fix a bug which prevented the extension from being imported in some environments.

Full version history

  • Includes support for 'global' data source resources (i.e. Mbeans with no 'host' or 'context' attribute)

Full version history

Solved a bug where the name dimension was not being ingested correctly, which prevented custom topology entities from being created.

Full version history

EF1 to EF2 Tomcat Connection Pool conversion:

  • Add Tomcat connection pool entity and its relation to the tomcat process
  • Custom unified analysis screen for Tomcat connection pools
  • Metric chart injection into Process Group Instance screen
  • Overview dashboard for Tomcat connection pools
  • Add feature sets to control included metrics
  • New metric func:tomcat.connectionPool.availableConnections that shows the current available connections
  • All metrics have changed key from the EF1 version. The prefix builtin:tech.tomcat has been removed. This is a breaking change for any configuration you had which used the metric key, such as metric events.
Dynatrace Hub
Hub HomeGet data into DynatraceBuild your own app
Dynatrace Intelligence - Agentic Operations SystemThe Dynatrace Agentic AI ecosystem
All (914)Log Management and AnalyticsKubernetesAI and LLM ObservabilityInfrastructure ObservabilitySoftware DeliveryApplication SecurityBusiness ObservabilityDigital Experience
Filter
Type
Built and maintained by
Deployment model
SaaS
  • SaaS
  • Managed
Partner FinderBecome a partnerDynatrace Developer

Application Observability

Optimize your service performance, innovate faster, and collaborate efficiently with automatic and intelligent observability at scale and end-to-end distributed tracing for cloud-native workloads and enterprise apps.

Essentials

Get started with these popular tools for monitoring your applications and microservices.

OpenTelemetry logo

OpenTelemetry

Ingest and analyze OTel traces & metrics, set health alerts & view in context.

Serverless logo

Serverless

Seamless integration with serverless technologies to eliminate blind spots through OOTB integrations with AWS, Azure, and Google Cloud.

Kubernetes logo

Kubernetes

All-in-one Kubernetes observability for K8s infrastructure and apps teams.

Distributed Tracing logo

Distributed Tracing

Analyze and slice distributed traces by any attribute and from any source.

Runtimes

Java logo

Java

Optimize Java performance with E2E monitoring and AI-driven root cause analysis.

.NET logo

.NET

Automatic end-to-end observability for .NET applications and processes.

Go logo

Go

Automatic and intelligent end-to-end observability for Go applications.

Node.js logo

Node.js

Automatic and intelligent end-to-end observability for Node.js applications.

Python logo

Python

Trace your Python apps and services with real-time metrics and automatic RCA.

PHP logo

PHP

Automatic and intelligent end-to-end observability for PHP applications.

Observability frameworks

OpenTelemetry logo

OpenTelemetry

Ingest and analyze OTel traces & metrics, set health alerts & view in context.

Micrometer logo

Micrometer

Ingest Spring metrics and put them in context of trace, log and diagnostics data.

Prometheus logo

Prometheus

Unlock Prometheus power with intelligent analytics and automated insights.

Fluentd logo

Fluentd

Stream log data to Dynatrace via Fluentd for analysis.

Fluent Bit logo

Fluent Bit

Stream logs to Dynatrace via Fluent Bit for analysis and AI observability.

Logstash logo

Logstash

Stream log data from Logstash and analyze it in Dynatrace.

Serverless

AWS Lambda logo

AWS Lambda

Automatic and intelligent end-to-end observability of AWS Lambda traces and logs.

Azure Functions logo

Azure Functions

Observability for serverless and hybrid environments using Azure Functions.

Google Cloud Functions logo

Google Cloud Functions

E2E observability for serverless and hybrid environments using Google Functions.

Azure App Service logo

Azure App Service

Cloud platform for hosting websites, created and operated by Microsoft.

Azure Container Instance logo

Azure Container Instance

Deploy and manage serverless containers on the Microsoft Azure cloud, without having to manage any underlying infrastructure.

Google Cloud Run logo

Google Cloud Run

Dynatrace provides AI-powered observability into serverless containerized apps running on Google Cloud Run.

Databases

Redis logo

Redis

Automatically and intelligently observe, analyze & optimize your Redis server.

MySQL logo

MySQL

Automatically and intelligently observe, analyze and optimize how your the usage, health and performance of your database.

Apache Cassandra logo

Apache Cassandra

Improve Apache Cassandra observability.

Couchbase logo

Couchbase

Couchbase Capella (SaaS) database monitoring.

Message queues

Apache Kafka logo

Apache Kafka

Automatic and intelligent observability with trace and metric insights.

RabbitMQ logo

RabbitMQ

Automatic end-to-end traces of producers and consumers for RabbitMQ.

Apache ActiveMQ Classic logo

Apache ActiveMQ Classic

Automatic and smart observability for ActiveMQ with trace and metric insights.

Apache ActiveMQ Artemis logo

Apache ActiveMQ Artemis

ActiveMQ Artemis observability with end-to-end producers and consumers tracers.

Microsoft Message Queuing (MSMQ) logo

Microsoft Message Queuing (MSMQ)

Observability for MSMQ with end-to-end traces of connected producers/consumers.

Application stacks

Reactor Core logo

Reactor Core

End-to-end trace your applications when the Reactor Core publishers Mono and Flux are used.

Spring logo

Spring

End-to-end observability for Java Spring apps, automatic and intelligent.

Netty logo

Netty

End-to-end observability for your Netty web framework with code-level insight.

IBM WebSphere Application Server logo

IBM WebSphere Application Server

Automatically and intelligently monitor, analyze, and optimize your application server and all applications deployed anywhere in your stack.

More resources

Adobe Experience Manager Cloud Service logo

Adobe Experience Manager Cloud Service

End-to-end observability for your Adobe Experience Manager Cloud Service.

Adobe PhoneGap logo

Adobe PhoneGap

Monitor hybrid mobile apps built with Adobe PhoneGap running on iOS or Android.

Amazon Corretto logo

Amazon Corretto

Automatically and intelligently monitor, analyze, and optimize the performance of your virtual machine.

AngularJS logo

AngularJS

JavaScript-based open-source front-end web framework mainly maintained by Google.

Apache Axis2 logo

Apache Axis2

Core engine for Web services.

Apache Camel logo

Apache Camel

Intelligently monitor, analyze, and optimize your integration framework and all applications deployed in your stack.

Apache CXF logo

Apache CXF

Open-source, fully featured Web services framework.

Apache OpenEJB logo

Apache OpenEJB

Automatically and intelligently monitor, analyze and optimize your applications based on Apache OpenEJB.

Apache Tomcat logo

Apache Tomcat

Automatically and intelligently monitor, analyze, and optimize your application server and all applications deployed anywhere in your stack.

Apache TomEE logo

Apache TomEE

Automatically and intelligently monitor, analyze, and optimize your application server and all applications deployed anywhere in your stack.

Apache Zookeeper logo

Apache Zookeeper

Monitor and analyze your Apache Zookeeper with this JMX-based extension.

Apigee logo

Apigee

Remotely monitor your Apigee proxies.

Azul Platform Core (Zulu) logo

Azul Platform Core (Zulu)

Automatically and intelligently monitor, analyze, and optimize the performance of your virtual machine.

Azul Platform Prime (Zing) logo

Azul Platform Prime (Zing)

Automatically and intelligently monitor, analyze, and optimize the performance of your virtual machine.

Backbone.js logo

Backbone.js

JavaScript library based on the Model–view–presenter application design paradigm.

BellSoft Liberica logo

BellSoft Liberica

Automatically and intelligently monitor, analyze, and optimize the performance of your virtual machine.

BOSH bpm logo

BOSH bpm

Automated monitoring of platform processes running in BOSH bpm containers.

C logo

C

Procedural programming language supporting lexical variable scope, and recursion.

CakePHP logo

CakePHP

Automatically and intelligently monitor, analyze, and optimize your applications developed with CakePHP.

CentOS logo

CentOS

Community-supported computing platform compatible with Red Hat Enterprise Linux.

IBM CICS Transaction Gateway for z/OS logo

IBM CICS Transaction Gateway for z/OS

Intelligently monitor your transactions end-to-end and analyze the performance of your CICS Transaction Gateway on z/OS.

Cloud Foundry logo

Cloud Foundry

Harness automation and AI to simplify observability on Cloud Foundry at scale.

Connection Pools: JBoss logo

Connection Pools: JBoss

Application server method of pooling and sharing connections to a database.

Connection Pools: Apache Commons logo

Connection Pools: Apache Commons

Application method of pooling and sharing multiple connections to a database.

Connection Pools: C3P0 logo

Connection Pools: C3P0

Application server method of pooling and sharing connections to a database.

Tomcat (JMX) logo

Tomcat (JMX)

JMX monitoring of Tomcat connection and thread pools, and web request activity.

Connection Pools: WebLogic logo

Connection Pools: WebLogic

Application server method of pooling and sharing connections to a database.

Connection Pools: WebSphere Liberty logo

Connection Pools: WebSphere Liberty

Application server method of pooling and sharing connections to a database.

Consul Service Mesh (StatsD) logo

Consul Service Mesh (StatsD)

Extend visibility into your Consul Service Mesh instances to monitor health and improve performance.

containerd logo

containerd

Distributed tracing and metrics for services in containerd in Kubernetes.

Red Hat Enterprise Linux CoreOS logo

Red Hat Enterprise Linux CoreOS

Open-source lightweight OS based on the Linux, providing infrastructure to clustered deployments.

cri-o logo

cri-o

Distributed tracing and metrics for services in cri-o containers in Kubernetes.

Observability for Developers on Cursor logo

Observability for Developers on Cursor

Get Real time Code-Level data directly to your Cursor IDE.

Debian logo

Debian

Association of individuals who have made common cause to create a free operating system.

Disk Analytics logo

Disk Analytics

This extension allows more detailed visibility on Linux hosts' local datastores where OneAgent is installed.

Drupal logo

Drupal

Web content management for back-end framework.

Dynatrace Bindplane logo

Dynatrace Bindplane

Optimize and manage your telemetry at the edge before it reaches Dynatrace.

Eclipse Jetty logo

Eclipse Jetty

Automatically and intelligently monitor and analyze your Jetty applications.

Eclipse OpenJ9 logo

Eclipse OpenJ9

Automatically and intelligently monitor, analyze, and optimize the performance of your virtual machine.

Eclipse Temurin (Adoptium) logo

Eclipse Temurin (Adoptium)

Automatically and intelligently monitor, analyze, and optimize the performance of your virtual machine.

Ember.js logo

Ember.js

Open-source JavaScript web framework, based on the Model–view–viewmodel pattern.

etcd for OpenShift logo

etcd for OpenShift

Get deep insights into your OpenShift control plane using etcd metrics.

Express logo

Express

Fast, unopinionated, minimalist web framework for Node.js.

Fedora logo

Fedora

Linux distribution sponsored primarily by Red Hat, a subsidiary of IBM.

Garden-RunC logo

Garden-RunC

Automated distributed tracing and metrics for microservices running in garden runc containers in Cloud Foundry.

GlassFish logo

GlassFish

Automatically and intelligently monitor, analyze, and optimize your application server and all applications deployed anywhere in your stack.

GraalVM Native Image logo

GraalVM Native Image

Intelligently monitor and optimize the performance of your native Java apps.

gRPC logo

gRPC

Open source remote procedure call (RPC) system.

Are you looking for something different?

We have hundreds of apps, extensions, and other technologies to customize your environment

Extend your knowledge

Discover distributed tracing

Discover distributed tracing

Observe requests across distributed systems and microservices and generate high-quality data for analysis.
Read more

Discover OpenTelemetry

Discover OpenTelemetry

Ingest and chart custom OpenTelemetry traces and metrics, set alerts, and analyze them with traces, logs, and diagnostics data.
Read more
Profile and optimize

Profile and optimize

Go beyond automated problem detection to manually detect problems with the analysis toolset for profiling and optimization.
Read more