



Skip to technology filters Skip to main content
Dynatrace Hub

Extend the platform,
empower your team.

Popular searches:
Home hero bg
DatabasesDatabases
Databases

Databases

Monitor databases, prevent issues, and resolve incidents quickly in real time.

App
Try in PlaygroundDocumentation
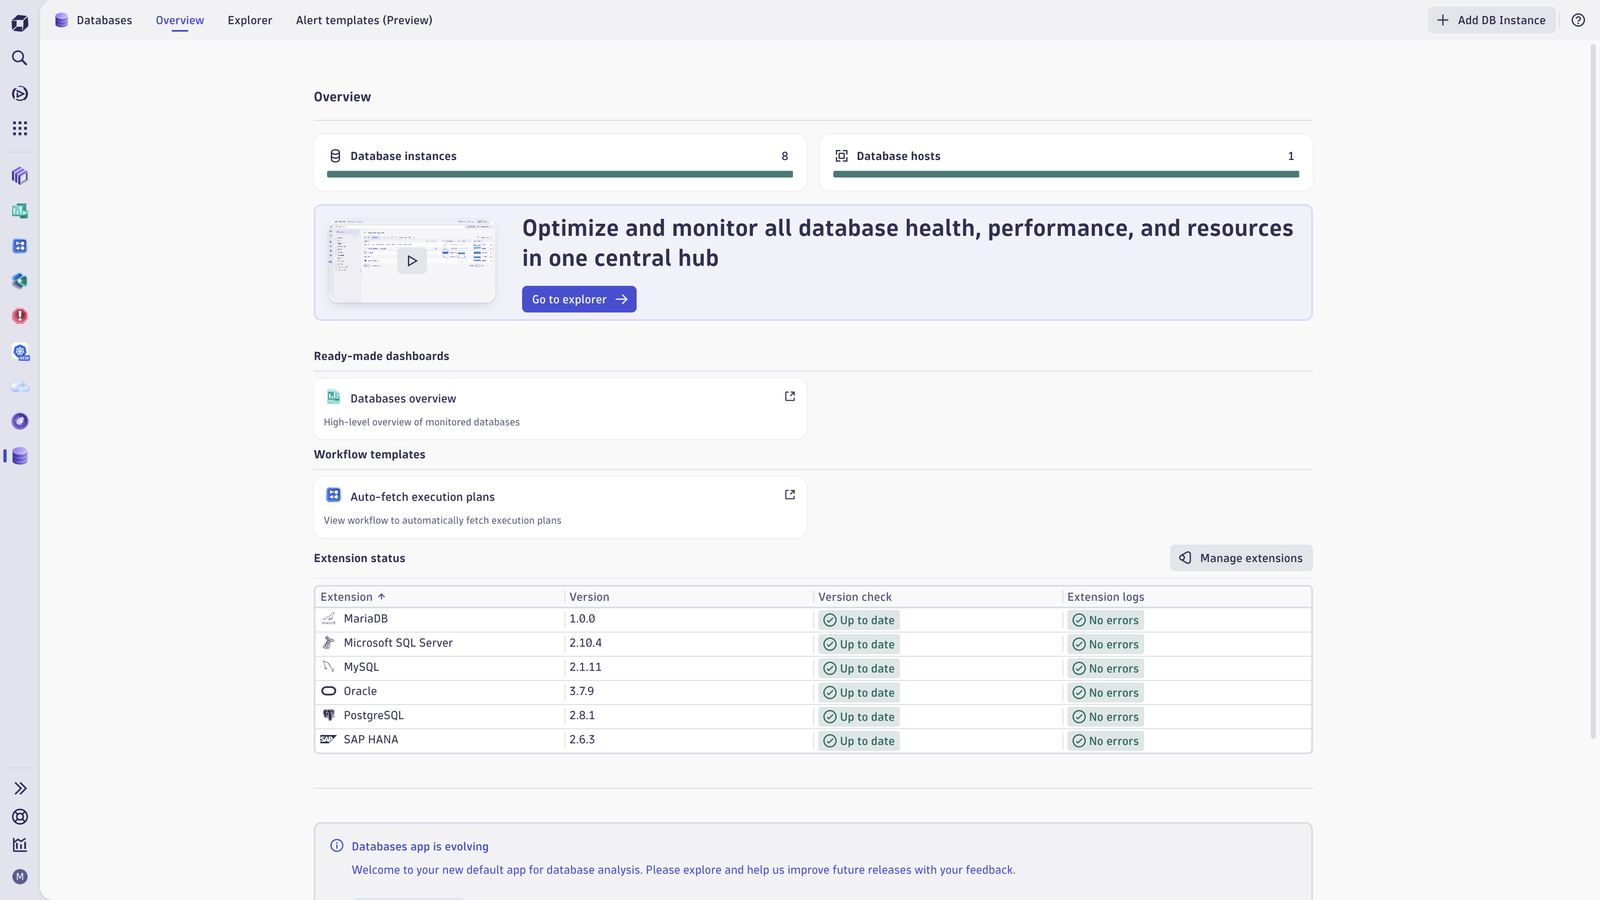
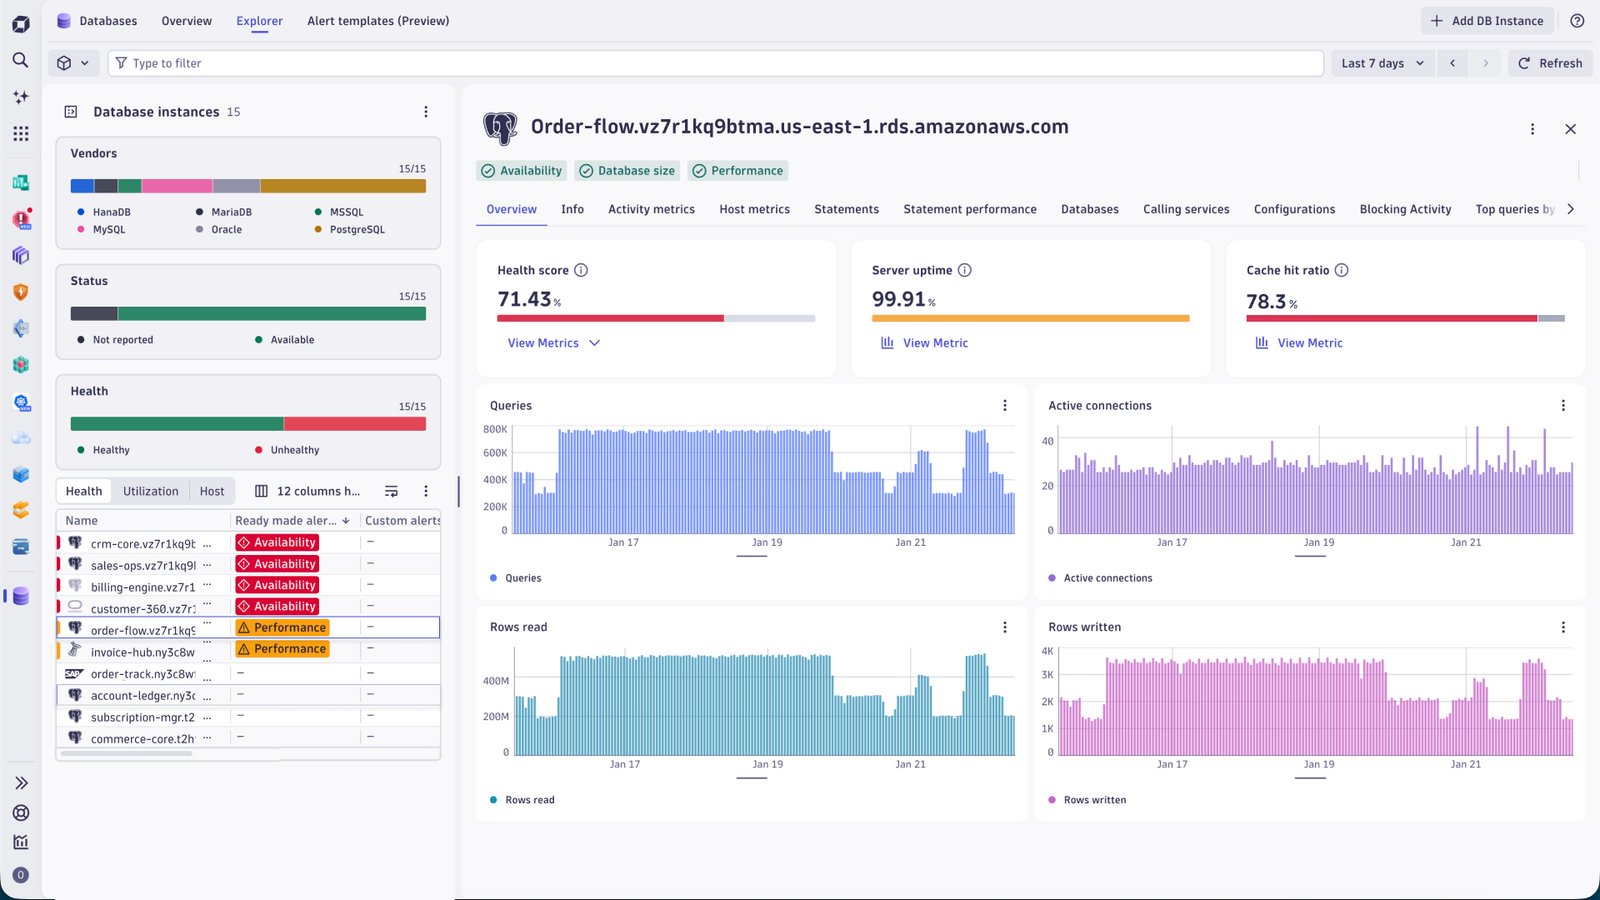
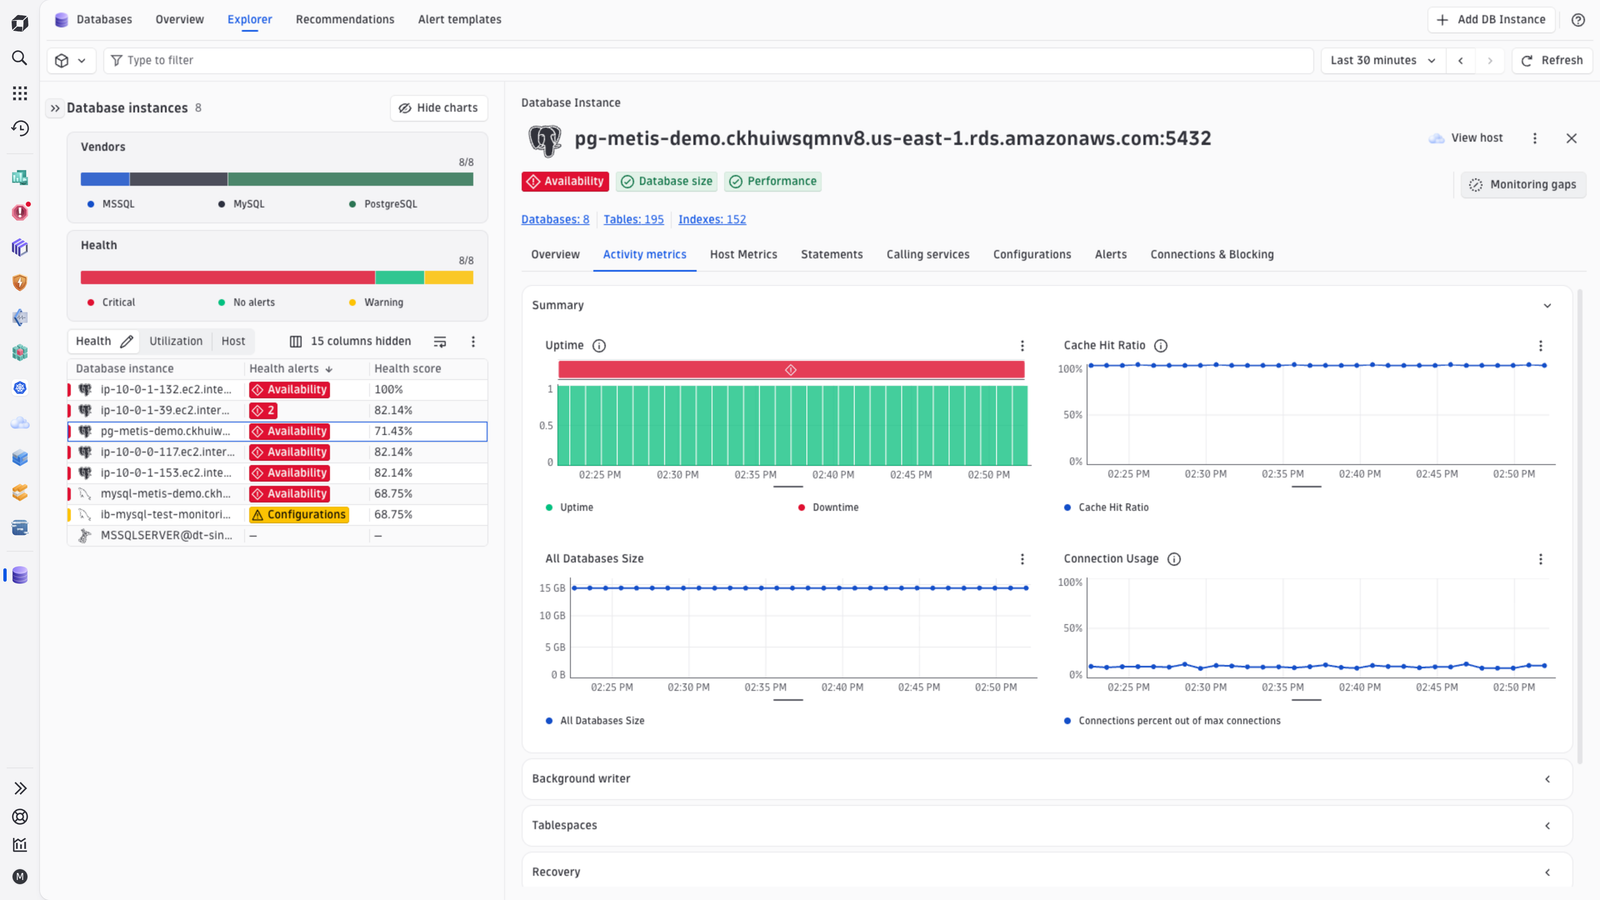
Get an overview of what's happening across your entire database fleetMonitor the health, performance, and activity of your database instances in one view.See a full view of activity metrics
  • Product information
  • Release notes

Overview

The Databases app provides AI-driven unified visibility across your entire database estate, from on-premises to hybrid and multi-cloud environments. By eliminating silos, it provides real-time, actionable insights to proactively prevent issues, optimize performance, and ensure seamless user experiences. With the app, monitor entire database clusters, gain deep, AI-powered insights with remediation plans and alerts, and access granular visibility to reduce outages and downtime.

Use cases

Gain comprehensive visibility across your entire database fleet, including cross-cloud and cross-region environments.

Access the most granular data to track and optimize the health and performance of all your databases.

Ensure your database is always optimized for resource and cost utilization without exceeding your budget.

Proactively monitor your databases to identify and resolve issues before they impact your customers.

Get started

  1. Install an ActiveGate in your environment.

  2. Configure the relevant Database extension within the ActiveGate.

  3. Use the Database app to get all the insights.

Dynatrace
Documentation
By Dynatrace
Dynatrace support center
Subscribe to new releases
Copy to clipboard

Related to Databases

IBM DB2 for LUW (remote monitoring) logo

IBM DB2 for LUW (remote monitoring)

Remotely collect monitoring metrics from your DB2 databases.

Microsoft SQL Server logo

Microsoft SQL Server

Improve the health and performance monitoring of your Microsoft SQL Servers.

Microsoft SQL Server (local) logo

Microsoft SQL Server (local)

Improve the health and performance monitoring of your Microsoft SQL Servers.

Oracle Database logo

Oracle Database

Observe, analyze and optimize the usage, health and performance of your database.

PostgreSQL logo

PostgreSQL

Monitor your Postgres performance via our new EF2.0 extension framework.

SAP HANA Database (remote monitoring) logo

SAP HANA Database (remote monitoring)

Easily understand the health and performance of your SAP HANA databases.

More resources

Dynatrace launches Databases app to provide DBA insights across all databases

Dynatrace launches Databases app to provide DBA insights across all databases

Explore Dynatrace's new Observability app, Databases. It supports DBAs in tracking database performance, assessing availability, and enabling efficient troubleshooting with its architecture insight feature.
Blog Post


Full version history

ReleaseDate

Full version history

1.55.8

Patch Changes

  • Update dependencies

Full version history

1.55.7

Patch Changes

  • Fixes filter reset when switching between tabs in the details view

Full version history

1.55.6

Patch Changes

  • Improves host configurations lookup

Full version history

1.55.5

Patch Changes

  • Fixes creating a monitoring configuration with vault authentication in the onboarding wizard

Full version history

1.55.4

Patch Changes

  • Adds conditional checkbox rendering for schema-based forms

1.55.3

Minor Changes

  • Adds Host Metrics tab for Postgres and MySQL and replaces Statement performance tab with Statements for Postgres, improving the UI/UX of it.


Patch Changes

  • Fixes MySQL connection utilization

1.55.2

Patch Changes

  • Improves Call time chart
  • Fixes statements column time units

1.55.1

Minor Changes

  • Updates DB Size chart in Activity Metrics
  • Improves health alert indicators in the charts
  • Removes hosts display in the overview page
  • Removes video from Overview page
  • Moves user creation step right before authentication step in the onboarding process
  • Removes SLRU Statistics, I/O statistics, User function statistics, Subscription statistics tabs from Postgres detail page
  • Improves MySQL onboarding scripts to create dynatrace_execution_plan procedure across schemas for mysql_local and mysql_rds

Patch Changes

  • Fixes View Host button overlapping with the Menu
  • Fixes CPU (host) minichart in the instances table
  • Fixes DT queries toggle in Statements tab

Full version history

1.55.3

Minor Changes

  • Adds Host Metrics tab for Postgres and MySQL and replaces Statement performance tab with Statements for Postgres, improving the UI/UX of it.

Patch Changes

  • Fixes MySQL connection utilization

1.55.2

Patch Changes

  • Improves Call time chart
  • Fixes statements column time units

1.55.1

Minor Changes

  • Updates DB Size chart in Activity Metrics
  • Improves health alert indicators in the charts
  • Removes hosts display in the overview page
  • Removes video from Overview page
  • Moves user creation step right before authentication step in the onboarding process
  • Removes SLRU Statistics, I/O statistics, User function statistics, Subscription statistics tabs from Postgres detail page
  • Improves MySQL onboarding scripts to create dynatrace_execution_plan procedure across schemas for mysql_local and mysql_rds

Patch Changes

  • Fixes View Host button overlapping with the Menu
  • Fixes CPU (host) minichart in the instances table
  • Fixes DT queries toggle in Statements tab

Full version history

1.54.5

Patch Changes

  • Fixes fetching monitoring configurations for extensions that are not installed
  • Fixes steps are not visible or in a wrong order when opening DB Onboarding modal

1.54.4

Patch Changes

  • Removes unused variable on ready-made Dashboard

1.54.3

Patch Changes

  • Fixes Select Database Vendor step is not visible in Onboarding modal

1.54.2

Patch Changes

  • Fixes Active Gate fetching error in the Database Onboarding modal

1.54.1

Patch Changes

  • Removes Database services performance analysis section from Database Overview ready made dashboard

1.54.0

Minor Changes

  • Adds redirect to Clouds and Infrastructure & Operations app from detail page and host context menu

Full version history

1.53.4

Patch Changes

  • Resolves an issue with displaying graphs with logs

1.53.3

Minor Changes

  • Updates microguide screenshots

Full version history

1.53.2

Patch Changes

  • Improves execution plan fetching

Full version history

1.53.1

Feature changes

PostgreSQL

  • Introduced a new Overview tab featuring a Health Score, Server Uptime, and key instance metrics.

Consolidated instance metrics into an enhanced Activity Metrics tab, now including new visualizations such as Total Databases and Top Databases.

  • Added a dedicated Databases tab that provides per‑database breakdowns and detailed metrics.
  • Added a Calling Services tab to help users identify services interacting with their instance.
  • Added a Configurations tab displaying Current Settings and Change History for improved transparency and auditing.

MySQL

  • Introduced a new Overview tab featuring a Health Score, Server Uptime, and essential instance metrics.
  • Consolidated instance metrics into an improved Activity Metrics tab for easier monitoring.
  • Added a Calling Services tab to surface related services interacting with the instance.
  • Added a Configurations tab with Current Settings and Change History.

All Database Vendors

  • Added a new Alert Templates page, enabling quick setup of Health Alerts (Availability) and Warning Signals (Performance Drops, Database Size) within the Anomaly Detection app.
  • Replaced the Problems tab with a new Alerts tab, offering a clearer view of all alerts associated with each instance.

1.53.0

Minor Changes

  • Improves display of Instances with Health Alerts and Warning signals
  • Adds possibility to filter for Warning alerts
  • Adds Health Indicators in the entity detail page
  • Adds now/summary timeframe selector toggles in the filter bar
  • Adds Top databases charts for Postgres to Activity metrics tab
  • Improves Activity metrics tab for Postgres and MySQL
  • Adds Semantic Dictionary for search

Patch Changes

  • Uses less restrictive permission for execution plans permission check

Full version history

1.52.1

Patch Changes

  • Fixes an issue where users without permission to read extension configuration or logs would not be able to open detail page

Full version history

1.52.0

Feature Changes

  • Extension status: Adds Version check column, identifying incompatible extension versions or incompatible configuration versions.
  • Extension status: Adds Extension logs column, checking if there are any Error logs within the extension in the last 30 minutes.
  • Database instances: Redesign information alert when the active version of the extension is incompatible.
  • Instance detail page: Adds information alert about configuration being incompatible or configuration having Error logs.

Patch Changes

  • Fixes an issue with auto-fetch execution plan.
  • Keeps existing filters while applying filters from charts.
  • Adds IP values to database column.

Full version history

1.51.1

Patch Changes

  • Fixes a security issue with dependency

Full version history

1.51.0

Minor Changes

  • Enhanced out-of-the-box-dashboards
  • Added permission checks to overview and displayed a message when required permissions are missing
  • Prohibited unprivilaged user to access database explorer page
  • Replaced Installed DB Extensions List with Extension Status table on the Overview page
  • Added execution plan permission check
  • Added Alerts tab to details view

Patch Changes

  • Fixed CpuUsage calculation for Oracle

Full version history

1.50.1

Patch Changes

  • Resolved an issue where an incompatible dependency prevented the app from installing correctly.

Full version history

1.50.0

Feature changes

  • Adds download CSV action for tables
  • Adds loading behavior for Statements performance tab.
  • Shows Meter Bar Charts instead of Donut Charts for Database Instances Summary charts when main view is not wide enough to show Donut charts
  • Improves extension compatibility checks

Improvements

  • Fixes db problem intents to only listen to custom device entities.

Full version history

1.49.1

Patch Changes

  • Improves extension compatibility checks

1.49.0

Feature updates

  • Adds support for MariaDB extension.
  • Adds filter context menu for Tags and IP Address columns
  • Adds filter option for Vendor, Status and Health charts
  • Adds view database instances intent with Host name and IP address filters support
  • Improves data displayed for Health donut chart to include resolved problems when selecting a past timeframe

Full version history

1.48.1

Patch Changes

  • Fixes an issue where SAP Hana entities are not properly listed due to missing property ip_address.

1.48.0

Minor Changes

  • Adds "get started" section to app help menu.
  • Add IP Address filter support for wildcard, starts with and ends with operators
  • Fixed table line wrap issue where row height remained unchanged after disabling.
  • Fix crash when opening databases app via intent when entityType is unknown.
  • Add IP address filter to the filter field and IP address column to the content table.

Patch Changes

  • Fixes issue where entity details data was loaded twice.

Full version history

1.48.0

Minor Changes

  • Adds micro-guide explaining Problems flow and "get started" section to app help menu.
  • Adds IP address filter to the search field and IP address column to the content table.

Patch Changes

  • Fixes issue where entity details data was loaded twice.
  • Fixes table line wrap issue where row height remained unchanged after disabling.

Full version history

1.47.3

Patch Changes

  • Fixes Database Instances table column sorting.
  • Fixes hosts columns initial width.

Full version history

1.47.2

Patch Changes

  • Fixes the redirection to correct additional tab and metric for Postgres.

Full version history

1.47.1

Patch Changes

  • Fixes the redirection to correct tab and metric for Postgres.
  • Improves error message if extension version is not supported.

Full version history

1.47.0

Minor Changes

  • Adds option to use Segments.
  • Adds Investigation Mode and enables seamless navigation between Problems and Databases Apps for improved Problems analysis.
  • Unifies statements-table actions.
  • Shows status of installed databases extensions on Overview page.
  • Adds insights column for host configurations databases table.
  • Presents CPU usage for Oracle instances in the databases table.
  • Adds modal for host configurations insights.
  • Shows host configurations tab on host details drawer.
  • Shows databases status for Postgres based on uptime timeseries.

Patch Changes

  • Adds tags as filter on explorer page.
  • Fixes Execution Plan request button, when Statement Performance table is sorted or row is expanded.
  • Adds "Filter" cell-actions to "Name", "Hosts", "Health alerts", "Custom health alerts", "Status" columns shown in databases table.
  • Changes the timeframe of status column to show only recent status.
  • Fixes the bug related to failure if extension does not provide vendor.
  • Fixes an issue in logs card on top queries tab.
  • Fixes an issue where related hosts where not shown in instance databases table for Postgres entities.
  • Adds recommended extensions for all Databases vendors.
  • Improves user experience in the databases table.

Full version history

1.46.6

Patch Changes

  • Corrected a data rendering issue impacting DB2 instance.

Full version history

1.46.5

Patch Changes

  • Fixes an issue with host related timeseries lookups
  • Fixed Execution Plan request button, when Statement Performance table is sorted or row is expanded.

Full version history

1.46.4

Patch Changes

  • Fixes an issue in logs card on top queries tab.

Full version history

1.46.3

Patch Changes

  • Fixes statement performance tab on Safari browser.
  • Fixes application crashes that occur when PostgreSQL and Snowflake extensions are enabled but no database instances are monitored.

1.46.2

Patch Changes

  • Adds user-friendly error messages related to missing host relation fields for database instances.
  • Improves explorer view when no records are shown.
  • Fixes highlighting in header tabs.
  • Fixes lazy loading of metrics in "Utilization" perspective of databases table.

1.46.1

  • Brings more app stability improvements.

1.46.0

Minor Changes

  • Adds an option to create a workflow to auto-fetch execution plans through the 3-dot menu option in the "Statement Performance" tab in the entity details panel.
  • Adds summary charts above the entities table on the Explorer page.
  • Adds a host perspective for the entities table.

Patch Changes

  • Adds a click action for the problems chip in the entities table that will open the "Problems" tab in the entity details panel.
  • Adds trimming for statements longer than 255 characters in the "Statement Performance" tab in the entity details panel and a button to show the full content of the trimmed statement.
  • Adds "Open with..." and "Pin to Dashboard..." actions to the 3-dot menu in the "Statement Performance" tab in the entity details panel.
  • Fixes the OA status of instances where OA was uninstalled.
  • Fixes the error with PostgreSQL and Snowflake statuses that resulted in an app crash.

Full version history

1.46.1

  • Brings more app stability improvements.

1.46.0

Minor Changes

  • Adds an option to create a workflow to auto-fetch execution plans through the 3-dot menu option in the "Statement Performance" tab in the entity details panel.
  • Adds summary charts above the entities table on the Explorer page.
  • Adds a host perspective for the entities table.

Patch Changes

  • Adds a click action for the problems chip in the entities table that will open the "Problems" tab in the entity details panel.
  • Adds trimming for statements longer than 255 characters in the "Statement Performance" tab in the entity details panel and a button to show the full content of the trimmed statement.
  • Adds "Open with..." and "Pin to Dashboard..." actions to the 3-dot menu in the "Statement Performance" tab in the entity details panel.
  • Fixes the OA status of instances where OA was uninstalled.
  • Fixes the error with PostgreSQL and Snowflake statuses that resulted in an app crash.

Full version history

1.45.2

  • App loads properly now when only Snowflake or PostgresSQL are configured.

1.45.1

  • Updates the UI to unify user experience with other Dynatrace apps.<br> The new overview and explorer pages provide more structured data that is easily accessible.
  • Unifies statuses between different database services. <br> Click on the status chip to see the current status reported by the service.
  • Adds "Summarize with Davis CoPilot" button to explain the execution plan in statements explorer.
  • Adds the OneAgent status bar to the details view.
  • Improves UX of execution plan request in statements explorer.

Full version history

1.45.1

  • Updates the UI to unify user experience with other Dynatrace apps.<br> The new overview and explorer pages provide more structured data that is easily accessible.
  • Unifies statuses between different database services. <br> Click on the status chip to see the current status reported by the service.
  • Adds the OneAgent status bar to the details view.
  • Improves UX of execution plan request in statements explorer.

Full version history

1.44.0

  • Add built-in dashboard which you can check in the Dashboards app.
  • Fix table flickering on every interaction on the page.
  • Update chart colors on entity details panel to be more balanced.
  • Add better text formatting for execution plans that are in XML format.
  • Hide queries that have '/*dt:ownQuery*/' comment in the beggining and give option to show them back through the options menu on the 'Statement performance' panel.
  • Update help menu in the app header section to unify the UX between different apps.

Full version history

1.43.0

  • Fix Oracle RAC
  • Minor improvements

Full version history

1.42.0

  • Fix detection of Statement Performance availability
  • Fix navigation from Overview page to statement details on Statement Performance page

Full version history

1.41.0

  • Enable new look of TopN's by default

Full version history

1.39.0

  • On demand execution plans for most time-consuming statements

Full version history

1.38.0

  • Minor improvements

Full version history

1.33.0

  • Changing the Snowflake icon
  • Minor improvements

Full version history

1.30.0

Patch Changes

  • Changing release notes mechanism
  • Changing the mechanism of loading metrics/statuses on Database instances page
  • Updating help menu options

Full version history

  • database.identifier added
  • adjusting changes to EXT-8984
  • execution plan request modification

Full version history

  • Disable E2E tests (temporary)
  • updated README.md file
  • Remove storybook
  • prepare env and first test manual test
  • change feedback link

Full version history

  • hotfix feedback link
  • fix language configuration for DB app

Full version history

  • fix time formatting
  • Add help button to Databases app
  • Make DQL queries non-billable
  • filter on instances page doesn t reset after refresh
  • need to have default sort by problems count

Full version history

  • fix most consuming statements and topN requests sequence
  • DatabasesNew icon change into purple one
  • Update unified-analysis to 0.10.0
  • Add metrics preprocessing, restore memory consumption for MSSQL.
  • remove memory consumption for MSSQL vendor
  • dependency update
  • modify the look of left menu bar
  • menu bar modifications part1
  • new label for your databases app name
  • adjust application to extension metric changes
    • bump minor version on regular development - bump patch version on hotfix change (backport)

Full version history

  • fix statement filter changing
  • Remove the details icon button from the actions column
  • change default column sorting behavior
  • db app add link from most time consuming statements to the statement details on
  • App icon changed to the one with "new"
  • fix test
  • load problems for loaded entities only
  • dependency update
  • extend problems query timeframe
  • Fix errors printed on console

Full version history

  • db app add link from most time consuming statements to the statement details on
  • App icon changed to the one with "new"
  • fix test
  • load problems for loaded entities only
  • dependency update
  • extend problems query timeframe
  • Fix errors printed on console
Dynatrace Hub
Hub HomeGet data into DynatraceBuild your own app
Dynatrace Intelligence - Agentic Operations SystemThe Dynatrace Agentic AI ecosystem
All (914)Log Management and AnalyticsKubernetesAI and LLM ObservabilitySoftware DeliveryApplication ObservabilityApplication SecurityBusiness ObservabilityDigital Experience
Filter
Type
Built and maintained by
Deployment model
SaaS
  • SaaS
  • Managed
Partner FinderBecome a partnerDynatrace Developer

Infrastructure Observability

Get automatic and intelligent observability across cloud and hybrid environments with continuous auto-discovery of any type of infrastructure, all in context and with precise, AI-powered answers.

Essentials

Get automatic and intelligent infrastructure monitoring and observability across hybrid and cloud environments.

OneAgent logo

OneAgent

The simplest way to capture all observation signals automatically and in context.

Discovery & Coverage logo

Discovery & Coverage

Ensure enterprise-wide visibility. Discover and remediate coverage gaps.

Infrastructure & Operations logo

Infrastructure & Operations

Detailed hosts, process, and network insights across the entire environment.

Databases logo

Databases

Monitor databases, prevent issues, and resolve incidents quickly in real time.

Clouds logo

Clouds

Gain full visibility and proactive monitoring across your cloud infrastructure.

Hybrid cloud

AWS logo

AWS

Reliable, scalable, and inexpensive cloud computing services.

Microsoft Azure logo

Microsoft Azure

Cloud computing service for building, testing, deploying, and managing services.

Google Cloud logo

Google Cloud

Meet your business challenges head on with cloud computing services from Google.

VMware logo

VMware

Monitor health and performance of VMware virtual machines.

Nutanix Clusters logo

Nutanix Clusters

Monitor Nutanix clusters' performance, usage and availability, with Nutanix API.

Microsoft Hyper-V Infrastructure logo

Microsoft Hyper-V Infrastructure

Monitor health and performance of the Hyper-V clusters, hosts and VMs.

Technology coverage

F5 BIG-IP logo

F5 BIG-IP

Gain insights into the performance of your F5 BIG-IP LTM and DNS solutions.

Oracle Database logo

Oracle Database

Observe, analyze and optimize the usage, health and performance of your database.

Microsoft SQL Server logo

Microsoft SQL Server

Improve the health and performance monitoring of your Microsoft SQL Servers.

Also popular

See more (5)
Juniper Networks (SNMP) logo

Juniper Networks (SNMP)

Gain insights into the performance of your Juniper networking solutions.

SNMP Traps logo

SNMP Traps

Supplement network monitoring with event-based data reported via SNMP Traps.

Generic Cisco Device logo

Generic Cisco Device

Monitor Cisco devices using SNMP to feed Dynatrace with metrics and alerts.

Palo Alto firewalls logo

Palo Alto firewalls

Palo Alto extension for problems detection.

Remote Windows Host Monitoring logo

Remote Windows Host Monitoring

Monitor health and performance of Windows Hosts without installing an agent.

AWS Lambda logo

AWS Lambda

Automatic and intelligent end-to-end observability of AWS Lambda traces and logs.

More resources

Amazon API Gateway logo

Amazon API Gateway

Service for developers to create, publish, maintain, monitor, and secure APIs.

Amazon AppStream 2.0 logo

Amazon AppStream 2.0

Fully managed application streaming service that provides users with instant access to their desktop applications from anywhere.

Amazon Athena logo

Amazon Athena

Interactive query service that makes it easy to analyze data directly in Amazon S3 using standard SQL.

Amazon Aurora logo

Amazon Aurora

Relational database service developed and offered by Amazon Web Services.

Amazon CloudFront logo

Amazon CloudFront

Content delivery network offered by Amazon Web Services.

Amazon CloudSearch logo

Amazon CloudSearch

Set up, manage, and scale a search solution for your website or application using CloudSearch.

Amazon CloudWatch Logs logo

Amazon CloudWatch Logs

Monitor, store, and access your log files from instances, AWS CloudTrail, Route 53, and other sources.

Amazon Cognito logo

Amazon Cognito

Add user sign-up, sign-in, and access control to your web and mobile apps quickly and easily.

Amazon Connect logo

Amazon Connect

Easy to use omnichannel cloud contact center that helps you to provide superior customer service at a lower cost.

Amazon DocumentDB logo

Amazon DocumentDB

Amazon DocumentDB (with MongoDB compatibility) is a fast, reliable, and fully managed database service.

Amazon DynamoDB Accelerator (DAX) logo

Amazon DynamoDB Accelerator (DAX)

Fully managed, highly available, in-memory cache for your Amazon DynamoDB.

Amazon EC2 Auto Scaling logo

Amazon EC2 Auto Scaling

Amazon EC2 Auto Scaling helps you ensure that you have the correct number of Amazon EC2 instances available.

Amazon EC2 Spot Fleet logo

Amazon EC2 Spot Fleet

Spot Instances and On-Demand Instances to meet the target capacity that you specified.

Amazon Elastic Container Service (ECS) logo

Amazon Elastic Container Service (ECS)

Fully managed container orchestration service.

Amazon Elastic File Service (EFS) logo

Amazon Elastic File Service (EFS)

Cloud storage service provided by Amazon Web Services.

Amazon Elastic Transcoder logo

Amazon Elastic Transcoder

Convert and transcode media files stored in Amazon S3.

Amazon ElastiCache logo

Amazon ElastiCache

Fully managed, Redis- and Memcached-compatible service delivering real-time performance for modern applications by Amazon Web Services.

Amazon Elasticsearch Service logo

Amazon Elasticsearch Service

Fully managed service to deploy, secure, and run Elasticsearch cost effectively at scale, without the operational overhead.

Amazon EMR logo

Amazon EMR

Cloud big data platform for processing vast amounts of data using open source tools.

Amazon EventBridge logo

Amazon EventBridge

Serverless event bus to connect applications together using data from your own applications, integrated SaaS applications, and AWS services.

Amazon FSx for Lustre logo

Amazon FSx for Lustre

Makes it easy and cost-effective to launch and run the popular, high-performance Lustre file system.

Amazon FSx for Windows File Server logo

Amazon FSx for Windows File Server

Provides a managed Microsoft Windows file servers, backed by a native Windows file system.

Amazon GameLift logo

Amazon GameLift

Enables developers to deploy, operate, and scale dedicated, low-cost servers in the cloud for session-based, multiplayer games.

Amazon Inspector logo

Amazon Inspector

Tests the network accessibility of your EC2 instances and the security state of your applications that run on those instances.

AWS IoT logo

AWS IoT

Run local compute, messaging, data caching, and machine learning inference capabilities.

Amazon Keyspaces for Apache Cassandra logo

Amazon Keyspaces for Apache Cassandra

Scalable, highly available, and managed Apache Cassandra–compatible database service.

Amazon Kinesis Data Analytics logo

Amazon Kinesis Data Analytics

Transform and analyze streaming data in real time with open source framework and engine for processing data streams (Apache Flink).

Amazon Kinesis Data Firehose logo

Amazon Kinesis Data Firehose

Fully managed service for delivering real-time streaming data.

Amazon Kinesis Data Streams logo

Amazon Kinesis Data Streams

Collect log and event data from sources such as servers, desktops, and mobile devices.

Amazon Kinesis Video Streams logo

Amazon Kinesis Video Streams

Provides you SDKs to install on your devices to make it easy to stream media.

Amazon Lex logo

Amazon Lex

Service for building conversational interfaces for applications using voice and text.

Amazon MQ logo

Amazon MQ

Managed message broker service for Apache ActiveMQ that makes it easy to migrate to a message broker in the cloud.

Amazon MSK logo

Amazon MSK

Fully managed service that enables you to build and run applications that use Apache Kafka to process streaming data.

Amazon Neptune logo

Amazon Neptune

Fast, reliable, fully managed graph database built for highly connected datasets.

Amazon Polly logo

Amazon Polly

Cloud service that converts text into lifelike speech.

Amazon Quantum Ledger Database (QLDB) logo

Amazon Quantum Ledger Database (QLDB)

Ledger by a central trusted authority that provides an immutable, and cryptographically verifiable transaction log.

Amazon Redshift logo

Amazon Redshift

Data warehouse product which forms part of the larger cloud-computing platform AWS.

Amazon Rekognition logo

Amazon Rekognition

Amazon Rekognition makes it easy to add image and video analysis to your applications.

Amazon Route 53 logo

Amazon Route 53

Effectively connects user requests to infrastructure running in AWS.

Amazon Simple Email Service (SES) logo

Amazon Simple Email Service (SES)

Cloud-based service that helps developers send marketing, notification, and transactional emails.

Amazon Simple Notification Service (SNS) logo

Amazon Simple Notification Service (SNS)

Provides a simple web services interface that can be used to create topics you want to notify apps.

Amazon Simple Queue Service (SQS) logo

Amazon Simple Queue Service (SQS)

Programmatic sending of messages via web service applications.

Amazon Simple Workflow Service (SWF) logo

Amazon Simple Workflow Service (SWF)

Makes it easy to build applications that coordinate work across distributed components.

Amazon Textract logo

Amazon Textract

Makes it easy to add document text detection and analysis to your applications.

Amazon Transfer Family logo

Amazon Transfer Family

Provides fully managed support for file transfers directly into and out of Amazon S3 using SFTP, FTPS, and FTP.

Amazon Translate logo

Amazon Translate

Text translation service using machine learning to provide high-quality translation on demand.

Amazon VPC (NAT Gateway) logo

Amazon VPC (NAT Gateway)

Connect to the Internet from instances within a private subnet in an AWS Virtual Private Cloud.

Amazon WorkMail logo

Amazon WorkMail

Secure, managed business email and calendaring service with support for existing desktop and mobile email clients.

Are you looking for something different?

We have hundreds of apps, extensions, and other technologies to customize your environment

Extend your knowledge

Learn the Dynatrace Query Language

Learn the Dynatrace Query Language

Explore data, discover patterns, anomalies and outliers, and create statistical modeling with DQL, our powerful query language..
Learn DQL
Get certified and advance your career

Get certified and advance your career

Go to Dynatrace University for practical, on-demand courses and learning paths -- from platform basics to key certifications.
Build skills