


Skip to technology filters Skip to main content
Dynatrace Hub

Extend the platform,
empower your team.

Popular searches:
Home hero bg
Distributed TracingDistributed Tracing
Distributed Tracing

Distributed Tracing

Analyze and slice distributed traces by any attribute and from any source.

App
Try in PlaygroundDocumentation
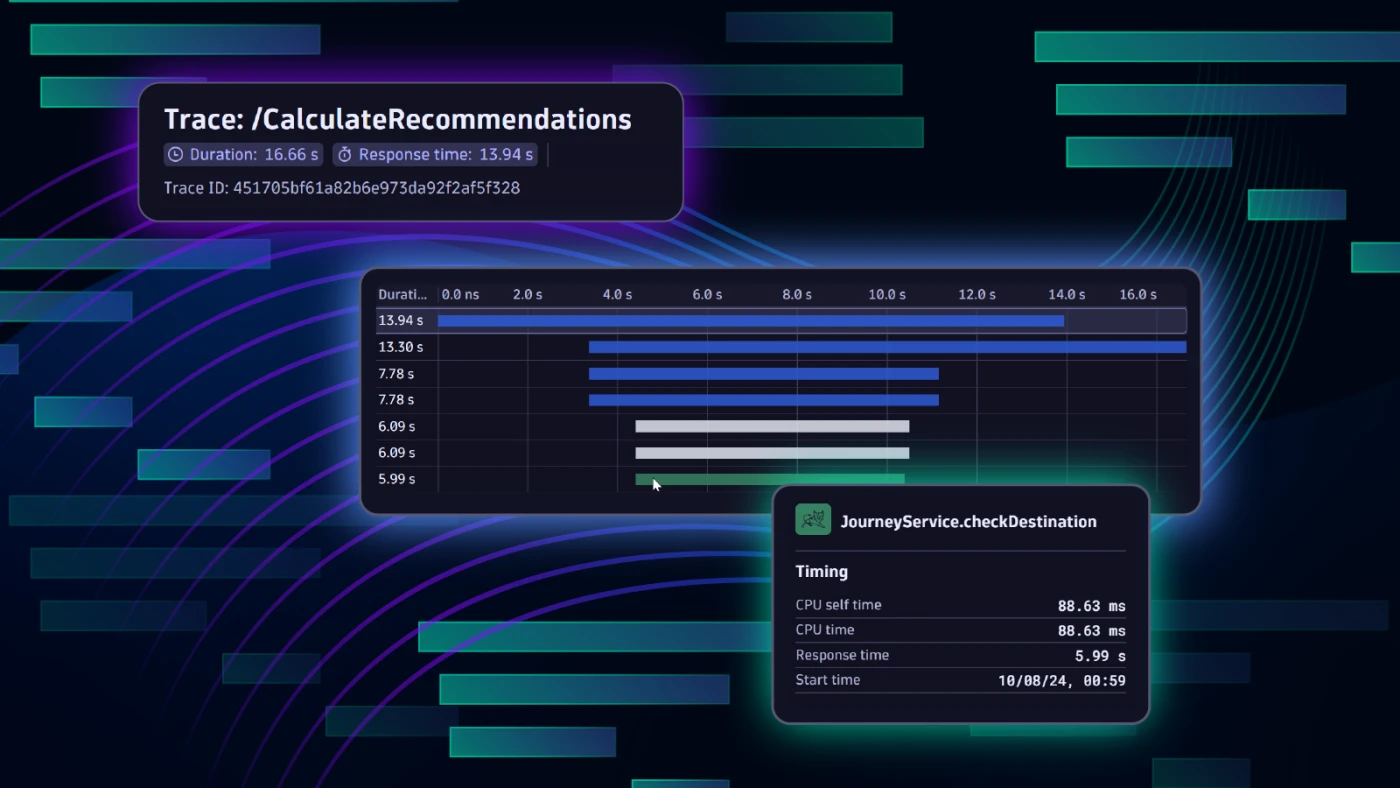
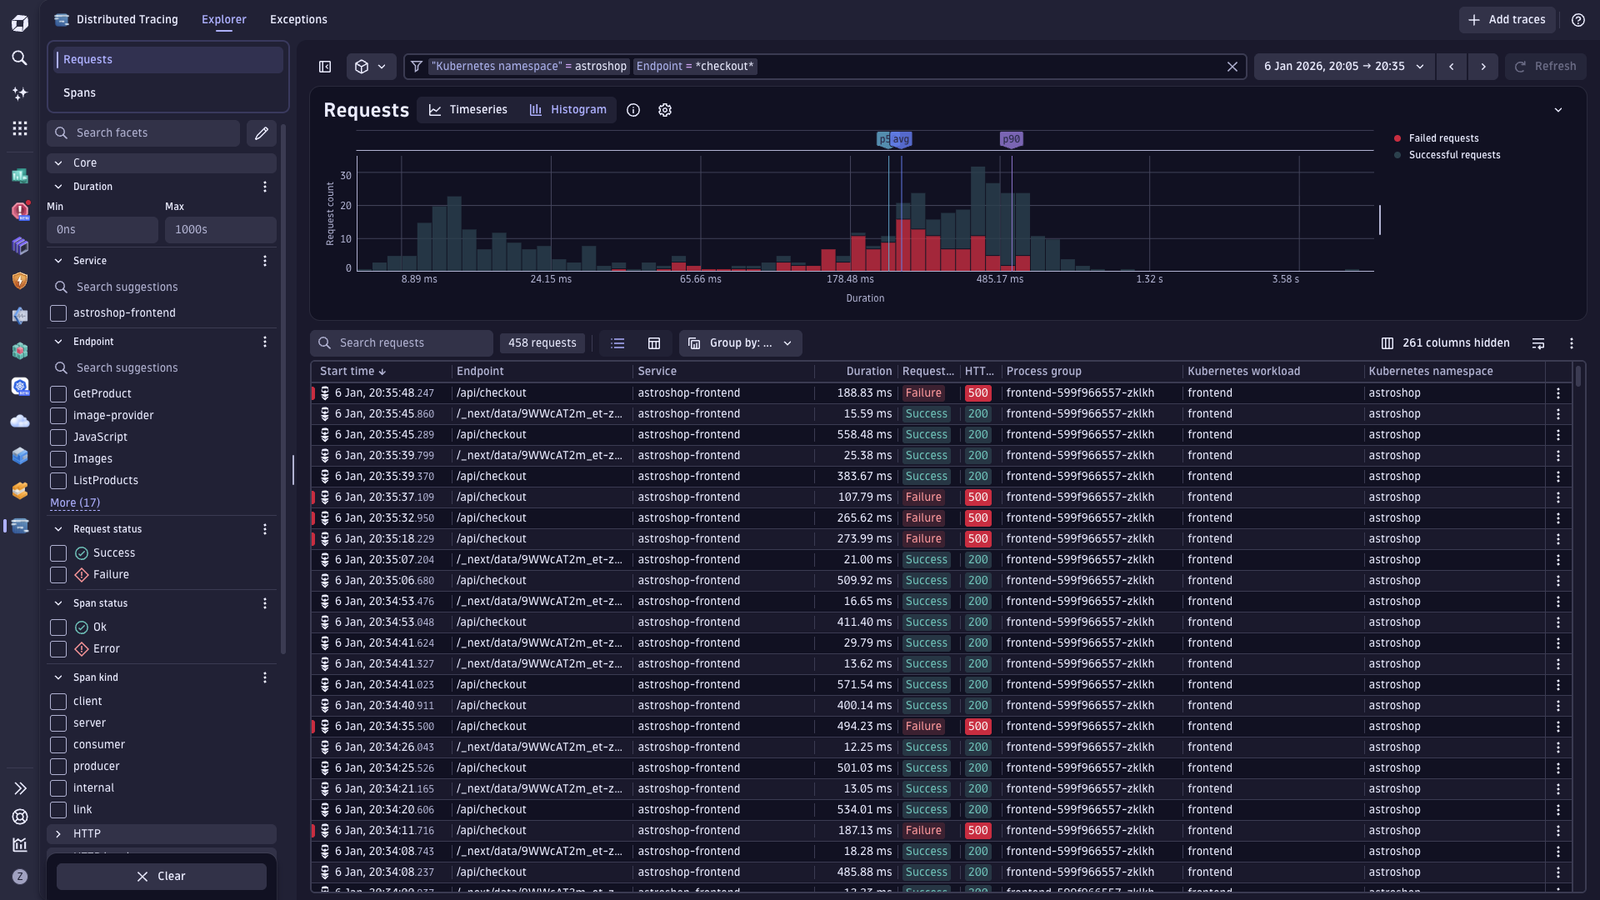
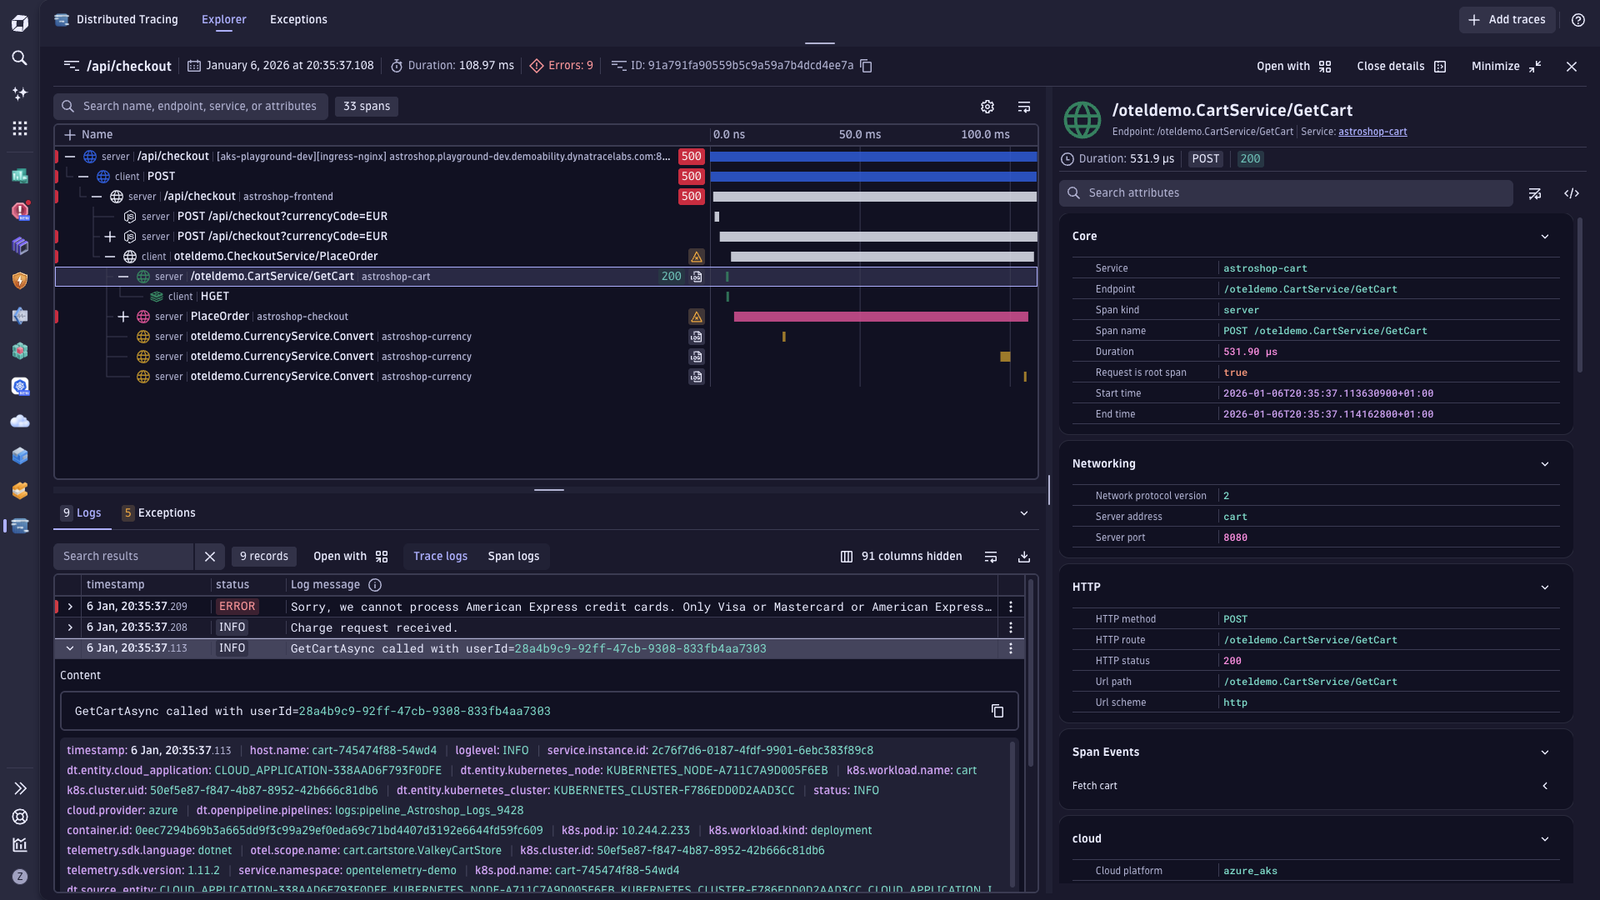
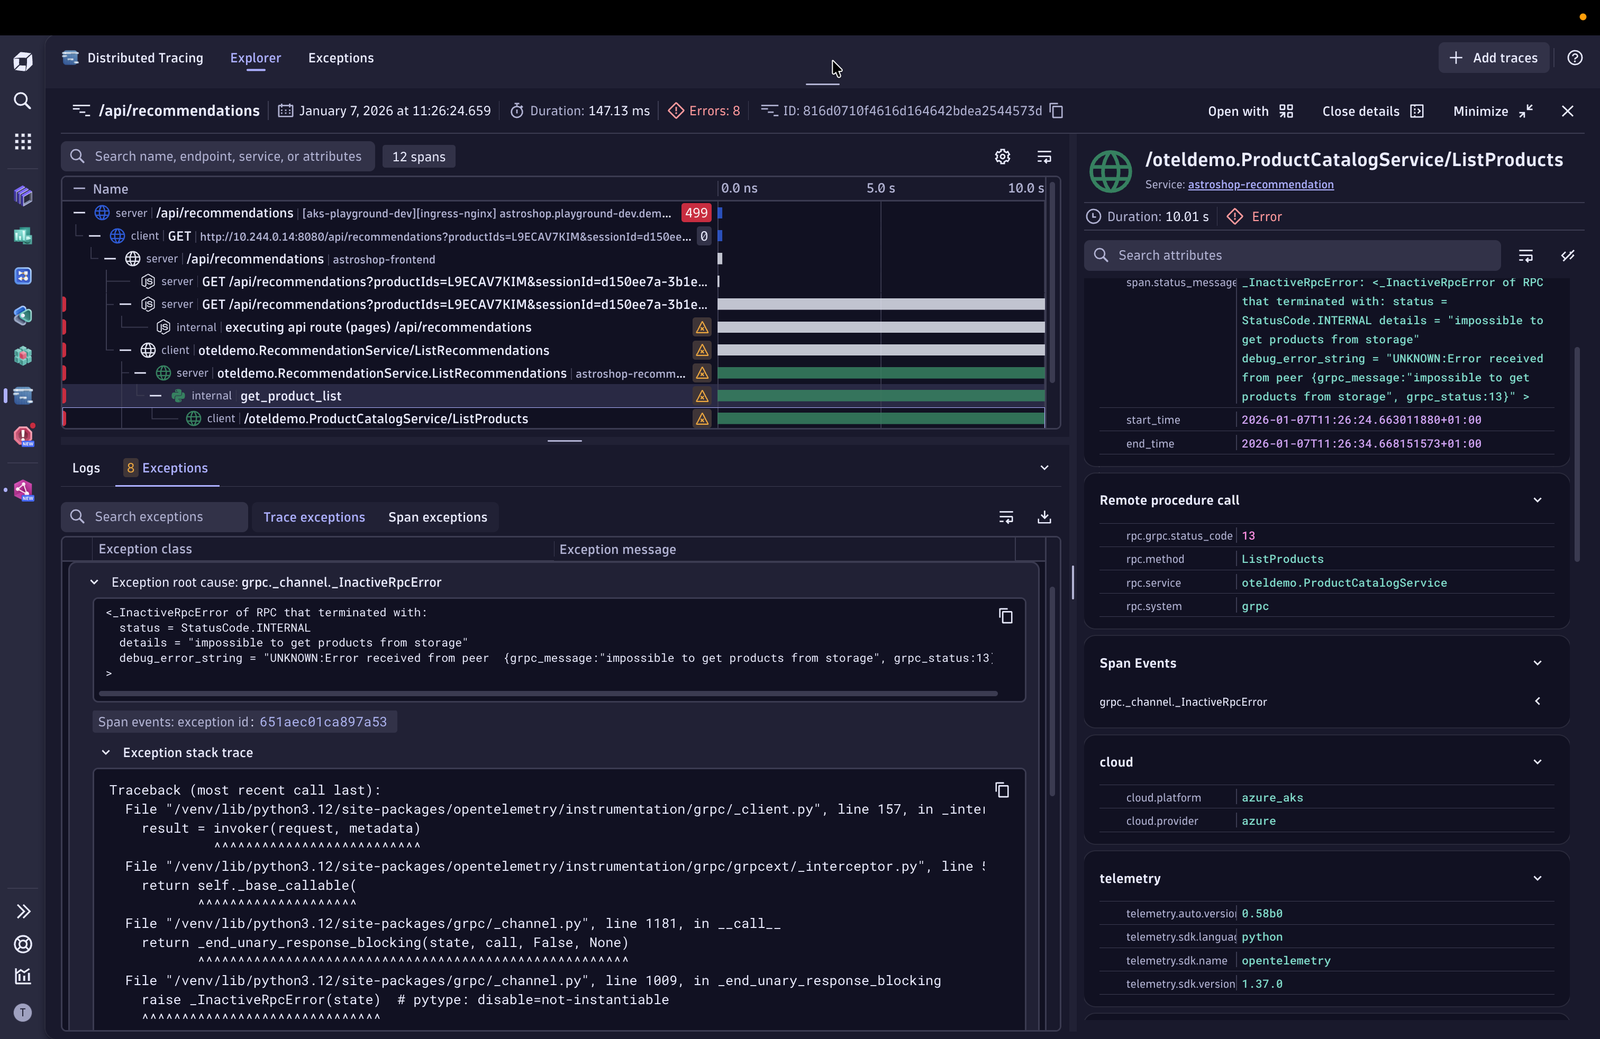
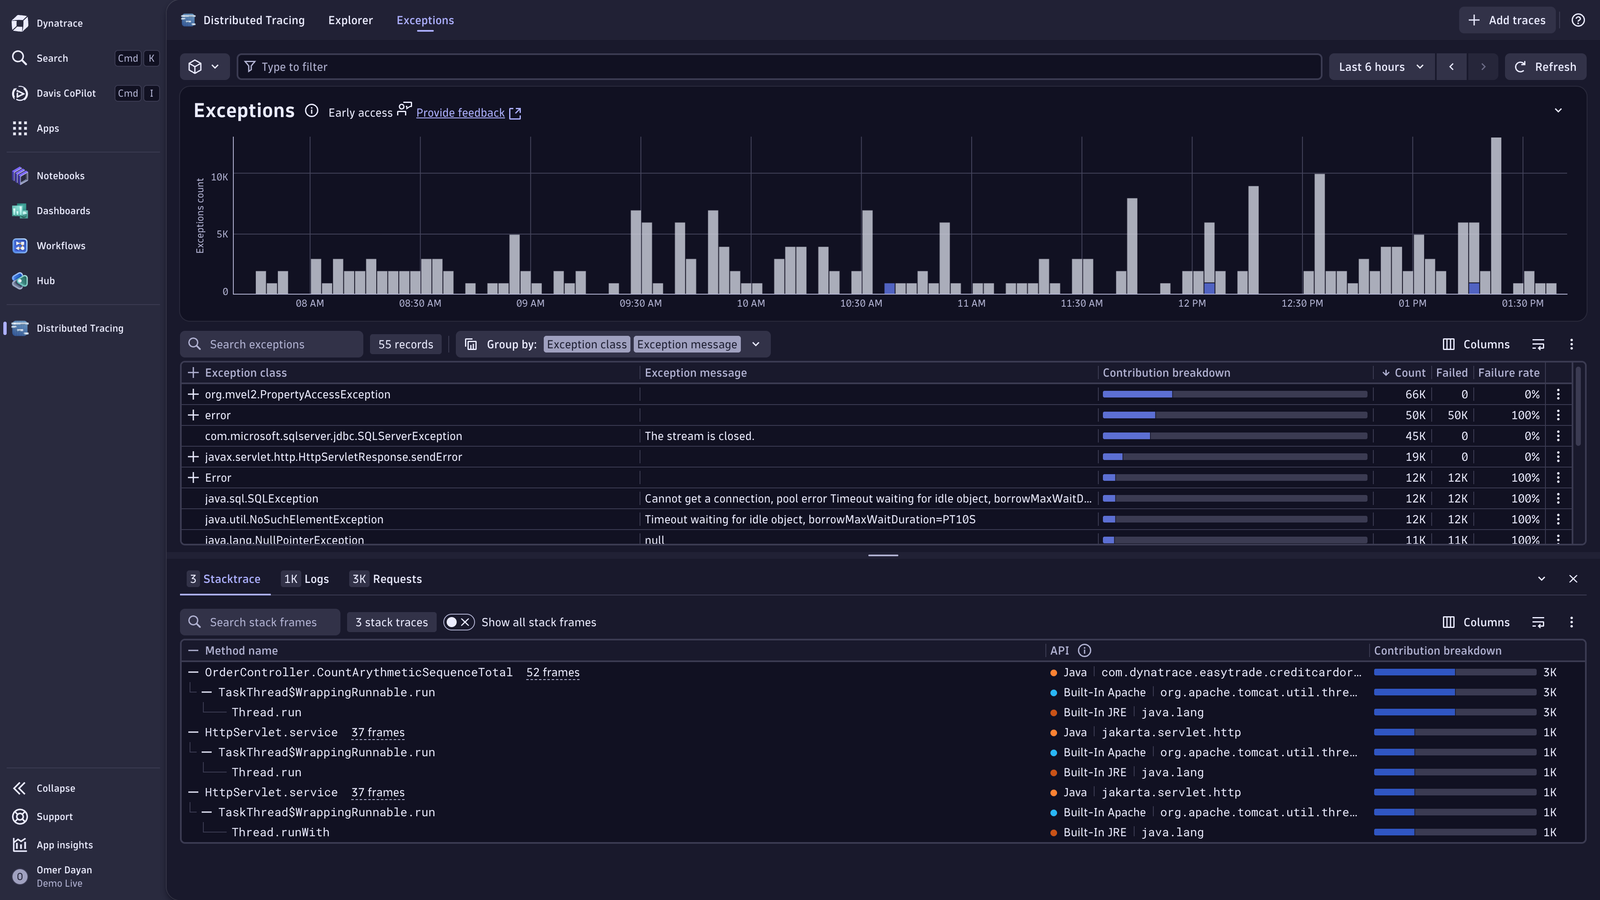
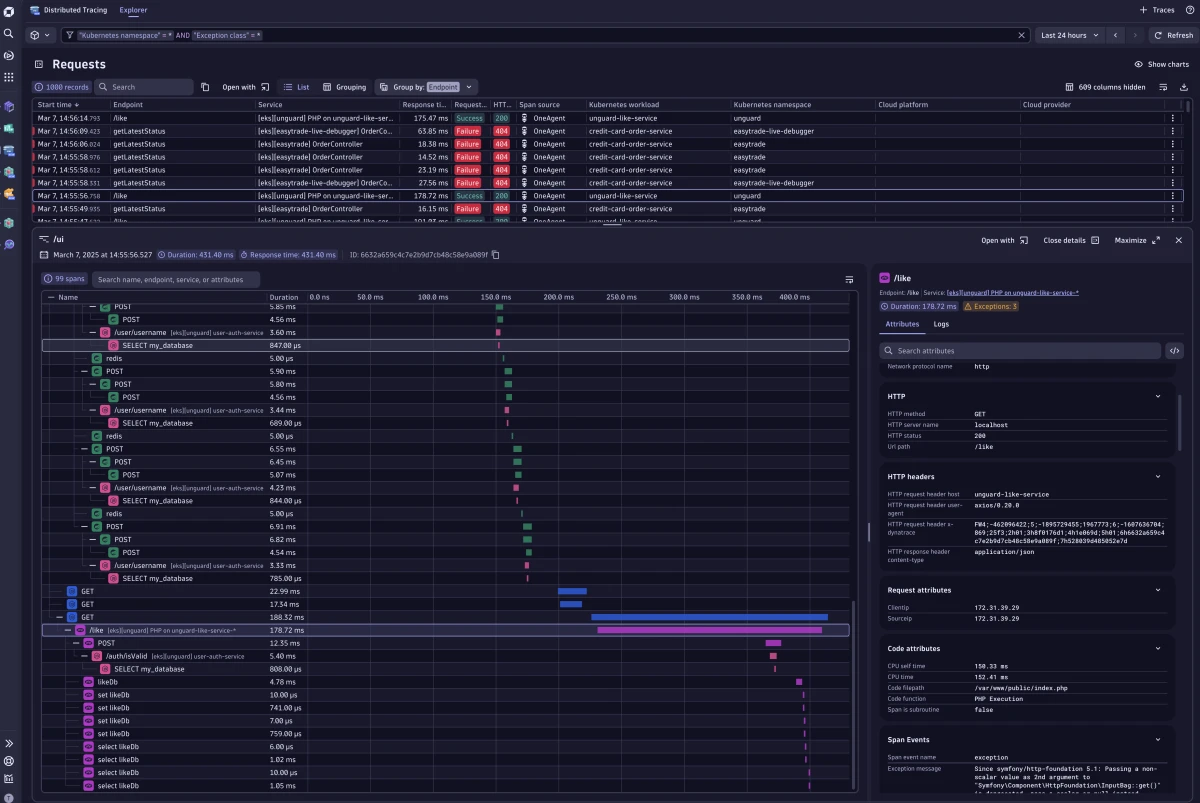
Quickly understand response times and errors using dynamic visualization tools like histogramsDive into the details of a trace and explore related logsEasily track all exceptions within a span with clear relationships and exception chains showing root causeSurface and analyze exceptions across traces with readable stack traces, aggregated insights, and visual markers highlighting problematic spans
  • Product information
  • Release notes

Overview

Since 2006, Dynatrace has pioneered distributed tracing with patented PurePath® technology, which combines distributed tracing attributes with additional insights like user experience insights, logs, metrics, topology information, metadata, and even code-level profiling information to provide the highest level of data fidelity and granularity. Distributed Tracing seamlessly integrates OpenTelemetry tracing signals with traces that are either automatically captured by OneAgent or ingested via the Trace Ingest API.

Use cases

  • Performance optimization: Pinpoint performance issues and optimize system response times through interactive analysis.
  • Troubleshooting: Monitor and diagnose errors and performance issues in complex distributed software environments.
  • Find the "needle in the haystack".
  • Comprehensive Exception Analysis.

Get started

Documentation

  • Distributed Tracing

Videos

  • Unleash the Power of Distributed Traces

  • Analyze and filter trace data with Dynatrace

  • Discover the New Distributed Tracing Experience with the Best OpenTelemetry Support

Blogs

  • Data in context: How Dynatrace solves the OpenTelemetry analytics challenge

  • Logs and traces: Why context is everything for seamless investigations

  • Distributed tracing with Dynatrace just got even better

  • New Distributed Tracing app provides effortless trace insights

Details

Compatibility information

Distributed Tracing requires that Traces powered by Grail be available in your environment. For details, see Dynatrace Grail documentation.

Dynatrace
DocumentationMore Information
By Dynatrace
Dynatrace support center
Subscribe to new releases
Copy to clipboard

Related to Distributed Tracing

OneAgent logo

OneAgent

The simplest way to capture all observation signals automatically and in context.

OpenTelemetry logo

OpenTelemetry

Ingest and analyze OTel traces & metrics, set health alerts & view in context.

More resources

Distributed tracing with Dynatrace just got even better

Distributed tracing with Dynatrace just got even better

Get ready to experience a whole new world of limitless tracing power. With our latest enhancements, we’re transforming the way you work with trace data.
Dive deep

New Distributed Tracing app provides effortless trace insights

New Distributed Tracing app provides effortless trace insights

Distributed tracing provides visibility, allowing you to track and analyze requests across system components. Such insights are invaluable for discovering unknown unknowns, diagnosing issues, and ensuring efficient operations.
Explore more
Logs and traces: Why context is everything for seamless investigations

Logs and traces: Why context is everything for seamless investigations

When alerts fire at 3 AM, you need answers fast. Discover how seamless navigation between logs and traces eliminates context switching and accelerates root cause analysis with real troubleshooting scenarios
Read more

Full version history

ReleaseDate

Full version history

1.36.0

Minor Changes

  • Switched duration bar scaling to use Symlog scaling to better display values visually.
  • Fixed filter value suggestions to show all available values when using OR conditions. AND conditions continue to scope suggestions to matching values.
  • Columns configuration are now split for Requests and Spans view mode.

Patch Changes

  • Fixed request grouping table not showing data.

Full version history

1.35.0

Minor Changes

  • Added keyboard shortcuts to the span list and exception grouping tables:
    • Press L on a focused span list row to open related logs.
    • Press T on a focused exception grouping row to view traces.
    • Opening a detail panel moves focus into it; pressing Escape closes the panel and returns focus to the table.
  • Added primary and domain tags in facets panel and details view.
  • Improved search in trace view: the search now matches across all span attributes, and steppers let you traverse between matching results.
  • Suppressed single trace view chip when there are no warnings and updated trace ID chip.
  • Added view-traces-addon intent that opens a modal allowing users to navigate through a list of matching traces using stepper.
  • Added drilldowns when the trace view is opened as an add-on modal.
  • Improved drilldown actions with updated visual layout.

Patch Changes

  • Fixed exception count in Trace view to be aligned with the number of rows in the exception table.
  • Adapted duration percentiles to account for sampled and aggregated spans.
  • Fixed incorrect span fields caching.
  • Fixed a crash in span details when a span attribute holds an empty array.
  • Fixed wrong exception being selected when clicking row in trace waterfall in rare circumstances.
  • Improved the empty state message shown when no exceptions are found.
  • Fixed the Exception Analysis table crashing when re-ordering columns in a specific way.
  • Exception class is now pinned in the Exceptions analysis.
  • Fixed a DQL parsing error where unquoted string values in facet filters were not being properly escaped.

Full version history

1.34.0

Minor Changes

  • Adapted span details to display attributes in alphabetical order.
  • Added a fallback URL displayed in waterfall table when url.full is not available.

Patch Changes

  • The Exception class is now always kept as the first grouping column in Exception Analysis.
  • Fixed invalid exception filter when navigating from grouping mode to Exception Analysis.
  • Fixed app crashing when using unsupported comparison operators in the filter field.
  • Fixed view trace modal not rendering when start_time is absent from intent payload.
  • Fixed warning toast showing multiple times in trace view.
  • Fixed an error in Exception Analysis when expanding grouped rows or changing grouping order.

Full version history

1.32.2

Minor Changes

  • Update Full-Stack Adaptive Traffic Management and trace capture dashboard with clearer metrics and volume breakdown.
  • Added meter bar visualization to the duration cell in the span list table.
  • Enabled Davis Copilot conversations in the trace Logs viewer.
  • Added keyboard shortcuts: press [S] to jump to the search bar, press [F] to jump to the filter field.

Patch Changes

  • Fixed error in "Usage - Traces" ready-made dashboard when no users or data are available.
  • Fixed list/grouping toggle button group disappearing on smaller screen sizes.
  • Fixed view trace action in request table.
  • Fixed an issue where the search input in Exception Analysis could drop keystrokes when typing.
  • Fixed explorer table not updating data when switching view mode.
  • Improved error handling with more user friendly messages.
  • Improved formatting of facet counts.

Full version history

1.30.1

Minor Changes

  • Added a new ready-made dashboard "Usage - traces" for usage traces.
  • Added possibility to cancel running queries.
  • Added counts for suggestion based facets.
  • Added span name to single trace view if endpoint limit is reached.
  • Added support for opening a trace in a new browser tab by Ctrl+click (Win), Cmd+click (Mac), or middle-click on a list table row.
  • Added the help menu entry for keyboard shortcuts.
  • Improved span name visibility in trace view waterfall table by pinning Gantt chart column.
  • Improved Exceptions analysis logic by applying exception class filter to queries.
  • Improve performance of single trace view by loading non-essential span attributes on-demand.
  • Improved trace view tree assembly in some cases when alternate parent span id is present.

Patch Changes

  • Fixed filters applied from boolean facets resulting in invalid filter statements.
  • Fixed certain attributes being misspelled in filter bar and facets.
  • Fixed browser back button not clearing segments in segment selector.
  • Fixed a facet error when filtering exclusively by its own field.
  • Fixed grouping selection change not switching to grouping table.
  • Fixed app crashing when entering a key with spaces in filter field.
  • Fixed a chart error in Exception Analysis when filtering only by non-exception fields.
  • Fixed facets showing error for certain request attributes with spaces and brackets in attribute name.
  • Fixed an issue where facets were incorrectly shown in loading state.
  • Fixed stack traces table showing stack traces of unrelated exceptions.
  • Fixed display names sometimes bleeding into DQL queries through the filter state.
  • Fixed first row in the Explorer list table being unselectable.
  • Fixed zooming in the histogram chart resulting in an error.
  • Fixed exceptions page table cell actions not allowing to apply filter actions.
  • Replaced the feedback link in the help menu with an inline feedback form.
  • Fixed trace view span attributes not loading in certain cases.
  • Fixed an issue with the action buttons in the logs panel.
  • Made a few previously hidden fields like http.status_code available for filtering.
  • Improved loading of trace view span attributes.

Full version history

1.27.1

Patch Changes

  • Added support for preserving column sorting in the URL.
  • Fixed certain spans being filtered out in explorer timeseries chart
  • Fixed Explorer sidebar not being dismissible on mobile.
  • Fixed sub-optimal sampling ratio being applied to queries for Exceptions screen.

Minor Changes

  • Added raw/extrapolation mode settings to Exception Analysis.
  • Added trace duration chip to single trace view header
  • Removed cooldown of Refresh button.

Full version history

1.26.0

Minor Changes

  • Added button to single trace modal allowing to navigate to Distributed Tracing app.

Patch Changes

  • Fixed incorrect welcome screen when no trace data is ingested.

Full version history

1.24.1

Patch Changes

  • Fixed an issue where the view trace intent failed to show a trace.

1.24.0

Minor Changes

  • Deduplicated exceptions in trace view exceptions list table.
  • Added URL path attribute to endpoints node in waterfall table.

Patch Changes

  • Fixed line height miscalculation when closing and opening attributes in the single trace view.

Full version history

1.24.0

Minor Changes

  • Improved exceptions chaining in trace view exceptions list table.
  • Added URL path attribute to endpoints nodes in waterfall table.

Patch Changes

  • Fixed line height miscalculation when closing and opening attributes in the single trace view.

Full version history

1.22.0

Features

  • Added a new "Exceptions" perspective to the Distributed Tracing app that offers a streamlined way to analyze exceptions and errors over time, dive into aggregated stacktraces for full context and identify impacted services and endpoints.

Patch Changes

  • Ensured nanosecond precision for the calculation of the trace time.
  • Excluded spans with invalid or anomalous durations to enhance the accuracy of duration-based queries.
  • Exception analysis now leads to 3rd gen Services app, if it is already enabled.
  • Fixed browser history pollution for trace view.
  • Updated Kubernetes-related intents with new IDs.

Full version history

1.21.1

Patch Changes

  • Removed default first row expansion behavior from Grouping table.
  • Showed a banner when the user is filtering for an opaque service.
  • Fixed an issue where a warning toast was incorrectly shown in the trace view.
  • Fixed filter field lagging behind keystrokes when typing fast.
  • Fixed timeframe resetting to 30 mins due to daylight savings time.
  • Added all segment read permissions.

Full version history

1.21.0

Minor Changes

  • Added support for persisting collapsed/expanded state of the bottom panel in the trace view.

Patch Changes

  • Fixed issue where the view mode selector could become out of sync with the applied view mode during rapid switching.
  • Fixed issue regarding the span attribute panel if there is a specific mix of simple and complex attributes.

Full version history

1.20.0

Minor Changes

  • Added bi-directional scrolling to exceptions and waterfall table.
  • Added row actions for the exceptions table in the trace view.

Patch Changes

  • Fixed iterative negation filters not matching for null or empty arrays.
  • Fixed empty warning notification shown in case of duplicate spans when viewing a single trace.

Full version history

1.19.0

Minor Changes

  • Replaced exceptions key-value list with expandable caused-by chain and introduced span/trace mode toggle.
  • Removed view-service intent (view-traces should be used instead).

Patch Changes

  • Fixed filter field being cut off when it displayed multiple lines.
  • Fixed an issue where opening a trace from other apps would not find any spans in the trace view.
  • Fixed an issue where waterfall collapses opened nodes when selecting a log in single trace view.
  • Fixed a crash when opening a span in the trace view with exceptions but without exception ids in the failure detection results field.
  • Fixed missing segments selector proposals by requiring smartscape read permission.

Full version history

1.18.1

Patch Changes

  • Fixed failed count aggregation in grouping mode.
  • Fixed all timeframe formats handling for view-trace intent

1.18.0

Minor Changes

  • Added table settings for toggling visibility of span indicators and gantt chart in the table.

Patch Changes

  • Fixed incorrect missing permissions alert being shown when user had permissions granted conditionally.
  • Fixed Full Stack Monitoring ready-made dashboard deployment.
  • Fixed an issue where selecting filter cell actions for numeric values resulted in string comparison statements in the filter field.

Full version history

1.18.0

Minor Changes

  • Added table settings for toggling visibility of span indicators and Gantt chart in the table.
  • Improved data quality for single trace view.

Patch Changes

  • Fixed incorrect missing permissions alert being shown when user had permissions granted conditionally.
  • Fixed an issue where selecting filter cell actions for numeric values resulted in string comparison statements in the filter field.

Full version history

1.16.3

Patch Changes

  • 65636b7: Fixed Full Stack Monitoring ready-made dashboard deployment.

1.16.2

Patch Changes

  • Added a warning message for missing spans in the waterfall table.
  • Removed view-service-with-timeframe intent (view-traces should be used instead).

1.16.1

Patch Changes

  • Moved exceptions tab to logs panel and make it collapsible.
  • Fixed an issue where timeframes were missing from certain intents.
  • Fixed handling of bigInt and NaN values when copying to clipboard.
  • Changed histogram duration filter behavior to replace values instead of chaining them.

1.16.0

Minor Changes

  • N/A

Full version history

1.16.2

Patch Changes

  • Added a warning message for missing spans in the waterfall table.
  • Removed view-service-with-timeframe intent (view-traces should be used instead).
  • Fixed an issue where timeframes were missing from certain intents.
  • Fixed handling of bigInt and NaN values when copying to clipboard.
  • Changed histogram duration filter behavior to replace values instead of chaining them.

Minor Changes

  • Moved exceptions tab to logs panel and make it collapsible.

Full version history

1.14.0

Minor Changes

  • Kubernetes labels and annotations have been moved to their own groups for quicker filtering.
  • Added Drag and Drop functionality for column reordering.

Patch Changes

  • Fix nested attributes not appearing in rare cases.
  • Improved the search functionality in the grouping mode.
  • Fix capitalization of array valued display names for captured and request attributes.

Full version history

1.13.0

Minor Changes

  • Enabled ordering of aggregation columns in Grouping mode.
  • Moved collapse button for individual sections within groups to the right side in the span details.
  • Changed display name of dt.entity.kubernetes_cluster field to "Entity Kubernetes cluster id".

Patch Changes

  • Fixed potential filter key display name conflicts.
  • Fixed broken wildcard "*" in filter field.
  • Fixed time-series chart height.
  • Fixed outdated display names not being resolved correctly for the filter generation.
  • Improved empty state for logs in context by adding documentation links.
  • Added a toast when storing user's columns configuration.
  • Fixed "in" filter for Span Kind not working with suggested values.

Full version history

1.12.0

Minor Changes

  • Improved layout density of trace view.
  • Intents accept now start_time, timestamp and dt.timeframe to set the timeframe.
  • Introduced gear button for multiplicity mode selection.

Patch Changes

  • Fix intents not applying filters.
  • Made action column in list table sticky.
  • Fixed chart height not being restored when clicking the back button.
  • Improved trace view performance in certain custom link scenarios.
  • Fixed appearance of trace id and other affected attributes in the group by button.
  • Fixed an issue where no logs were shown when segments were selected.
  • Fixed license error page mistakenly claiming that trace query entitlement is required.

Full version history

1.10.3

Patch Changes

  • Fixed missing Intent action on entity values in Single Trace View.
  • Fixed filter field not suggesting UID-based filters.

1.10.2

Patch Changes

  • Added buttons to clear table search to table empty states.

1.10.0

Minor Changes

  • Added automatic scrolling to the currently selected log with the trace view.

Patch Changes

  • Fixed the Span source cell showing incorrect values in the grouping table.
  • Fixed an issue where default column order was not updated when switching view mode.

Full version history

1.10.2

Minor Changes

  • Added Logs in Context into single trace view.
  • Added support for multiple trace IDs to logs query.
  • Added automatic scrolling to the currently selected span within the single trace view.
  • Added automatic scrolling to the currently selected log within the single trace view.
  • Added support for reducing timeframes coming from intents (end time - 7 days) when they are too long.
  • Added a dedicated tab for showing exceptions in the single trace view.
  • Added text coloring for attribute values in single trace view based on type.
  • Added a generic intent which allows setting custom filters, grouping and view mode.
  • Added support for custom links in the single trace view.
  • Added support for grouping values within arrays, e.g. exception class.
  • Added support for segments to outgoing intents.
  • Added explanatory comments to DQL queries and missing links in ready-made dashboard.
  • Added buttons to clear table search to table empty states.
  • Improved facets layout to be more compact and improved search behavior to take group names into account.
  • Improved formatting of the attributes in the single trace view.
  • Improved filter field to show suggestions based on the input value.
  • Improved complex attribute handling.
  • Improved display of long values in the context menus.
  • Improved the default sizing logic of resizable panels.
  • Improved empty state messages in the explorer, span details, facets and segments.
  • Improved single trace span icons, enhanced waterfall table layout and removed duration column.
  • Improved performance of all queries including custom link query used for custom tagging single traces.
  • Increased scan byte limit for grouping table.
  • Replaced usages of deprecated request.id field with the new subtrace.id field.
  • Enhanced context menu actions for the table and span details.

Patch Changes

  • Fixed an issue where clicking the Add traces action would not do anything.
  • Fixed span source column for Span source filter.
  • Fixed long trace name shifting panel controls out of view.
  • Fixed incorrect query limit in single trace view query.
  • Fixed falsy boolean values not showing filter context actions.
  • Fixed grouping columns settings button showing incorrect label when grouping is empty.
  • Fixed suggestions in facets not taking segments into account.
  • Fixed the Span source cell showing incorrect values in the grouping table.
  • Fixed an issue where the default column order was not updated when switching view mode.
  • Renamed "Response time" field to "Duration" in requests view mode and removed duration chip from single trace view.
  • Removed automatic formatting for captured and request attribute names.
  • Changed naming convention of AWS, OTel and FaaS facet groups and attribute values.

Full version history

1.10.1

Patch Changes

  • Fixed Licensing to ensure availability

Full version history

1.10.0

Patch Changes

  • Fixed minor UI glitches

Full version history

1.6.2

Patch Changes

  • Fixed Licensing to ensure availability

Full version history

1.6.0

Patch Changes

  • Fixed minor UI glitches

Full version history

1.5.0

Minor Changes

  • Improved resizable panel integration.
  • Improved readability of charts & list query metadata.
  • Shipped ready-made dashboard.

Patch Changes

  • Fix timeseries chart erroring out when selecting a segment with 2 or more variables.
  • Fixed move group column action not working.
  • Renamed process group instance (id) to process (id).
  • Fixed in filters not working for uids, ips, and timestamps.
  • Fixed the Remove Filter cell action not working for in and not-in filter statements.
  • Fixed span details breaking for old service detection scenarios.
  • Fixed intent processing for Service-related intents.
  • Fixed request attribute filter handling of wildcard symbols.
  • Fixed HTTP status filter not working for negations.
  • Fixed a case where facet configuration modal could be opened with missing permissions.
  • Added intent for Synthetic monitoring.
  • Fixed server.address using wrong display name.

Full version history

1.4.0

Minor Changes

  • Added Endpoint name as a criterion to Requests view mode.
  • Made charts, tables and single trace view resizable.
  • Introduced new Datatable interactions
  • Introduced highlighting of selected span/request in list
  • Improved width calculation for table columns

Patch Changes

  • Improved filter DQL generation.
  • Improved Suggestions to be shown for partial numerical fields.
  • Fixed wrong query provided to intents for list with default columns.
  • Fixed negation filters for coalesced fields not working properly.
  • Fixed wrong sample rate being shown for the list table.
  • Fixed timeframe selector calendar incorrectly handling dd.mm.yyyy format.

Full version history

1.2.1

Minor Changes

  • The filter field now supports using in and not in filters. Example: Endpoint in (query, executeQuery).
  • Improved serialization of segments in URLs.

  • Added support for segment in intents.
  • Added support for alternative span parent id.
  • Added sampling to tracing list.
  • Added more detailed error messages whenever a trace id can not be found.

Patch Changes

  • Updated table links from Classic to the latest Dynatrace apps.
  • Fixed help menu item order.
  • Fixed reload button not working when charts query failed.
  • The facets in the sidebar are now updated automatically with new fields from an opened trace.
  • Fixed "About this app" link in the header menu.
  • Fixed escaping issues for complex filters.
  • Made initial permission check less strict.
  • Added new intent for viewing services which supports 'dt.timeframe'.
  • Improved sampling rate calculation.
  • Changes in the Segment selector now update the page.

Full version history

1.1.4

Patch Changes

  • Removed unnecessary permissions.

1.1.3

Patch Changes

  • Made initial permission check less strict.

1.1.2

Patch Changes

  • Fixed sample rate query by adding segments support.
  • Fixed permission check for spans bucket.
  • Fixed indentation in single trace view when manually making the span name column smaller.
  • Fixed an issue where the span limit for the list did not have any effect.
  • Fixed crash when entity name contains quote.
  • Fixed "Open with" button being shown under wrong conditions.
  • Fixed entity filters breaking when filtering for ~.

1.1.0

Minor Changes

  • Improved handling of timeseries chart for the last 2 minutes.

Patch Changes

  • Added additional properties to intents.
  • Added segments feature support.

Full version history

1.1.3

Patch Changes

  • Made initial permission check less strict.

1.1.2

Patch Changes

  • Fixed sample rate query by adding segments support.
  • Fixed permission check for spans bucket.
  • Fixed indentation in single trace view when manually making the span name column smaller.
  • Fixed an issue where the span limit for the list did not have any effect.
  • Fixed crash when entity name contains quote.
  • Fixed "Open with" button being shown under wrong conditions.
  • Fixed entity filters breaking when filtering for ~.

1.1.0

Minor Changes

  • Improved handling of timeseries chart for the last 2 minutes.

Patch Changes

  • Added additional properties to intents.
  • Added segments feature support.

Full version history

1.1.2

Patch Changes

  • Fixed permission check for spans bucket.
  • Fixed indentation in single trace view when manually making the span name column smaller.
  • Fixed an issue where the span limit for the list did not have any effect.
  • Fixed crash when entity name contains quote.
  • Fixed entity filters breaking when filtering for ~.

Full version history

1.1.1

Patch Changes

  • Fixed "Open with" button being shown under wrong conditions

Full version history

1.1.0

Major

  • Release of the Distributed Tracing app (List + Single trace view)
Dynatrace Hub
Hub HomeGet data into DynatraceBuild your own app
Dynatrace Intelligence - Agentic Operations SystemThe Dynatrace Agentic AI ecosystem
All (914)Log Management and AnalyticsKubernetesAI and LLM ObservabilityInfrastructure ObservabilitySoftware DeliveryApplication SecurityBusiness ObservabilityDigital Experience
Filter
Type
Built and maintained by
Deployment model
SaaS
  • SaaS
  • Managed
Partner FinderBecome a partnerDynatrace Developer

Application Observability

Optimize your service performance, innovate faster, and collaborate efficiently with automatic and intelligent observability at scale and end-to-end distributed tracing for cloud-native workloads and enterprise apps.

Essentials

Get started with these popular tools for monitoring your applications and microservices.

OpenTelemetry logo

OpenTelemetry

Ingest and analyze OTel traces & metrics, set health alerts & view in context.

Serverless logo

Serverless

Seamless integration with serverless technologies to eliminate blind spots through OOTB integrations with AWS, Azure, and Google Cloud.

Kubernetes logo

Kubernetes

All-in-one Kubernetes observability for K8s infrastructure and apps teams.

Distributed Tracing logo

Distributed Tracing

Analyze and slice distributed traces by any attribute and from any source.

Runtimes

Java logo

Java

Optimize Java performance with E2E monitoring and AI-driven root cause analysis.

.NET logo

.NET

Automatic end-to-end observability for .NET applications and processes.

Go logo

Go

Automatic and intelligent end-to-end observability for Go applications.

Node.js logo

Node.js

Automatic and intelligent end-to-end observability for Node.js applications.

Python logo

Python

Trace your Python apps and services with real-time metrics and automatic RCA.

PHP logo

PHP

Automatic and intelligent end-to-end observability for PHP applications.

Observability frameworks

OpenTelemetry logo

OpenTelemetry

Ingest and analyze OTel traces & metrics, set health alerts & view in context.

Micrometer logo

Micrometer

Ingest Spring metrics and put them in context of trace, log and diagnostics data.

Prometheus logo

Prometheus

Unlock Prometheus power with intelligent analytics and automated insights.

Fluentd logo

Fluentd

Stream log data to Dynatrace via Fluentd for analysis.

Fluent Bit logo

Fluent Bit

Stream logs to Dynatrace via Fluent Bit for analysis and AI observability.

Logstash logo

Logstash

Stream log data from Logstash and analyze it in Dynatrace.

Serverless

AWS Lambda logo

AWS Lambda

Automatic and intelligent end-to-end observability of AWS Lambda traces and logs.

Azure Functions logo

Azure Functions

Observability for serverless and hybrid environments using Azure Functions.

Google Cloud Functions logo

Google Cloud Functions

E2E observability for serverless and hybrid environments using Google Functions.

Azure App Service logo

Azure App Service

Cloud platform for hosting websites, created and operated by Microsoft.

Azure Container Instance logo

Azure Container Instance

Deploy and manage serverless containers on the Microsoft Azure cloud, without having to manage any underlying infrastructure.

Google Cloud Run logo

Google Cloud Run

Dynatrace provides AI-powered observability into serverless containerized apps running on Google Cloud Run.

Databases

Redis logo

Redis

Automatically and intelligently observe, analyze & optimize your Redis server.

MySQL logo

MySQL

Automatically and intelligently observe, analyze and optimize how your the usage, health and performance of your database.

Apache Cassandra logo

Apache Cassandra

Improve Apache Cassandra observability.

Couchbase logo

Couchbase

Couchbase Capella (SaaS) database monitoring.

Message queues

Apache Kafka logo

Apache Kafka

Automatic and intelligent observability with trace and metric insights.

RabbitMQ logo

RabbitMQ

Automatic end-to-end traces of producers and consumers for RabbitMQ.

Apache ActiveMQ Classic logo

Apache ActiveMQ Classic

Automatic and smart observability for ActiveMQ with trace and metric insights.

Apache ActiveMQ Artemis logo

Apache ActiveMQ Artemis

ActiveMQ Artemis observability with end-to-end producers and consumers tracers.

Microsoft Message Queuing (MSMQ) logo

Microsoft Message Queuing (MSMQ)

Observability for MSMQ with end-to-end traces of connected producers/consumers.

Application stacks

Reactor Core logo

Reactor Core

End-to-end trace your applications when the Reactor Core publishers Mono and Flux are used.

Spring logo

Spring

End-to-end observability for Java Spring apps, automatic and intelligent.

Netty logo

Netty

End-to-end observability for your Netty web framework with code-level insight.

IBM WebSphere Application Server logo

IBM WebSphere Application Server

Automatically and intelligently monitor, analyze, and optimize your application server and all applications deployed anywhere in your stack.

More resources

Adobe Experience Manager Cloud Service logo

Adobe Experience Manager Cloud Service

End-to-end observability for your Adobe Experience Manager Cloud Service.

Adobe PhoneGap logo

Adobe PhoneGap

Monitor hybrid mobile apps built with Adobe PhoneGap running on iOS or Android.

Amazon Corretto logo

Amazon Corretto

Automatically and intelligently monitor, analyze, and optimize the performance of your virtual machine.

AngularJS logo

AngularJS

JavaScript-based open-source front-end web framework mainly maintained by Google.

Apache Axis2 logo

Apache Axis2

Core engine for Web services.

Apache Camel logo

Apache Camel

Intelligently monitor, analyze, and optimize your integration framework and all applications deployed in your stack.

Apache CXF logo

Apache CXF

Open-source, fully featured Web services framework.

Apache OpenEJB logo

Apache OpenEJB

Automatically and intelligently monitor, analyze and optimize your applications based on Apache OpenEJB.

Apache Tomcat logo

Apache Tomcat

Automatically and intelligently monitor, analyze, and optimize your application server and all applications deployed anywhere in your stack.

Apache TomEE logo

Apache TomEE

Automatically and intelligently monitor, analyze, and optimize your application server and all applications deployed anywhere in your stack.

Apache Zookeeper logo

Apache Zookeeper

Monitor and analyze your Apache Zookeeper with this JMX-based extension.

Apigee logo

Apigee

Remotely monitor your Apigee proxies.

Azul Platform Core (Zulu) logo

Azul Platform Core (Zulu)

Automatically and intelligently monitor, analyze, and optimize the performance of your virtual machine.

Azul Platform Prime (Zing) logo

Azul Platform Prime (Zing)

Automatically and intelligently monitor, analyze, and optimize the performance of your virtual machine.

Backbone.js logo

Backbone.js

JavaScript library based on the Model–view–presenter application design paradigm.

BellSoft Liberica logo

BellSoft Liberica

Automatically and intelligently monitor, analyze, and optimize the performance of your virtual machine.

BOSH bpm logo

BOSH bpm

Automated monitoring of platform processes running in BOSH bpm containers.

C logo

C

Procedural programming language supporting lexical variable scope, and recursion.

CakePHP logo

CakePHP

Automatically and intelligently monitor, analyze, and optimize your applications developed with CakePHP.

CentOS logo

CentOS

Community-supported computing platform compatible with Red Hat Enterprise Linux.

IBM CICS Transaction Gateway for z/OS logo

IBM CICS Transaction Gateway for z/OS

Intelligently monitor your transactions end-to-end and analyze the performance of your CICS Transaction Gateway on z/OS.

Cloud Foundry logo

Cloud Foundry

Harness automation and AI to simplify observability on Cloud Foundry at scale.

Connection Pools: JBoss logo

Connection Pools: JBoss

Application server method of pooling and sharing connections to a database.

Connection Pools: Apache Commons logo

Connection Pools: Apache Commons

Application method of pooling and sharing multiple connections to a database.

Connection Pools: C3P0 logo

Connection Pools: C3P0

Application server method of pooling and sharing connections to a database.

Tomcat (JMX) logo

Tomcat (JMX)

JMX monitoring of Tomcat connection and thread pools, and web request activity.

Connection Pools: WebLogic logo

Connection Pools: WebLogic

Application server method of pooling and sharing connections to a database.

Connection Pools: WebSphere Liberty logo

Connection Pools: WebSphere Liberty

Application server method of pooling and sharing connections to a database.

Consul Service Mesh (StatsD) logo

Consul Service Mesh (StatsD)

Extend visibility into your Consul Service Mesh instances to monitor health and improve performance.

containerd logo

containerd

Distributed tracing and metrics for services in containerd in Kubernetes.

Red Hat Enterprise Linux CoreOS logo

Red Hat Enterprise Linux CoreOS

Open-source lightweight OS based on the Linux, providing infrastructure to clustered deployments.

cri-o logo

cri-o

Distributed tracing and metrics for services in cri-o containers in Kubernetes.

Observability for Developers on Cursor logo

Observability for Developers on Cursor

Get Real time Code-Level data directly to your Cursor IDE.

Debian logo

Debian

Association of individuals who have made common cause to create a free operating system.

Disk Analytics logo

Disk Analytics

This extension allows more detailed visibility on Linux hosts' local datastores where OneAgent is installed.

Drupal logo

Drupal

Web content management for back-end framework.

Dynatrace Bindplane logo

Dynatrace Bindplane

Optimize and manage your telemetry at the edge before it reaches Dynatrace.

Eclipse Jetty logo

Eclipse Jetty

Automatically and intelligently monitor and analyze your Jetty applications.

Eclipse OpenJ9 logo

Eclipse OpenJ9

Automatically and intelligently monitor, analyze, and optimize the performance of your virtual machine.

Eclipse Temurin (Adoptium) logo

Eclipse Temurin (Adoptium)

Automatically and intelligently monitor, analyze, and optimize the performance of your virtual machine.

Ember.js logo

Ember.js

Open-source JavaScript web framework, based on the Model–view–viewmodel pattern.

etcd for OpenShift logo

etcd for OpenShift

Get deep insights into your OpenShift control plane using etcd metrics.

Express logo

Express

Fast, unopinionated, minimalist web framework for Node.js.

Fedora logo

Fedora

Linux distribution sponsored primarily by Red Hat, a subsidiary of IBM.

Garden-RunC logo

Garden-RunC

Automated distributed tracing and metrics for microservices running in garden runc containers in Cloud Foundry.

GlassFish logo

GlassFish

Automatically and intelligently monitor, analyze, and optimize your application server and all applications deployed anywhere in your stack.

GraalVM Native Image logo

GraalVM Native Image

Intelligently monitor and optimize the performance of your native Java apps.

gRPC logo

gRPC

Open source remote procedure call (RPC) system.

Are you looking for something different?

We have hundreds of apps, extensions, and other technologies to customize your environment

Extend your knowledge

Discover distributed tracing

Discover distributed tracing

Observe requests across distributed systems and microservices and generate high-quality data for analysis.
Read more
Discover OpenTelemetry

Discover OpenTelemetry

Ingest and chart custom OpenTelemetry traces and metrics, set alerts, and analyze them with traces, logs, and diagnostics data.
Read more
Profile and optimize

Profile and optimize

Go beyond automated problem detection to manually detect problems with the analysis toolset for profiling and optimization.
Read more