


















Skip to technology filters Skip to main content
Dynatrace Hub

Extend the platform,
empower your team.

Popular searches:
Home hero bg
Error InspectorError Inspector
Error Inspector

Error Inspector

Discover, triage, and manage errors across all your frontends.

App
Free trialDocumentation
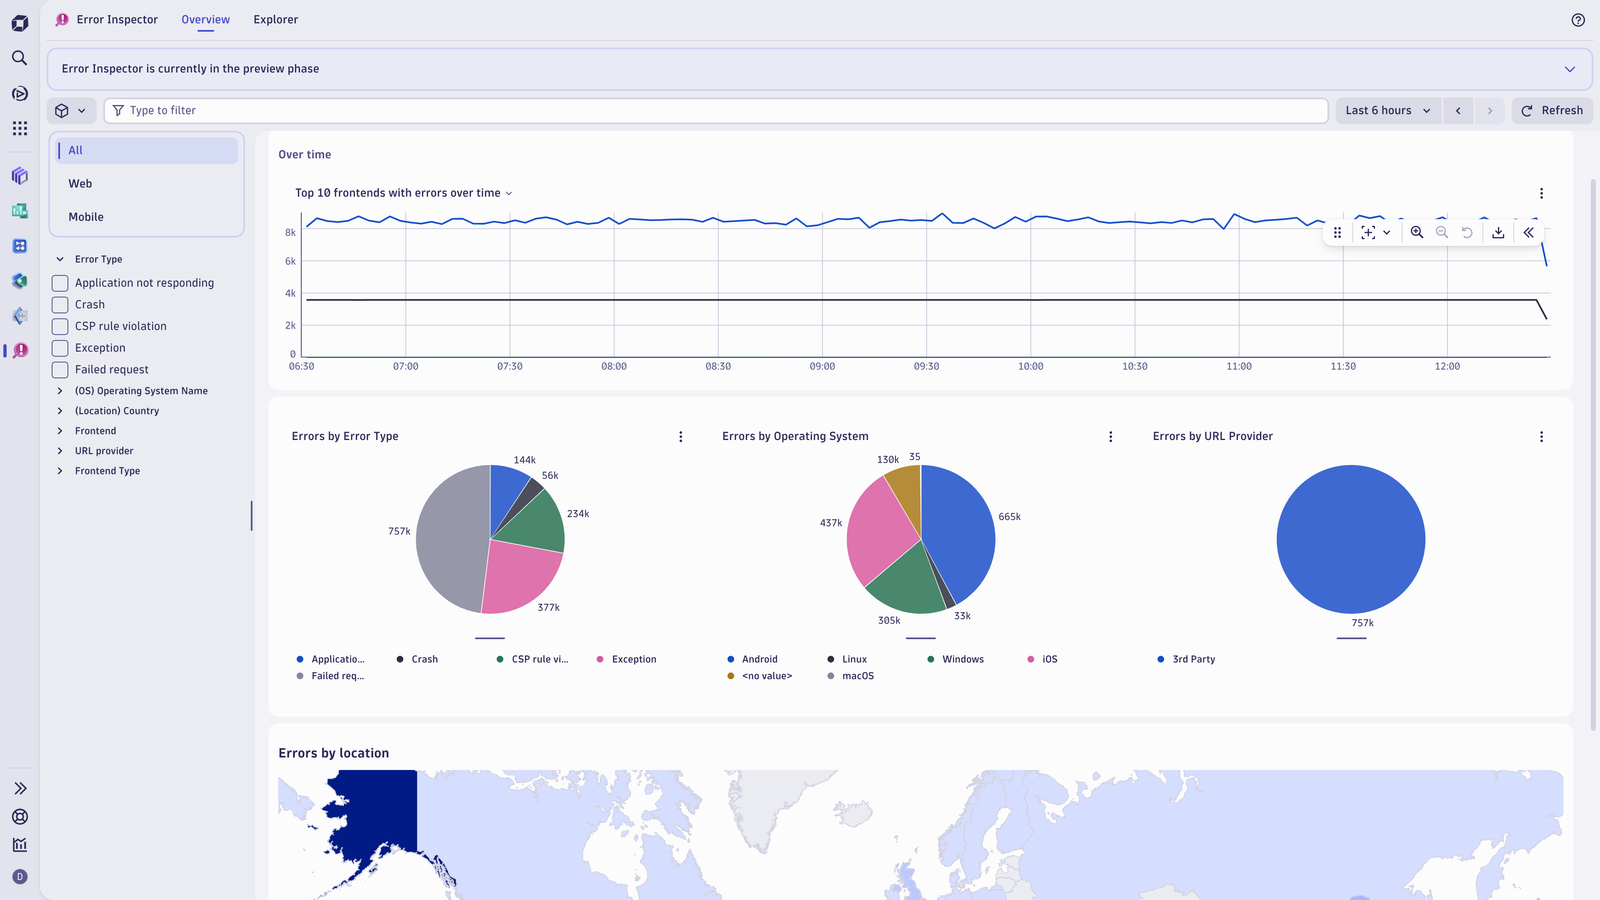
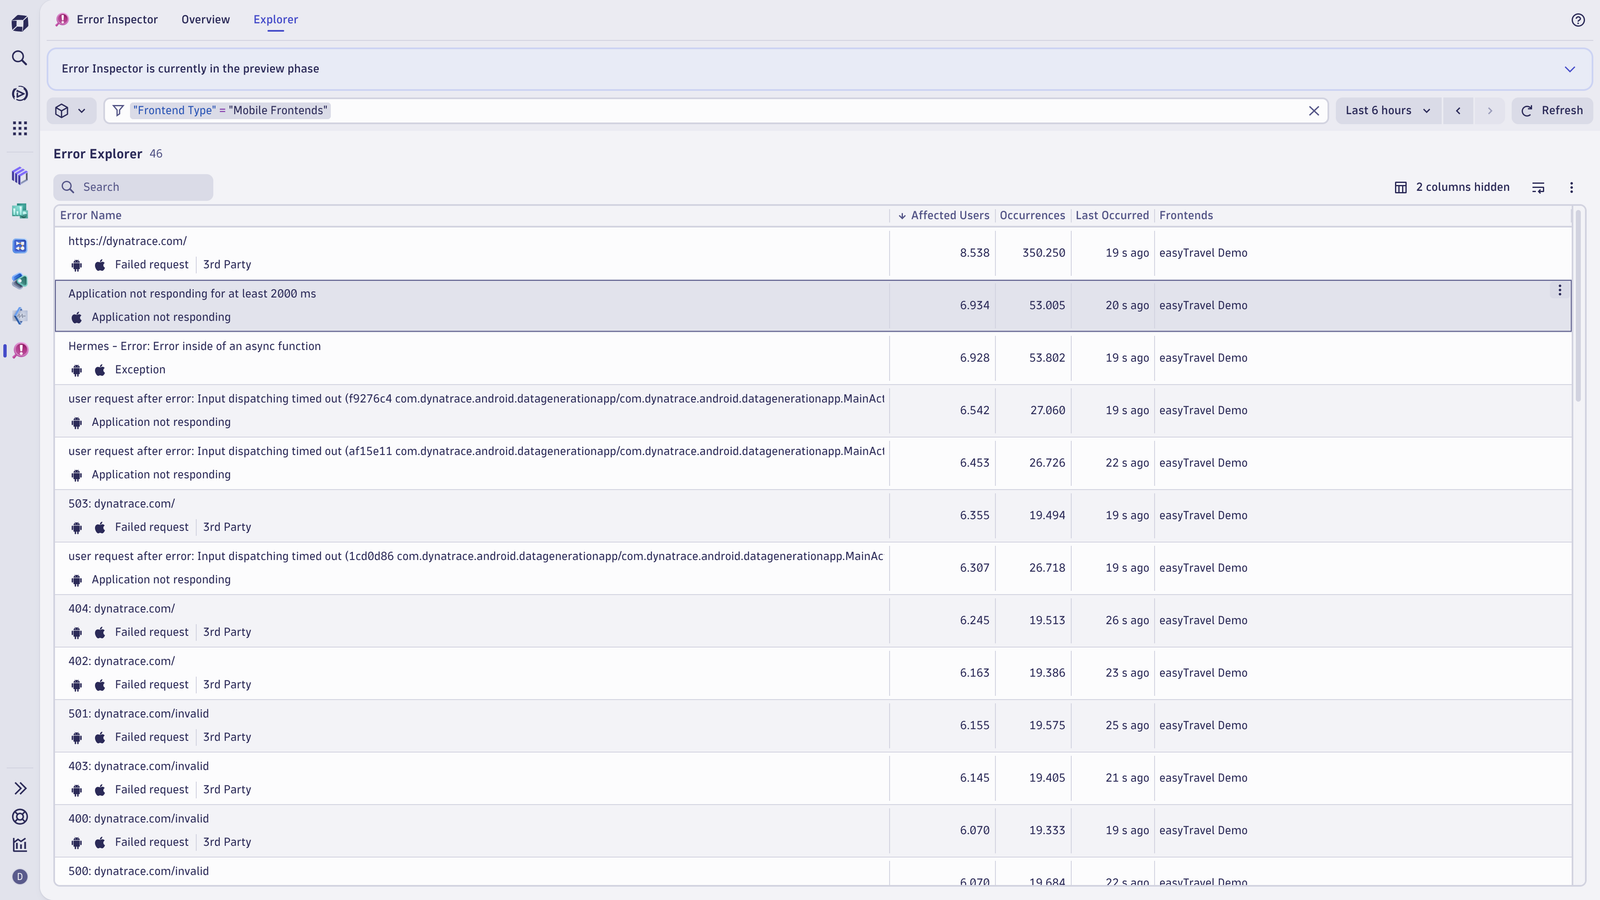
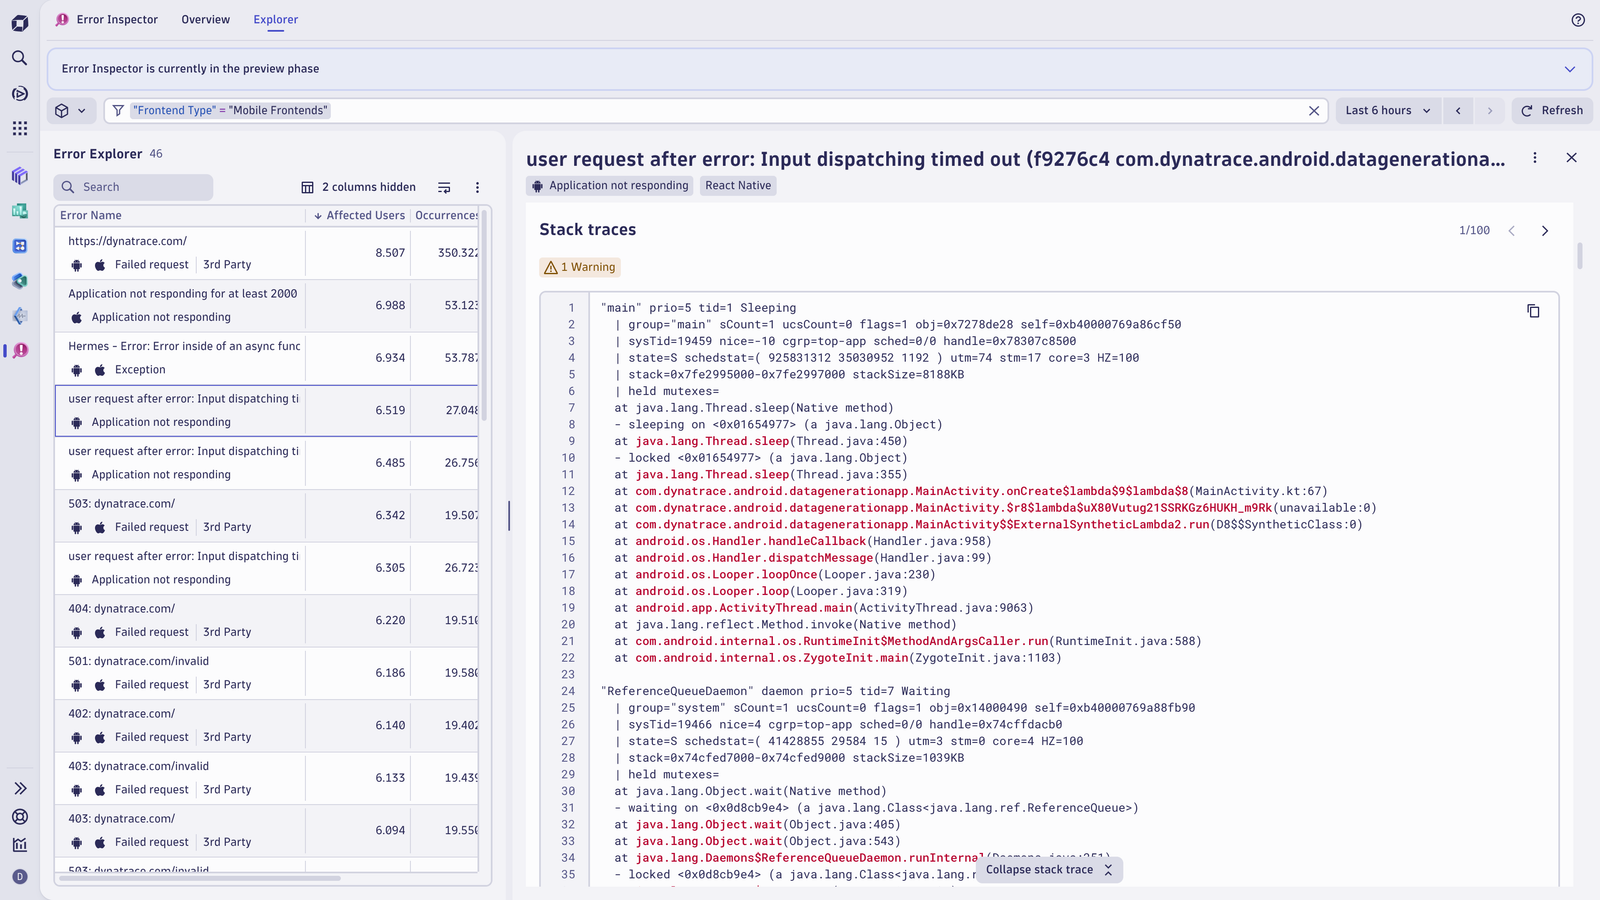
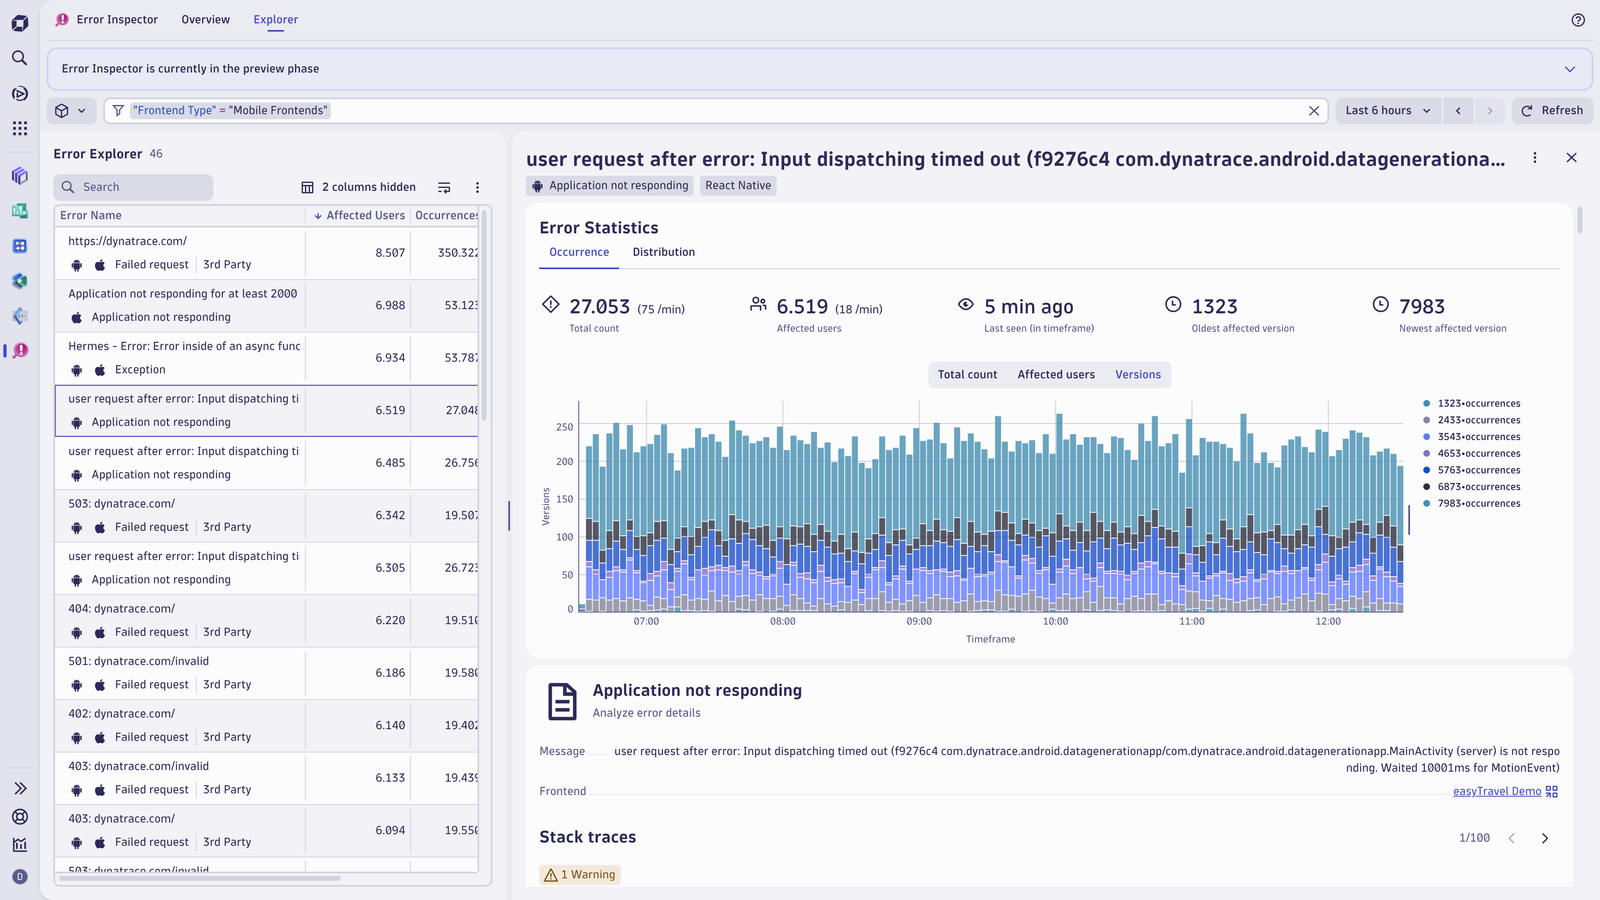
Overview of errors at-a-glance across all your monitored frontends to see which OS, user demographic or error type needs immediate attention.Errors are grouped and can be filtered based on type, frontend, OS, etc. Filtered analyses can be with colleagues who have access using the URL.No more guessing as you receive deobfuscated error messages for frameworks like ReactNative. Catch ANRs, identify the root cause, and deploy a fix.Select an error group (occurrence trends, distribution patterns across devices, versions and platforms, or users affected) to prioritize quickly.Extend contextual insights into the user session to understand exactly what led to the error.
  • Product information
  • Release notes

Overview

Error Inspector is designed with developers and observability teams in mind to identify, track, and investigate front-end errors in both web and mobile (native or cross-platform) applications. With comprehensive insights into errors affecting users, Error Inspector allows teams to enhance application reliability and performance by automatically prioritizing the most impactful errors across all apps or filter down to the ones you are responsible for. With built-in share functionality, track error workflow, inform cross team members to ensure accountability.

Use cases

  • Understand impact: Assess the impact of errors and their root causes across all your monitored front-end applications.
  • Prioritize errors: Group and prioritize errors with deeper context, sorted by affected users and frequency of occurrence.
  • Identify root cause: Irrespective of whether they are exceptions, ANRs, request errors or CSP violations.
  • Maintain end-to-end context: For all errors tie in the exact user interactions that led up to the error. For request errors examine the trace exception with a single click.
  • Track lifecycle: Manage the lifecycle of errors by creating JIRA tickets directly from Error Inspector.

Get started

As soon as web frontends are automatically detected using OneAgent (or via agentless monitoring), error data is sent to the Dynatrace platform. Users must opt into and allow the new RUM experience either in Classic or Experience Vitals.

Details

Error Inspector is a powerful tool built to help developers and observability teams uncover and investigate frontend errors from both web and mobile applications. Practitioners can visualize error counts and trends over time, thereby breaking down issues by dimensions such as frontend, browser type, operating system, or URL provider. The app supports interactive actions like exporting queries, pinning charts to dashboards, or opening analyses in notebooks. Errors are aggregated and ranked by impact (for example, user count), with filtering capabilities to isolate specific error types or contexts. Individual errors offer rich diagnostic detail, including stack traces (with source map support), session context, and integration options like JIRA ticket creation, and links into Session Details and distributed traces for deeper investigation. By offering both high-level visibility and fine-grained error analysis, Error Inspector empowers teams to proactively resolve frontend issues and drive better user experiences.

Dynatrace
Documentation
By Dynatrace
Dynatrace support center
Subscribe to new releases
Copy to clipboard

Related to Error Inspector

Experience Vitals logo

Experience Vitals

Optimize UX with core vitals, frontend error tracking, and end-to-end visibility.

Full version history

ReleaseDate

Full version history

📝 Release Notes

Version: 1.8.0
Release Date: 01/07/2026


🚀 New Features & Enhancements

  • Added Investigation Mode for Problem analysis, making it easier to explore and understand issues.
  • Introduced data-aware testing capabilities for supported workflows, improving analysis accuracy and relevance.
  • Added data-aware timeframe discovery to help users work with the most relevant time ranges automatically.
  • Enabled timeframe support across frontend intents for a more consistent investigation experience.
  • Added Error ID support in User & Sessions, allowing users to quickly identify and navigate to specific errors.
  • Improved handling of application variables by introducing automatic reset behavior for cleaner and more predictable executions.

🛠️ Fixes & Stability Improvements

  • Fixed issues where filters were not consistently preserved across navigation flows.
  • Resolved timezone-related inconsistencies.
  • Fixed scenarios where filters could be lost when navigating between views during analysis.
  • Improved overall application stability and reliability.

🎯 Quality Improvements

  • Enhanced reliability and consistency across analysis workflows.
  • Improved navigation and user interactions throughout the application.
  • Continued focus on stability, performance, and overall user experience.

✅ This release introduces new investigation capabilities, improves error analysis workflows, enhances data-aware experiences, and delivers several stability and usability improvements across the application.

Full version history

📝 Release Notes

Version: 1.6.0
Release Date: 27 April 2026


✨ New Features & Improvements

  • Improved filtering capabilities

    • Added a new filter by Error ID, making it easier to find and investigate specific issues.
    • Expanded event category support in the problem lookup filter to support all problem types.
  • Better navigation & Troubleshooting

    • Contextual access to Distributed Tracing when available, enabling faster root‑cause analysis.
    • Replaced raw Trace IDs with a clear “View Traces” action for a more intuitive trace exploration experience.
  • User Interface & Usability Improvements

    • Cleaner and more consistent layouts across detail pages.
    • Improved page selector behavior and responsiveness across platforms.

Full version history

📝 Release Notes

Version: 1.0.0 Release Date: 09/01/2026

Changelog


Features

  • Enabled segmentation filter in production.
  • Displayed browsers and versions in the distribution section.
  • Included the error type into the search in the explorer table.

Fixes

  • Resolved an issue where removing filters left empty space in the filter field.
  • Ensured the Error Details panel auto-closes when no error data is available.
Dynatrace Hub
Hub HomeGet data into DynatraceBuild your own app
Dynatrace Intelligence - Agentic Operations SystemThe Dynatrace Agentic AI ecosystem
All (914)Log Management and AnalyticsKubernetesAI and LLM ObservabilityInfrastructure ObservabilitySoftware DeliveryApplication ObservabilityApplication SecurityBusiness Observability
Filter
Type
Built and maintained by
Deployment model
SaaS
  • SaaS
  • Managed
Partner FinderBecome a partnerDynatrace Developer

Digital Experience

Ensure that all your applications are available, functional, fast, and efficient across every channel, from mobile and web to IoT and APIs.

Real user monitoring

Analyze and manage real user monitoring (RUM) data of web, mobile, and custom applications.

See more (1)
Experience Vitals logo

Experience Vitals

Optimize UX with core vitals, frontend error tracking, and end-to-end visibility.

Error Inspector logo

Error Inspector

Discover, triage, and manage errors across all your frontends.

Web logo

Web

Analyze and manage real user monitoring (RUM) data of Web applications.

Mobile logo

Mobile

Analyze real user monitoring data of mobile apps in context with the backend.

Session Replay Classic logo

Session Replay Classic

Fix bugs and simplify complex issues with visual recordings of user sessions.

Session Segmentation logo

Session Segmentation

View and analyze the Real User Monitoring (RUM) sessions from all applications.

Synthetic monitoring

Synthetic logo

Synthetic

Monitor your application's health around the world and around the clock.

Credential Vault logo

Credential Vault

Securely store credentials for your synthetic monitors and extensions 2.0.

More resources

Android Webkit logo

Android Webkit

Provides tools for browsing the web.

Apple Safari logo

Apple Safari

Graphical web browser developed by Apple, based on the WebKit engine.

Flutter logo

Flutter

Monitor mobile applications built with Flutter on iOS or Android.

Google Chrome logo

Google Chrome

Cross-platform web browser developed by Google.

iOS Safari logo

iOS Safari

Graphical web browser developed by Apple, based on the WebKit engine.

Microsoft Edge logo

Microsoft Edge

Real user monitoring - visibility and monitoring starting on you clients browser (desktop, tablet, mobile).

Microsoft Internet Explorer logo

Microsoft Internet Explorer

Series of graphical web browsers.

Mozilla Firefox logo

Mozilla Firefox

Free, open source web browser that uses the Gecko layout engine.

Opera logo

Opera

Freeware web browser for Microsoft Windows, Android, iOS, macOS, and Linux operating systems.

React Native logo

React Native

Monitor mobile applications built with React Native running on iOS or Android.

Users & Sessions logo

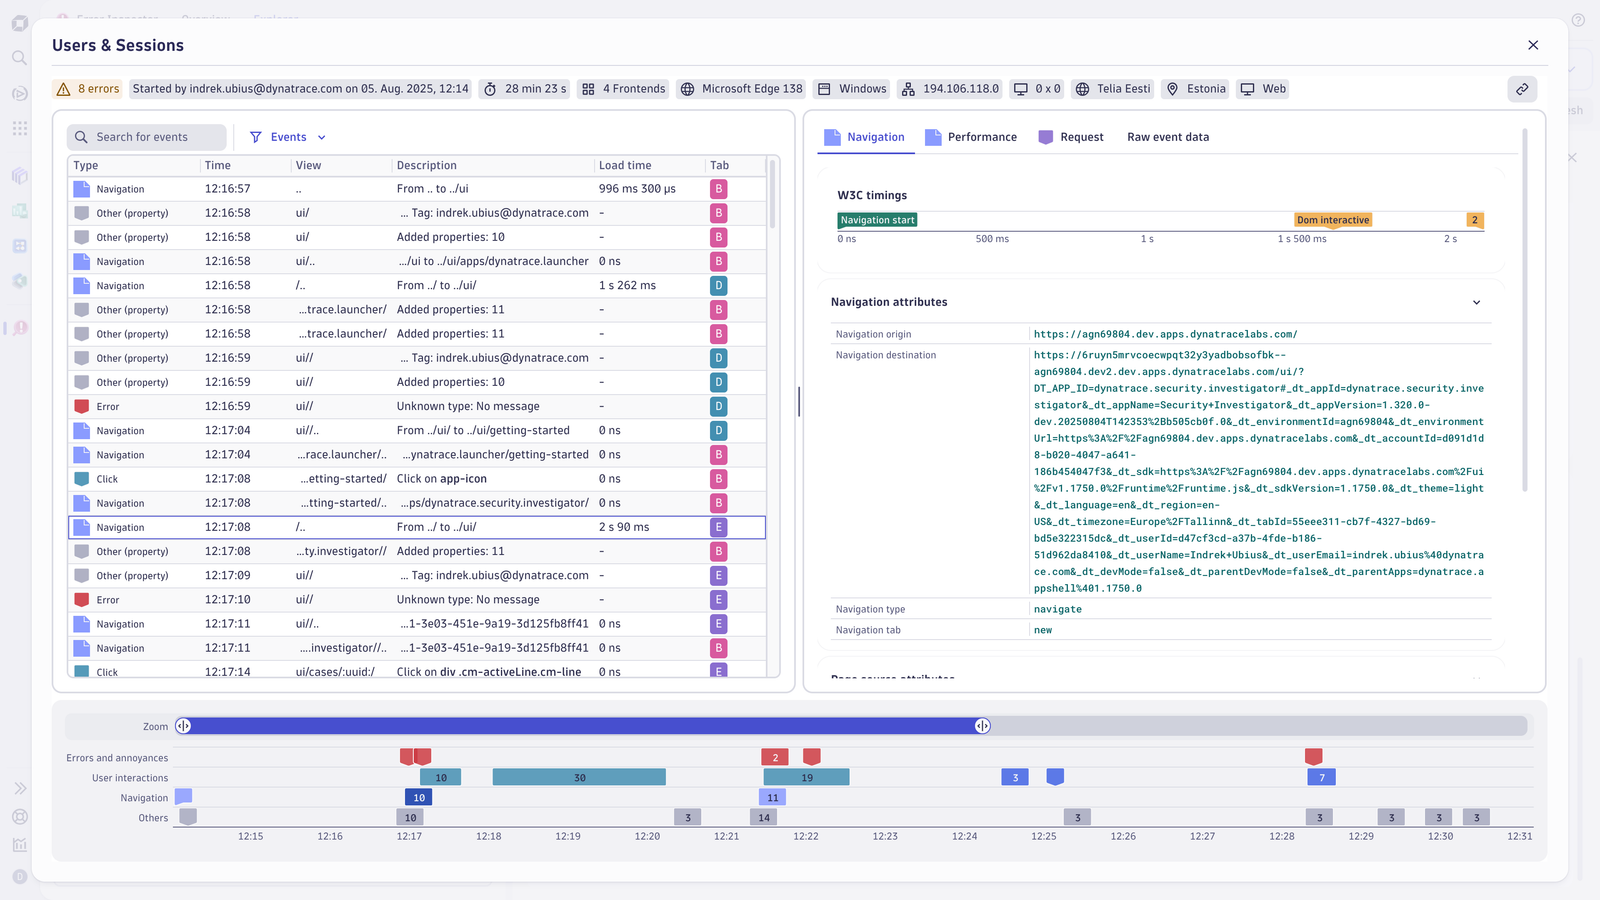
Users & Sessions

Discover how users and cohorts with common characteristics experience your app.

Xamarin logo

Xamarin

Monitor mobile applications built with Microsofts's popular Xamarin platform running on iOS or Android.

Xcode logo

Xcode

Environment containing a suite for developing software for macOS, iOS, iPadOS, watchOS, and tvOS.

Are you looking for something different?

We have hundreds of apps, extensions, and other technologies to customize your environment

Support

Crash-free, 5-star mobile apps

Crash-free, 5-star mobile apps

Learn to leverage mobile analytics to fix app performance issues before they impact your users and revenue.
Learn the top tips

Connect logs for better user journeys

Connect logs for better user journeys

Deepen your insights into real user journeys and user experience pitfalls when you connect logs to session replay.
Read more
Maintain location health the easy way

Maintain location health the easy way

Learn to use private synthetic locations to immediately identify which of your locations need personal attention.
Learn how
An end to Android app crashes

An end to Android app crashes

Dynatrace mobile app monitoring enables immediate, accurate analysis of real user sessions on Android as well as iOS.
Read more
Simpler, easier mobile monitoring

Simpler, easier mobile monitoring

Learn how to make our automated, all-in-one approach to monitoring mobile apps work for you.
Read how
Prioritize optimizations with AI help

Prioritize optimizations with AI help

Get more value from Dynatrace, with AI support to identify user experience problems, root causes, and remedies.
Learn more