




















Skip to technology filters Skip to main content
Dynatrace Hub

Extend the platform,
empower your team.

Popular searches:
Home hero bg
Experience VitalsExperience Vitals
Experience Vitals

Experience Vitals

Optimize UX with core vitals, frontend error tracking, and end-to-end visibility.

App
Free trialDocumentation
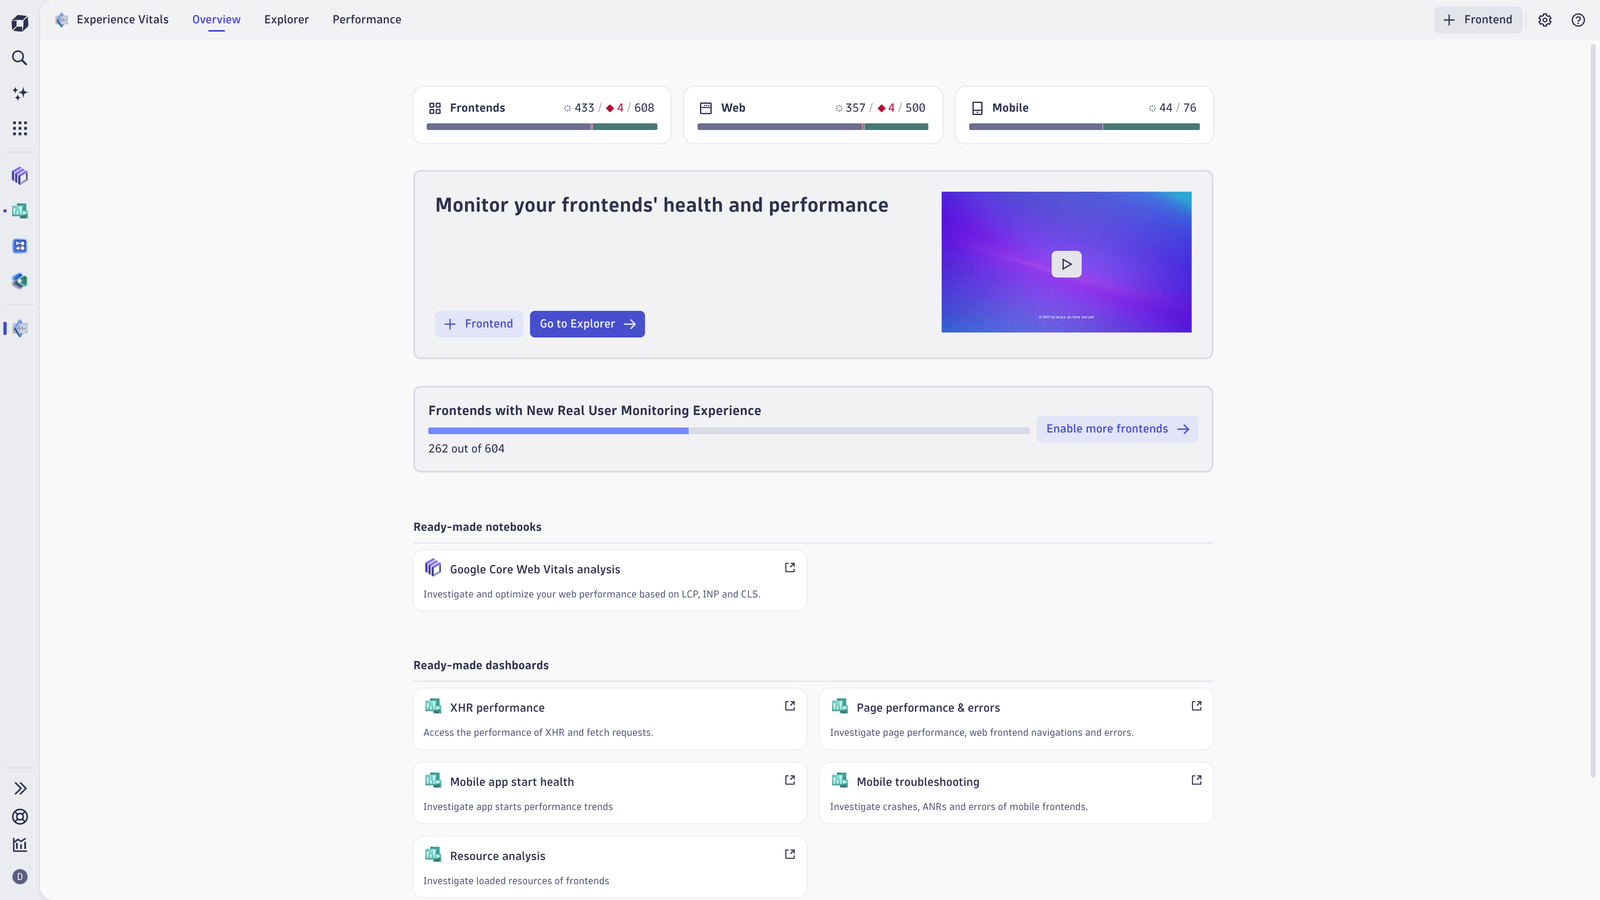
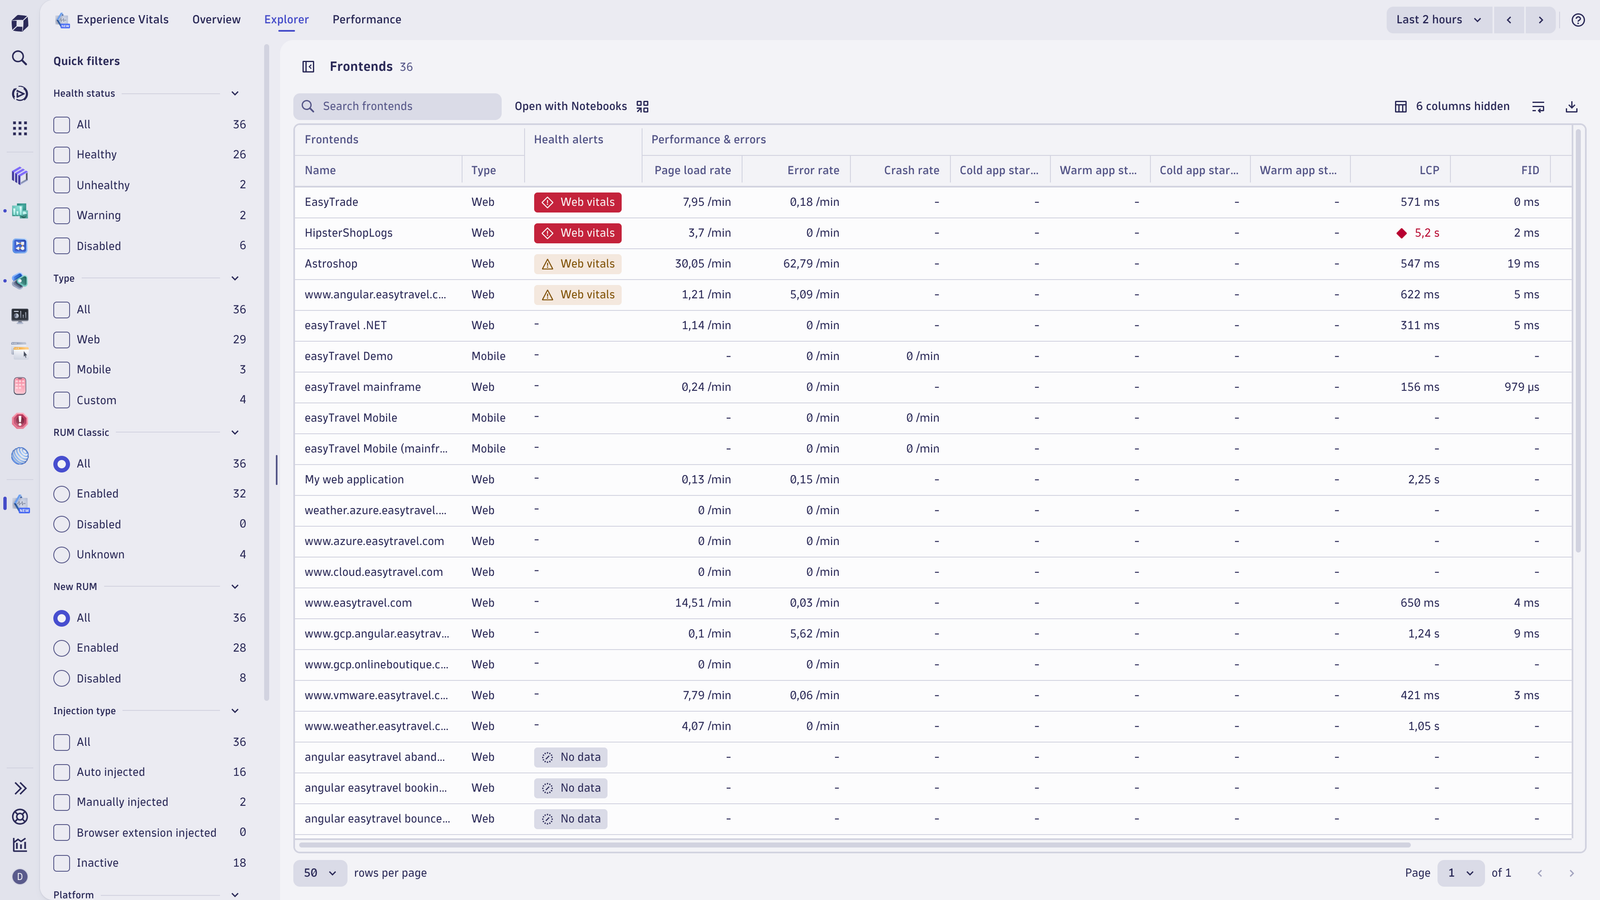
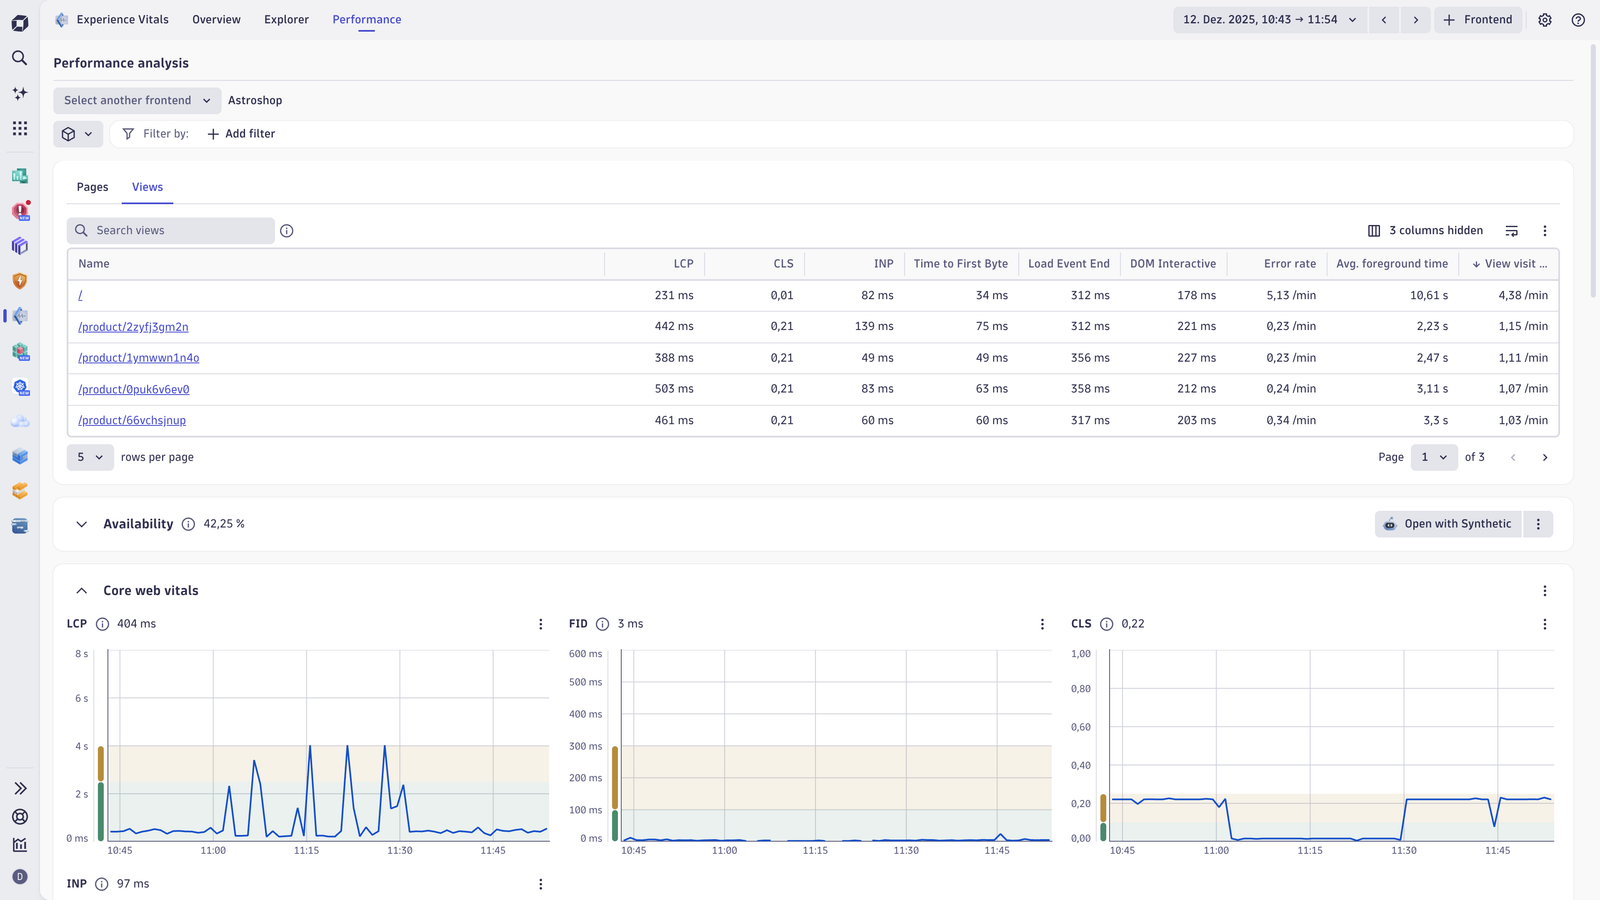
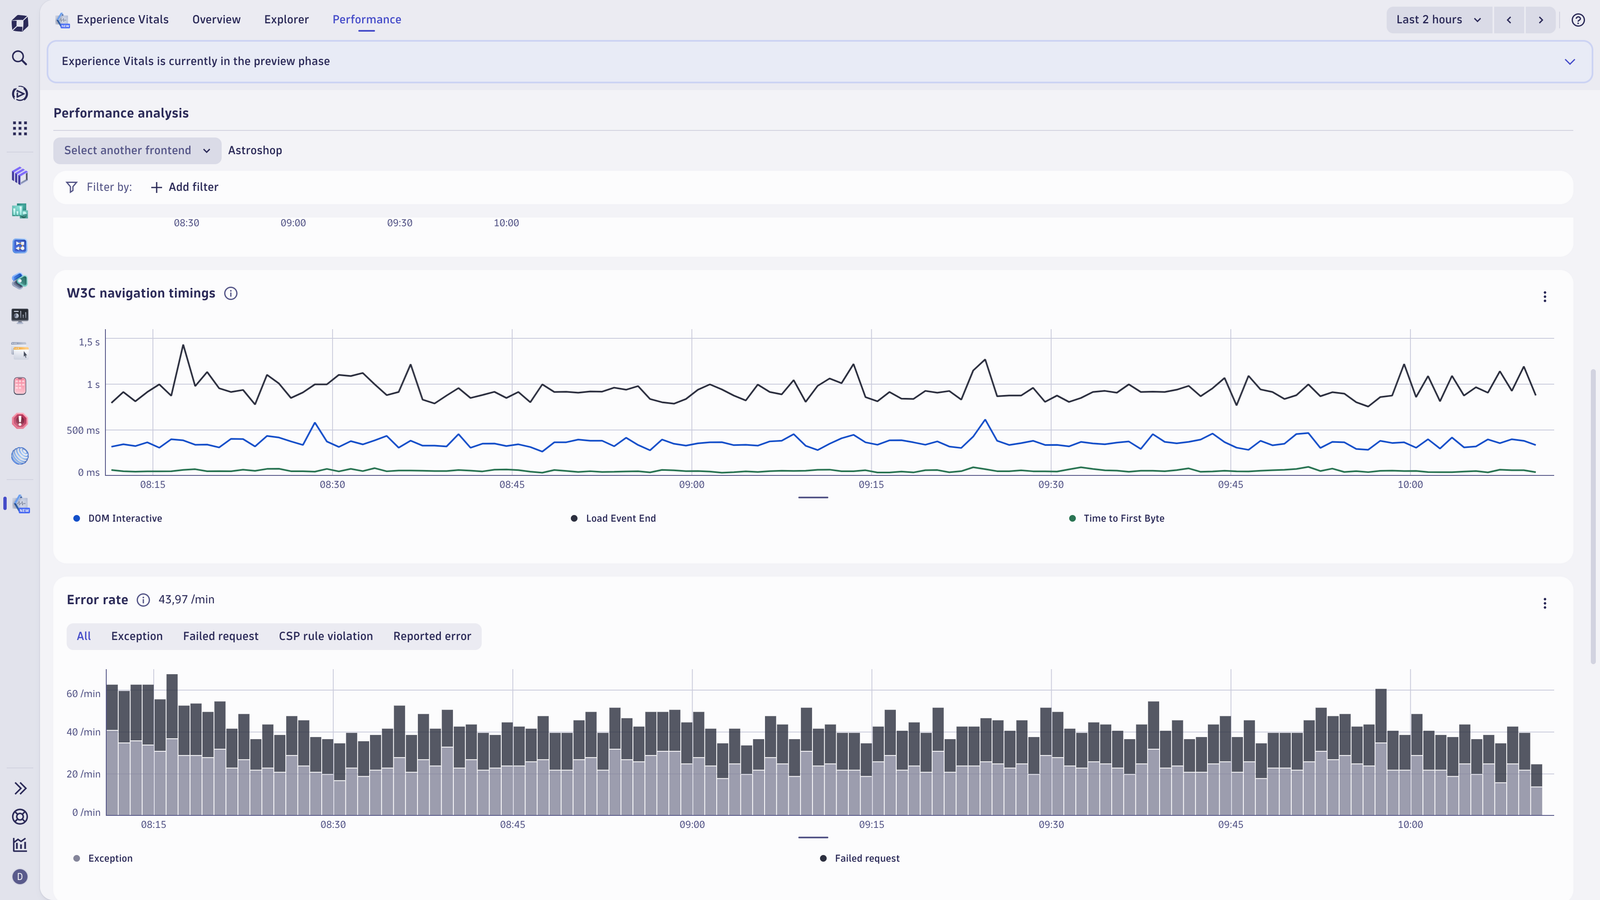
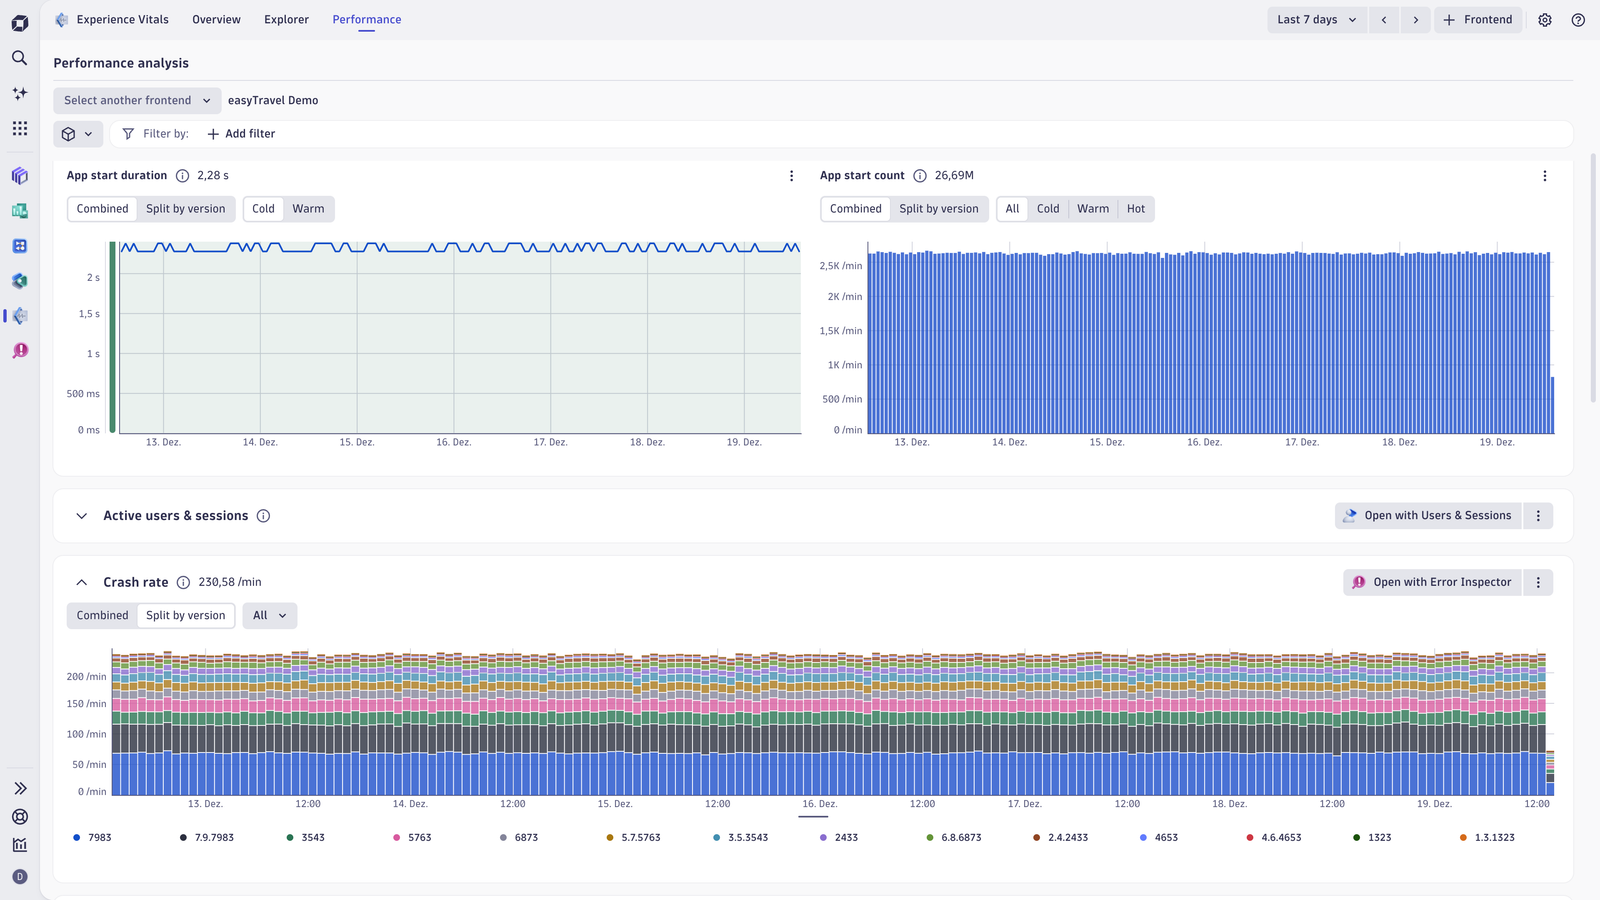
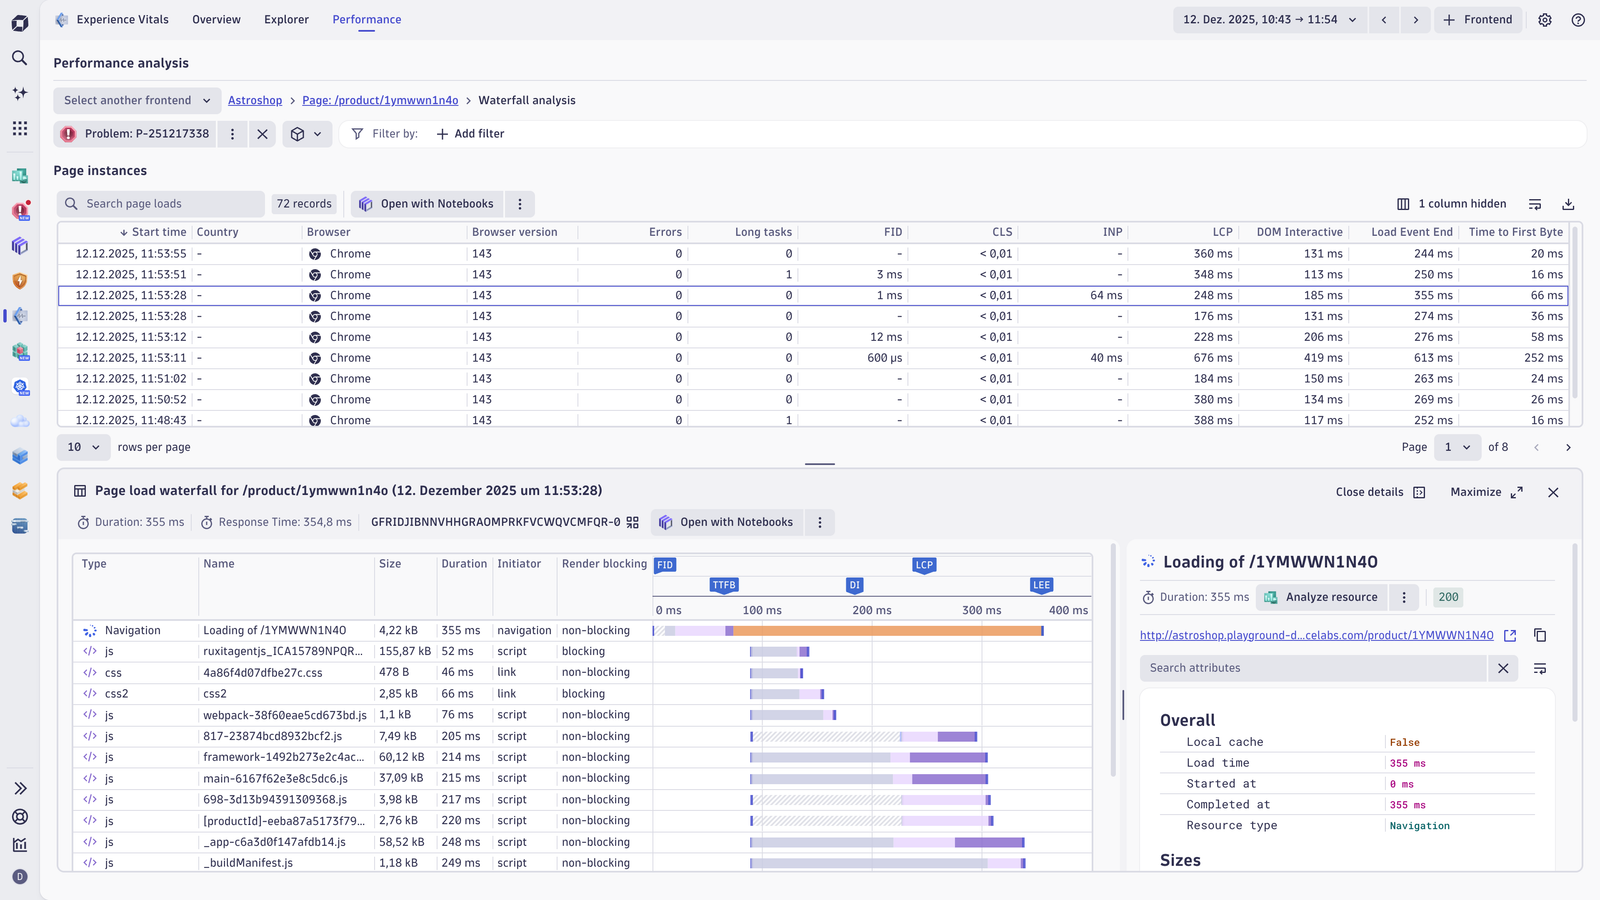
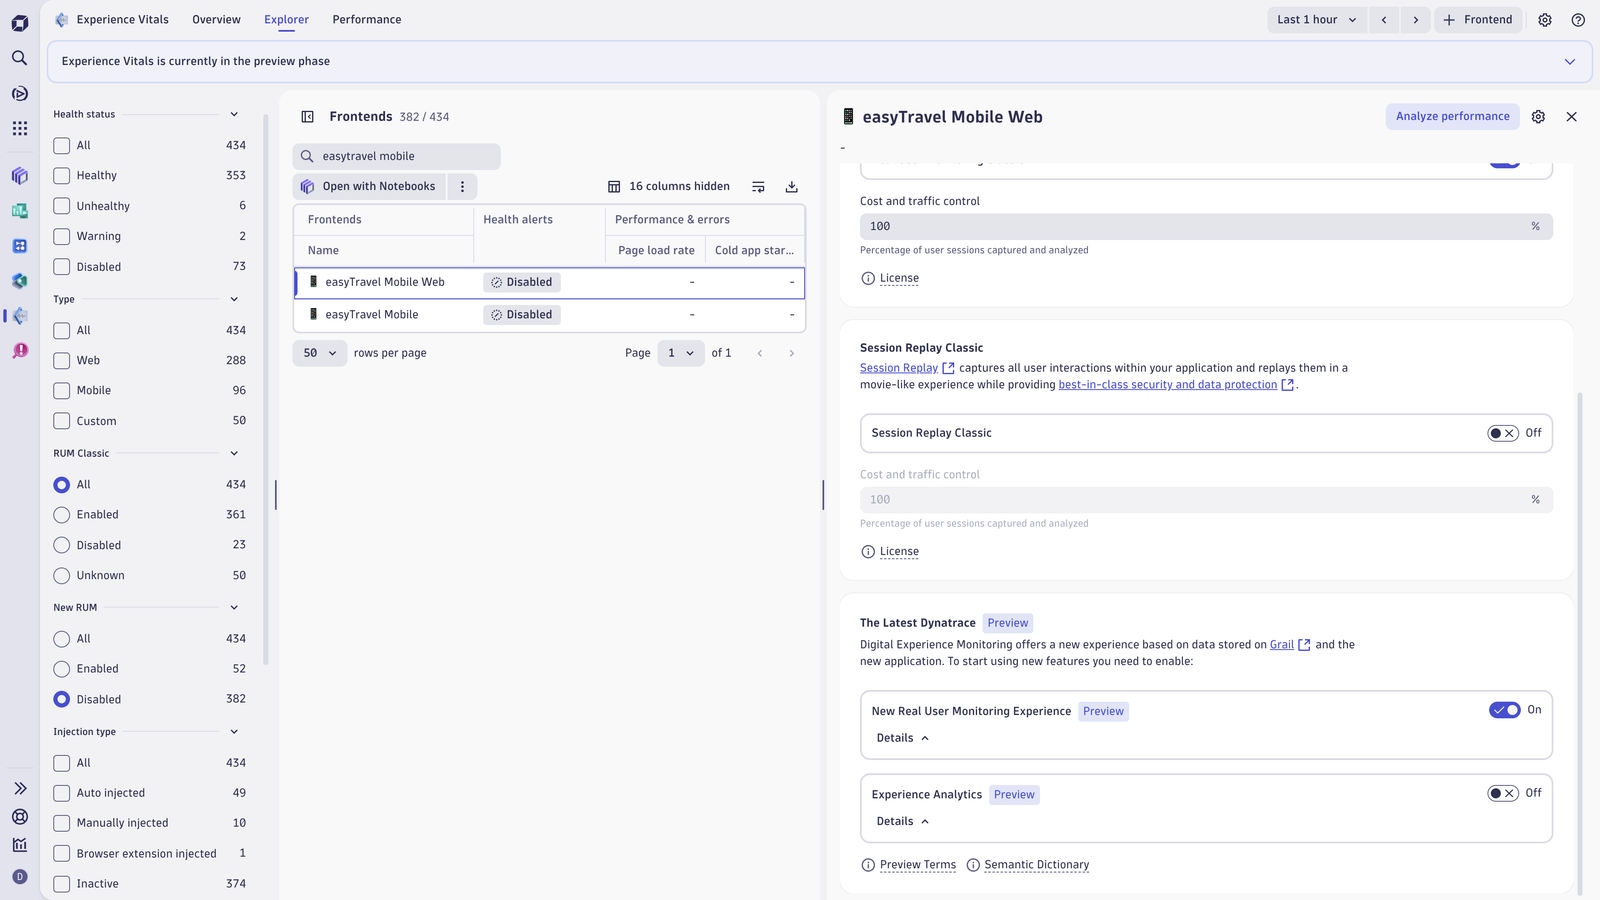
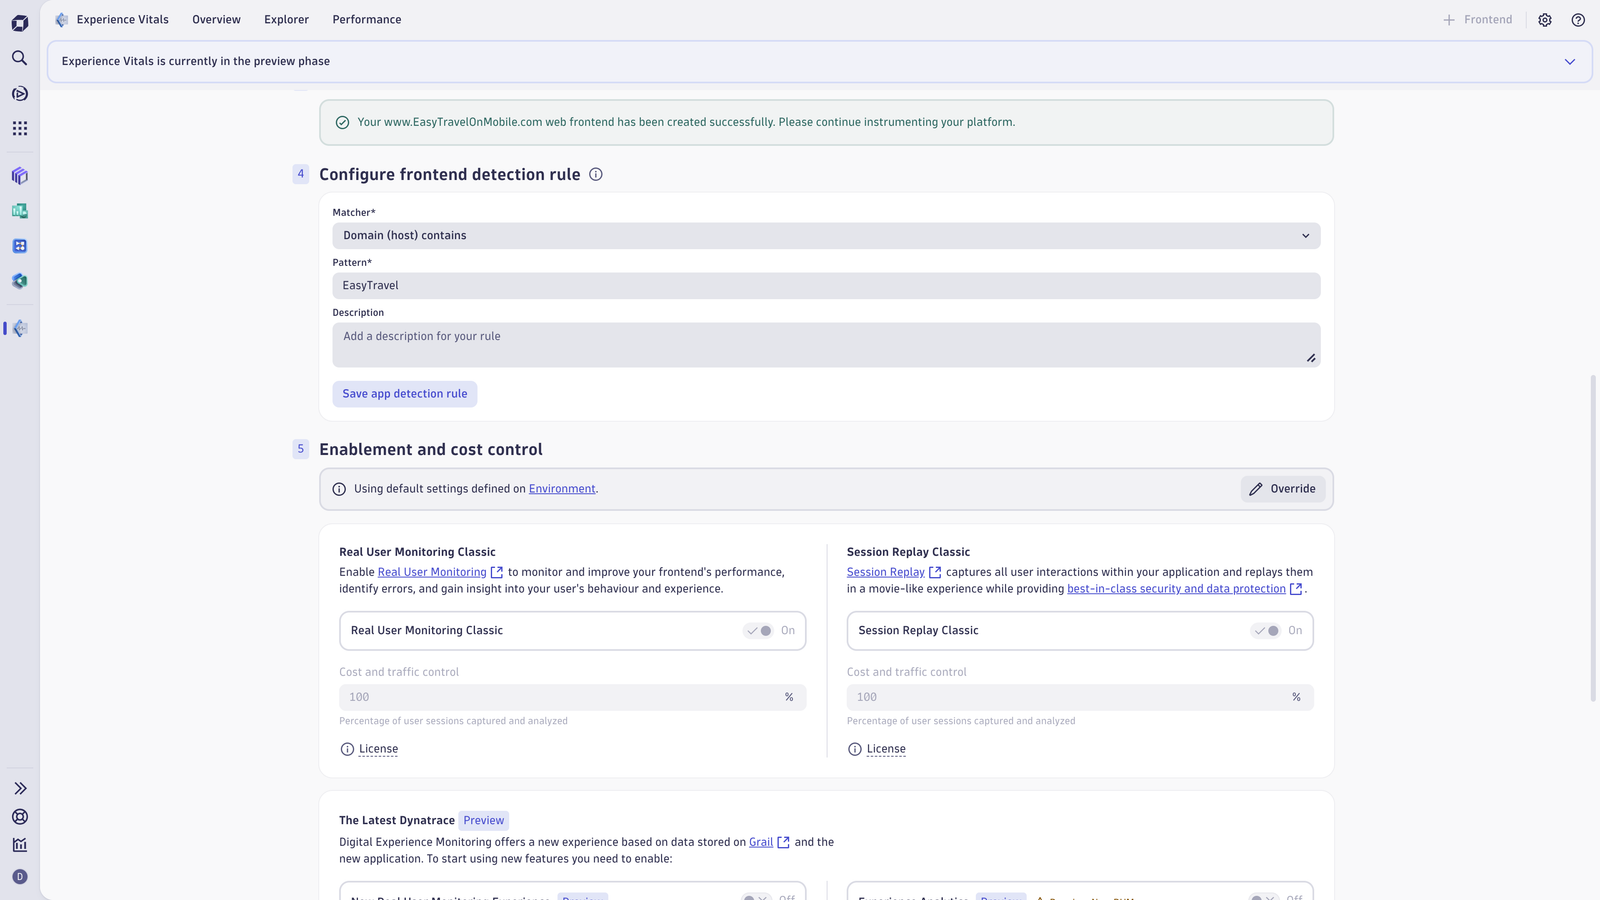
Overview of monitored frontends with trending health alerts. Dive into the app or drill down into resource analysis using Notebooks and Dashboards.Stay aware of performance alerts and their reasons for both web and mobile apps are sorted and filtered based on common dimensions.Identify anomalies and performance degradation down to the page or view level to analyze timings for resources, critical path analyses, and cachingPinpoint where delays occur using W3C timings and, if necessary, the degradation of performance attributes leading to errors.Understand mobile app degradation based on mobile specific metrics such as hot and cold starts or crashes.Identify bottlenecks, optimize page performance, and improve user experience with waterfall charts linked to backend traces.Identify frontends that aren't monitored and activate them in a few clicks. Start collecting performance data within minutes.Easily create a new frontend on the fly to collect telemetry data from real users.
  • Product information
  • Release notes

Overview

Experience Vitals is your frontend watchtower. SREs, developer operations, and developers can assess current and historic health data based on DEM-specific metrics such as core vitals on both web and mobile. In addition, practitioners can dive deeper into the performance analysis of pages, views, and resources to troubleshoot related issues or optimize performance.

Use cases

  • Performance analysis and optimization
  • Health monitoring using core vital metrics
  • Availability monitoring
  • Initial setup of frontend monitoring
  • Configuration changes of individual frontends

Get started

If you're new to Dynatrace RUM, start monitoring a frontend immediately by setting up a new frontend. If you're already monitoring frontends on Dynatrace Classic, turn on RUM on the latest Dynatrace for frontends that you want to monitor within Experience Vitals.

Details

The Experience Vitals app serves as the entry point for frontend health monitoring within Dynatrace’s new RUM experience. It showcases key performance indicators like Core Web Vitals on web and app start durations on mobile platforms with sessions and availability context. You can get an overview of monitored frontends categorized by health status (Healthy, Warning, Unhealthy, or Disabled), and apply filters such as browser, OS, or country. The Explorer view provides detailed insights with time-based selection, sampling information, and notebook access for deeper analysis. Selecting a specific frontend reveals comprehensive performance data, including metrics like LCP, CLS, INP, error rates, app start counts, and crash rates. Health states are automatically computed using standardized thresholds (75th percentile values) for both web and mobile frontends. Identify bottlenecks, optimize page performance, and improve user experience with waterfall charts linked to backend traces.

Compatibility information

RUM on Grail enabled for your frontends

Dynatrace
Documentation
By Dynatrace
Dynatrace support center
Subscribe to new releases
Copy to clipboard

Full version history

ReleaseDate

Full version history

1.3.3

Patch Changes

  • Add missing scope storage:files:read for segments selector
  • Update Ready-made documents
    • Frontend resource analysis improved loading with auto-sampling
    • Digital Experience retain and query usage

Full version history

1.3.2

Minor Changes

New Feature

  • Add user actions on frontend level
  • Add frontend-backend linking setting
  • Add preview alert metric feature for health alerts
  • frontend.name is shown as setting - in read-only mode

User actions

  • Add User action count and duration for frontend table and in frontend summary
  • Add User action problem flow

Frontend Overview

  • "RUM disabled" status of Monitoring Status is now split up into "RUM disabled" and "RUM Classic disabled"

Settings

  • Frontend detection: add utility to check URLs for matching rules
  • Enablement: Show info if RUM cannot be enabled when using code snippet with automatic injection
  • Add frontend-backend linking settings for mobile and web
  • frontend.name is set to read-only with SaaS version 339
  • Add preview alert metric feature for health alerts

Creation flow & Instrumentation

  • Update screens to use correct code snippet syntax highlighting

Ready-mades

  • Update "Digital Experience retain and query usage" content

Waterfall

  • Add vertical metric markers for waterfall instance panel

Other

  • Add zebra stripes to all datatables and remove grouped headers

Patch Changes

Frontend Overview

  • Platform quickfilter includes all frontends without a platform when selecting "Unknown"

Settings

  • Health Alert:
    • Alert status shows correct statuses
    • Improve validation
    • Improve error highlighting for step title in advanced configuration
  • Setting widgets read feature flags properly
  • Settings form keeps state again during resizing of the page
  • Event & Session Properties: Improve field name validation
  • frontend.name: Improve validation error message

Maintenance & Other

  • Fix toast container styling
  • Message improvements
  • Fix incorrect flutter snippet in instrumentation
  • Fix error rate query Notebook & Dashboard intent to persist error type filter

Patch Changes

  • Fix incorrect schema version of custom-rum-javascript-version and rum-javascript-update
  • Creation flow frontend.name uniquness check works again correctly

Full version history

1.2.2

Patch Changes

  • Fix saving issues in Enablement and Cost Control Settings

Full version history

1.2.0

Minor Changes

New Features

  • Show active users & sessions for pages & views level
  • Add Synthetic browser monitor linking setting
  • Expose native settings widgets for settings app
  • Filter out deleted application MEs

Health alerts

  • Persist entered values of analyzer during changing of the algorithm
  • Added nominal user support to the actors list
  • Add health alert dashboard link for execution statuses filtered on the selected health alert
  • Add user action duration to alert config (Problem flow still missing)

Settings

  • Allow resetting settings to default if there is no parent scope
  • Add performance warning for in XHR Exclusion Settings if rule contains .\*
  • Expose native settings widgets for most relevant settings
  • Add New Session Replay toggle in Enablement and Cost control settings for preview customers

Mobile

  • Add SR to mobile creation flow & instrumentation snippets, if Session Replay is active

General

  • Persist the opened resource in the waterfall via path params.
  • Add separate waterfall intent and improvements
  • Filter out synthetic events due to missing user events enrichtments
  • Remove deprecated view-problem-affected-frontends intent
  • Adapt documentation links to new documentation
  • Rename add Frontend button
  • Filter out deleted application MEs
  • Updated the required permissions for accessing the availability section and availability settings. Added a clearer tooltip explaining why monitor cannot be unassigned from frontend
  • Adapt waterfall instance time from client time back to time corrected start time (server time)

Patch Changes

Creation Flow

  • Fix app crash when permission for frontend.name setting is missing

Health alert

  • Fix app crashing when creating a frontend which exceeds alerting limits & improve visualization of errors happening on creating frontends

General

  • Cleanup default column visibility of frontends table
  • Fix infinite reloading due to missing permissions for environment scoped settings schemas
  • Frontend selection lost on navigating to performance tab
  • Fix search params not set correctly
  • Fix Auto-Sampling for event based queries

Full version history

1.1.2

Patch Changes

  • Fix some error when loading settings is not possible due to limited permissions
  • Fix error during saving multi-object settings
  • Fix error during editing health alert settings

Full version history

1.1.1

Minor Changes

New Features

  • Show active users & sessions for pages & views level
  • Add Synthetic browser monitor linking setting
  • Active Users & Sessions
    • Add columns for active users and sessions to pages and views table
    • Add card for users and sessions on pages and views level
    • Health alerts
  • Switch to displaying last execution status for health alerts
  • Improved UI validation for health alert settings

Settings

  • Expose settings widgets for settings app:
    • Enablement and cost control
    • Event and session properties
    • Automatic Injection
    • Manual insertion

Waterfall

  • Add waterfall & page instance sampling information
  • Waterfall instance summary - rename response time & add terminology info to duration

General

  • Application id accepts case-insensitive values
  • Improved search functionality algorithm
  • Update DEM ready-made launchpad
  • Minor renamings

Patch Changes

  • Fix Auto-Sampling for event based queries

Full version history

1.0.7

Patch Changes

  • Fix Auto-Sampling for event based queries

Full version history

1.0.4

Patch Changes

Frontend creation flow

  • Settings override status is correctly shown

Health Alert Settings

  • Warning & error status is correctly calculated & shown

Full version history

1.0.3

Patch Changes

  • Add feature toggle for health alerts configurations
  • Adapt incorrect health alerts status query for successful executions

Full version history

1.0.2

Patch Changes

Ready-mades

  • Updated Digital Experience ready-made launchpad

Settings

  • When switching frontend of another type while having a frontend open and the schema exists on both frontend types, the same setting is opened directly
  • Validation improvements for health alert settings

Waterfall

  • Trace linking does not do unnecessary queries anymore and response size was lowered

General

  • Fixed JS error on older browsers
  • Problem investigation mode can now be started from availability chart
  • Only query frontend display name from MEs, when user doesn't have permissions for reading name settings

Full version history

1.0.1

Patch Changes

Ready-mades

  • Mobile ready-mades now filter frontend correctly

Onboarding

  • Frontend creation flow - settings state is now saved when switching back and forth in the steps

General

  • RUM and RUM classic naming consistent throughout the app

Other & Maintenance

  • Vulnerability fix @remix-run/router:1.23.1 (CVE-2026-22029)

Full version history

1.0.0

Patch Changes

New Features

  • Problems:
    • Frontend problem visualization & investigation mode
    • Frontend anomaly detection configuration
  • Waterfall:
    • add intent to trace of request if available
  • Newly added and improved ready-made Documents:
    • Added: Digital Experience retain and query usage
    • Added: Mobile troubleshooting
    • Added: Mobile app start health
    • Added: Frontend resource analysis
    • Improved: Page performance & errors
    • Improved: XHR performance
  • Segment support
  • frontend.name configuration in onboarding as RUM primary key

Onboarding & Settings

  • Frontends are created with RUM enabled by default

Availability

  • Add empty state with intent buttons to synthetic to create new monitors with already assigned frontend

Waterfall

  • Add trace intent linkinking
  • Add blocking phases to gantt chart
  • Link from waterfall to "Frontend resource analysis" ready-made
  • Add load instance metric annotations
  • Improve resource type detection
  • Improve instance table sorting
  • Fix incorrect timinig calculations

General

  • Show frontend ME id if frontend can't be loaded
  • Add welcome video to welcome page
  • Switch navigation concept back to path params
  • Remove preview labels and banners
  • Settings linking uses schema id instead of item id
  • Show prefix in Event & Session properties modal for more intuitive configuration
  • Add standard intent properties to intents
  • Add standard intent properties to all intents
  • Add linking to Users & Sessions app from active users & session cards
  • Small improvements & maintenance
Dynatrace Hub
Hub HomeGet data into DynatraceBuild your own app
Dynatrace Intelligence - Agentic Operations SystemThe Dynatrace Agentic AI ecosystem
All (914)Log Management and AnalyticsKubernetesAI and LLM ObservabilityInfrastructure ObservabilitySoftware DeliveryApplication ObservabilityApplication SecurityBusiness Observability
Filter
Type
Built and maintained by
Deployment model
SaaS
  • SaaS
  • Managed
Partner FinderBecome a partnerDynatrace Developer

Digital Experience

Ensure that all your applications are available, functional, fast, and efficient across every channel, from mobile and web to IoT and APIs.

Real user monitoring

Analyze and manage real user monitoring (RUM) data of web, mobile, and custom applications.

See more (1)
Experience Vitals logo

Experience Vitals

Optimize UX with core vitals, frontend error tracking, and end-to-end visibility.

Error Inspector logo

Error Inspector

Discover, triage, and manage errors across all your frontends.

Web logo

Web

Analyze and manage real user monitoring (RUM) data of Web applications.

Mobile logo

Mobile

Analyze real user monitoring data of mobile apps in context with the backend.

Session Replay Classic logo

Session Replay Classic

Fix bugs and simplify complex issues with visual recordings of user sessions.

Session Segmentation logo

Session Segmentation

View and analyze the Real User Monitoring (RUM) sessions from all applications.

Synthetic monitoring

Synthetic logo

Synthetic

Monitor your application's health around the world and around the clock.

Credential Vault logo

Credential Vault

Securely store credentials for your synthetic monitors and extensions 2.0.

More resources

Android Webkit logo

Android Webkit

Provides tools for browsing the web.

Apple Safari logo

Apple Safari

Graphical web browser developed by Apple, based on the WebKit engine.

Flutter logo

Flutter

Monitor mobile applications built with Flutter on iOS or Android.

Google Chrome logo

Google Chrome

Cross-platform web browser developed by Google.

iOS Safari logo

iOS Safari

Graphical web browser developed by Apple, based on the WebKit engine.

Microsoft Edge logo

Microsoft Edge

Real user monitoring - visibility and monitoring starting on you clients browser (desktop, tablet, mobile).

Microsoft Internet Explorer logo

Microsoft Internet Explorer

Series of graphical web browsers.

Mozilla Firefox logo

Mozilla Firefox

Free, open source web browser that uses the Gecko layout engine.

Opera logo

Opera

Freeware web browser for Microsoft Windows, Android, iOS, macOS, and Linux operating systems.

React Native logo

React Native

Monitor mobile applications built with React Native running on iOS or Android.

Users & Sessions logo

Users & Sessions

Discover how users and cohorts with common characteristics experience your app.

Xamarin logo

Xamarin

Monitor mobile applications built with Microsofts's popular Xamarin platform running on iOS or Android.

Xcode logo

Xcode

Environment containing a suite for developing software for macOS, iOS, iPadOS, watchOS, and tvOS.

Are you looking for something different?

We have hundreds of apps, extensions, and other technologies to customize your environment

Support

Crash-free, 5-star mobile apps

Crash-free, 5-star mobile apps

Learn to leverage mobile analytics to fix app performance issues before they impact your users and revenue.
Learn the top tips

Connect logs for better user journeys

Connect logs for better user journeys

Deepen your insights into real user journeys and user experience pitfalls when you connect logs to session replay.
Read more
Maintain location health the easy way

Maintain location health the easy way

Learn to use private synthetic locations to immediately identify which of your locations need personal attention.
Learn how
An end to Android app crashes

An end to Android app crashes

Dynatrace mobile app monitoring enables immediate, accurate analysis of real user sessions on Android as well as iOS.
Read more
Simpler, easier mobile monitoring

Simpler, easier mobile monitoring

Learn how to make our automated, all-in-one approach to monitoring mobile apps work for you.
Read how
Prioritize optimizations with AI help

Prioritize optimizations with AI help

Get more value from Dynatrace, with AI support to identify user experience problems, root causes, and remedies.
Learn more