





































































Learn the Dynatrace Query Language
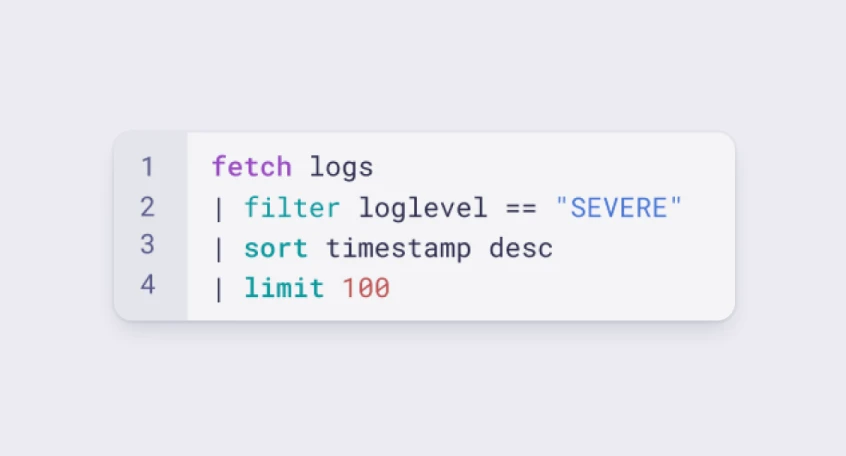
Explore data, discover patterns, anomalies and outliers, and create statistical modeling with DQL, our powerful query language..
Learn DQL
 F5 BIG-IP
Gain insights into the performance of your F5 BIG-IP LTM and DNS solutions.
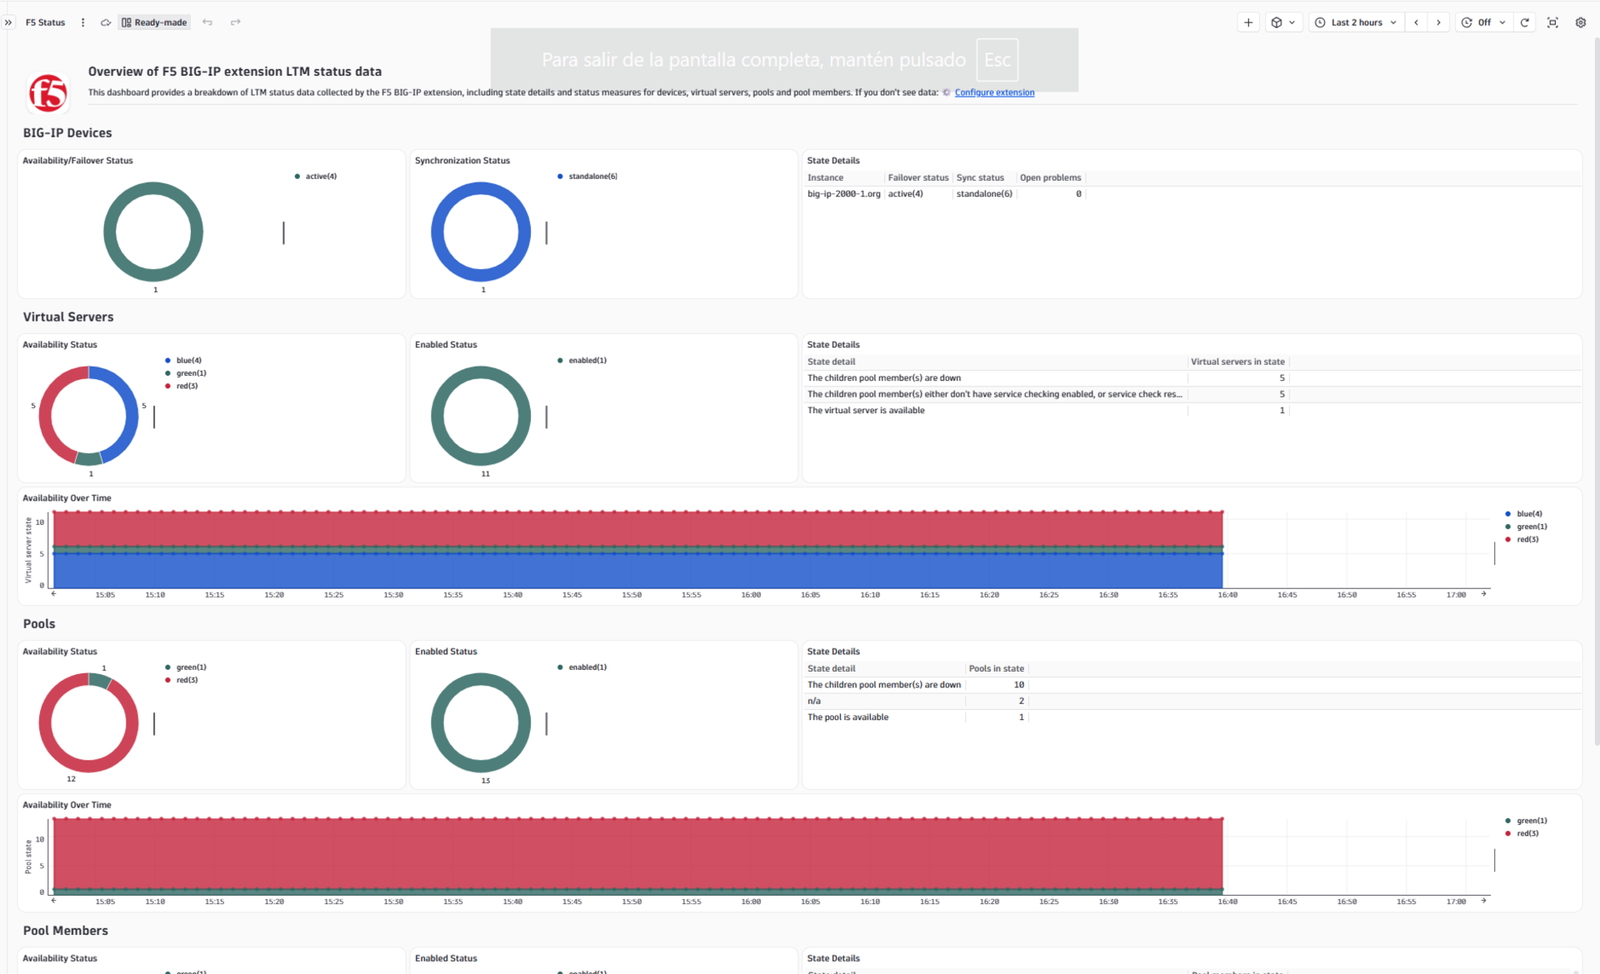
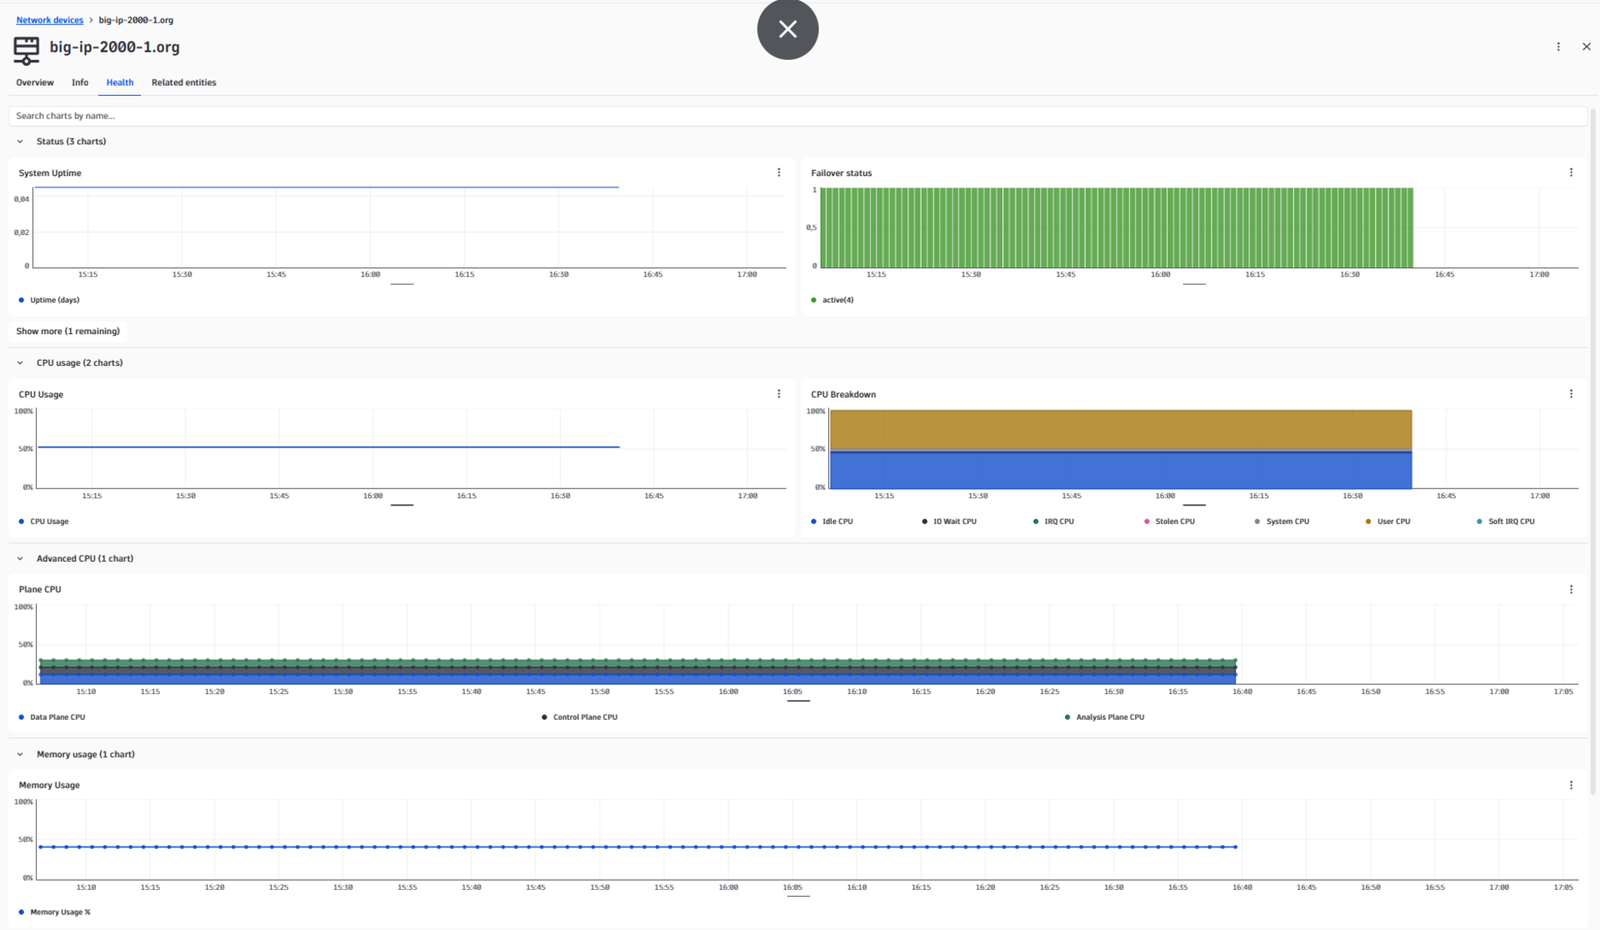
ExtensionThe F5 BIG-IP extension uses SNMP to collect data remotely. Data is collected from your F5 devices every minute and continuously analyzed by the Dynatrace platform. The insights provided go beyond simple charting capabilities cover both the Local Traffic Manager (LTM) and DNS (formerly Global Traffic Manager) modules of the BIG-IP platform. The unified analysis pages offer insight into the health and performance of the platform, while the Dynatrace analytics engine baselines and alerts on the most important indicators. The topology-first approach allows Davis AI to investigate and correlate detected problems between components and identify root causes.
Activate the extension in your environment web-UI using the in-product Hub, provide the necessary device configuration, and you’re all set.
Read more in our SNMP extension documentation.
The extension package contains:
This extension is built on top of the new Extension 2.0 Framework.
More information can be found on the Dynatrace Product News Blog.
Below is a complete list of the feature sets provided in this version. To ensure a good fit for your needs, individual feature sets can be activated and deactivated by your administrator during configuration.
| Metric name | Metric key | Description | Unit |
|---|---|---|---|
| - | com.dynatrace.extension.network_device.sysuptime | - | - |
| - | com.dynatrace.extension.network_device.if.status | - | - |
| - | com.dynatrace.extension.network_device.cpu_usage | - | - |
| - | com.dynatrace.extension.network_device.memory_used | - | - |
| - | com.dynatrace.extension.network_device.memory_total | - | - |
| Metric name | Metric key | Description | Unit |
|---|---|---|---|
| Preferred lb requests | com.dynatrace.extension.f5.bigip.gtm.pool_member.lb_preferred_count | The number of times which the preferred load balance method is used for the specified pool member. | Count |
| Alternate lb requests | com.dynatrace.extension.f5.bigip.gtm.pool_member.lb_alternate_count | The number of times which the preferred load balance method is used for the specified pool member. | Count |
| Fallback lb requests | com.dynatrace.extension.f5.bigip.gtm.pool_member.lb_fallback_count | The number of times which the fallback load balance method is used for the specified pool member. | Count |
| Metric name | Metric key | Description | Unit |
|---|---|---|---|
| - | com.dynatrace.extension.f5.bigip.chassis.fan.state | - | - |
| Fan speed | com.dynatrace.extension.f5.bigip.chassis.fan.speed | The actual speed of the indexed chassis fan on the system. This is only supported for the platform where the actual fan speed data is available.'0' means fan speed is unavailable while the associated chassis status is good. | Unknown |
| - | com.dynatrace.extension.f5.bigip.chassis.ps.state | - | - |
| Chassis temperature | com.dynatrace.extension.f5.bigip.chassis.temperature | The chassis temperature (in Celsius) of the indexed sensor on the system. This is only supported for the platform where the sensor data is available. | Count |
| Metric name | Metric key | Description | Unit |
|---|---|---|---|
| - | com.dynatrace.extension.f5.bigip.sys.uptime | - | - |
| Metric name | Metric key | Description | Unit |
|---|---|---|---|
| Failures | com.dynatrace.extension.f5.bigip.rule.event.stat.failures.count | The number of failures for executing the specified rule. | Count |
| Aborts | com.dynatrace.extension.f5.bigip.rule.event.stat.aborts.count | The number of aborts when executing the specified rule. | Count |
| Executions | com.dynatrace.extension.f5.bigip.rule.event.stat.total.executions.count | The total number of event executions for the specified rule. | Count |
| Metric name | Metric key | Description | Unit |
|---|---|---|---|
| CPU Usage | com.dynatrace.extension.f5.bigip.virtualserver.stat.vs.usage.ratio1m | The percentage of time Virtual Server was busy over the last 1 minute. | Percent |
| Bytes received | com.dynatrace.extension.f5.bigip.virtualserver.stat.client.bytes.in.count | The number of bytes received by the specified virtual server from client-side. | Byte |
| Ephemeral bytes received | com.dynatrace.extension.f5.bigip.virtualserver.stat.ephemeral.bytes.in.count | The number of bytes received ephemeral by the specified virtual server. | Byte |
| Bytes transmitted | com.dynatrace.extension.f5.bigip.virtualserver.stat.client.bytes.out.count | The number of bytes sent to client-side from the specified virtual server. | Byte |
| Ephemeral bytes transmitted | com.dynatrace.extension.f5.bigip.virtualserver.stat.ephemeral.bytes.out.count | The number of bytes transmitted ephemeral from the specified virtual server. | Byte |
| Packets received | com.dynatrace.extension.f5.bigip.virtualserver.stat.client.pkts.in.count | The number of packets received by the specified virtual server from client-side. | Count |
| Ephemeral packets received | com.dynatrace.extension.f5.bigip.virtualserver.stat.ephemeral.pkts.in.count | The number of packets received ephemeral by the specified virtual server. | Count |
| Packets transmitted | com.dynatrace.extension.f5.bigip.virtualserver.stat.client.pkts.out.count | The number of packets sent to client-side from the specified virtual server. | Count |
| Ephemeral packets transmitted | com.dynatrace.extension.f5.bigip.virtualserver.stat.ephemeral.pkts.out.count | The number of packets transmitted ephemeral from the specified virtual server. | Count |
| Metric name | Metric key | Description | Unit |
|---|---|---|---|
| CPU Usage | com.dynatrace.extension.f5.bigip.gtm.virtualserver.cpu_usage_count | The CPU usage in percentage for the specified virtual server. | Percent |
| Memory available | com.dynatrace.extension.f5.bigip.gtm.virtualserver.memory_available_count | The memory available in bytes for the specified virtual server. | Byte |
| Metric name | Metric key | Description | Unit |
|---|---|---|---|
| - | com.dynatrace.extension.network_device.if.in.multicast_pkts.count | - | - |
| - | com.dynatrace.extension.network_device.if.out.multicast_pkts.count | - | - |
| - | com.dynatrace.extension.network_device.if.in.broadcast_pkts.count | - | - |
| - | com.dynatrace.extension.network_device.if.out.broadcast_pkts.count | - | - |
| - | com.dynatrace.extension.network_device.if.in.ucast_pkts.count | - | - |
| - | com.dynatrace.extension.network_device.if.out.ucast_pkts.count | - | - |
| Metric name | Metric key | Description | Unit |
|---|---|---|---|
| Requests | com.dynatrace.extension.f5.bigip.gtm.wip.requests_count | The number of total requests for the specified wide IP. | Count |
| Resolutions | com.dynatrace.extension.f5.bigip.gtm.wip.resolutions_count | The number of total resolutions for the specified wide IP. | Count |
| Persisted requests | com.dynatrace.extension.f5.bigip.gtm.wip.persisted_requests_count | The number of persisted requests for the specified wide IP. | Count |
| Preferred lb requests | com.dynatrace.extension.f5.bigip.gtm.wip.lb_preferred_count | The number of times which the preferred load balance method is used for the specified wide IP. | Count |
| Fallback lb requests | com.dynatrace.extension.f5.bigip.gtm.wip.lb_fallback_count | The number of times which the fallback load balance method is used for the specified wide IP. | Count |
| Alternate lb requests | com.dynatrace.extension.f5.bigip.gtm.wip.lb_alternate_count | The number of times which the alternate load balance method is used for the specified wide IP. | Count |
| Dropped messages | com.dynatrace.extension.f5.bigip.gtm.wip.dropped_count | The number of dropped DNS messages for the specified wide IP. | Count |
| Return to DNS | com.dynatrace.extension.f5.bigip.gtm.wip.return_to_dns_count | The number of times which a resolve was returned to DNS (for resolution) for the specified wide IP. | Count |
| Return from DNS | com.dynatrace.extension.f5.bigip.gtm.wip.return_from_dns_count | The number of times which a resolve was returned from DNS for the specified wide IP. | Count |
| CNAME resolutions | com.dynatrace.extension.f5.bigip.gtm.wip.cname_resolutions_count | The number of times which a query is resolved by the CNAME of pools associated with the specified Wide IP. | Count |
| Metric name | Metric key | Description | Unit |
|---|---|---|---|
| Dropped packets | com.dynatrace.extension.f5.bigip.sys.droppedPacketRate | The total dropped packets. | Count |
| Packet errors in | com.dynatrace.extension.f5.bigip.sys.inErrorRate | The total incoming packet errors for the system. | Count |
| Dropped packets (license) | com.dynatrace.extension.f5.bigip.sys.licenseDeny | The packets which were dropped due to exceeding licensing limitations. | Count |
| Dropped packets (no handler) | com.dynatrace.extension.f5.bigip.sys.noHandlerDeny | The incoming packets that could not be processed by aa virtual server NAT or SNAT. | Count |
| Packet errors out | com.dynatrace.extension.f5.bigip.sys.outErrorRate | The total outgoing packet errors for the system. | Count |
| Dropped packets (no connection) | com.dynatrace.extension.f5.bigip.sys.virtServerNonSynDeny | The packets that are not connection requests and are destined for a virtual server that has no connection for the client address. | Count |
| Client packets in | com.dynatrace.extension.f5.bigip.sys.clientPacketsIn | The number of packets received by the system from client-side. | Count |
| Client packets out | com.dynatrace.extension.f5.bigip.sys.clientPacketsOut | The number of packets sent to client-side from the system. | Count |
| Server packets in | com.dynatrace.extension.f5.bigip.sys.serverPacketsIn | The number of packets received by the system from server-side. | Count |
| Server packets out | com.dynatrace.extension.f5.bigip.sys.serverPacketsOut | The number of packets sent to server-side from the system. | Count |
| Metric name | Metric key | Description | Unit |
|---|---|---|---|
| Common connections | com.dynatrace.extension.f5.bigip.profile.client.ssl.stat.tot.compat.conns.count | The total number of concurrent compat connections with established SSL sessions being maintained by the filter. | Count |
| Native connections | com.dynatrace.extension.f5.bigip.profile.client.ssl.stat.tot.native.conns.count | The total number of concurrent native connections with established SSL sessions being maintained by the filter. | Count |
| Fatal alerts | com.dynatrace.extension.f5.bigip.profile.client.ssl.stat.fatal.alerts.count | The total number of the fatal alerts. | Count |
| Secure handshakes | com.dynatrace.extension.f5.bigip.profile.client.ssl.stat.secure.handshakes.count | The number of handshakes, including mid-stream re-negotiations, performed with peers supporting SSL secure renegotiation. | Count |
| Handshake failures | com.dynatrace.extension.f5.bigip.profile.client.ssl.stat.handshake.failures.count | The total number of handshake failures. | Count |
| Insecure handshakes accepted | com.dynatrace.extension.f5.bigip.profile.client.ssl.stat.insecure.handshake.accepts.count | The number of handshakes, including mid-stream re-negotiations, performed with peers not supporting SSL secure renegotiation. | Count |
| Insecure handshakes rejected | com.dynatrace.extension.f5.bigip.profile.client.ssl.stat.insecure.handshake.rejects.count | The number of rejected initial handshakes with peers not supporting SSL secure renegotiation. | Count |
| Insecure renegotiations rejected | com.dynatrace.extension.f5.bigip.profile.client.ssl.stat.insecure.renegotiation.rejects.count | The number of rejected renegotiation attempts by peers not supporting SSL secure renegotiation. | Count |
| DTLSv1 connections | com.dynatrace.extension.f5.bigip.profile.client.ssl.stat.dtlsv1.count | The total connections for SSL DTLS protocol version 1.0. | Count |
| SSLv2 connections | com.dynatrace.extension.f5.bigip.profile.client.ssl.stat.sslv2.count | The total connections for SSL protocol version 2. | Count |
| SSLv3 connections | com.dynatrace.extension.f5.bigip.profile.client.ssl.stat.sslv3.count | The total connections for SSL protocol version 3. | Count |
| TLSv1 connections | com.dynatrace.extension.f5.bigip.profile.client.ssl.stat.tlsv1.count | The total connections for SSL TLS protocol version 1. | Count |
| TLSv1.1 connections | com.dynatrace.extension.f5.bigip.profile.client.ssl.stat.tlsv11.count | The total connections for SSL TLS protocol version 1.1. | Count |
| TLSv1.2 connections | com.dynatrace.extension.f5.bigip.profile.client.ssl.stat.tlsv12.count | The total connections for SSL TLS protocol version 1.2. | Count |
| Metric name | Metric key | Description | Unit |
|---|---|---|---|
| DNS queries | com.dynatrace.extension.f5.bigip.gtm.profile.queries_count | The total number of DNS queries. | Count |
| DNS responses | com.dynatrace.extension.f5.bigip.gtm.profile.responses_count | The total number of DNS responses. | Count |
| Cache requests | com.dynatrace.extension.f5.bigip.gtm.profile.to_cache_count | The number of requests sent to the DNS cache. | Count |
| DNS requests | com.dynatrace.extension.f5.bigip.gtm.profile.to_dns_count | The number of requests sent to backend DNS. | Count |
| Dropped messages | com.dynatrace.extension.f5.bigip.gtm.profile.drops_count | The number of packets dropped (not sent to GTM, DNS-Express, DNSSEC, DNS64, or Backend DNS (e.g. BIND)). | Count |
| NOERROR responses | com.dynatrace.extension.f5.bigip.gtm.profile.resp_noerror_count | The number of NOERROR responses sent. | Count |
| NXDOMAIN responses | com.dynatrace.extension.f5.bigip.gtm.profile.resp_nxdomain_count | The number of responses whose return code is NXDOMAIN. | Count |
| SERVFAIL responses | com.dynatrace.extension.f5.bigip.gtm.profile.resp_servfail_count | The number of responses whose return code is SERVFAIL. | Count |
| REFUSED responses | com.dynatrace.extension.f5.bigip.gtm.profile.resp_refused_count | The number of responses whose return code is REFUSED. | Count |
| Malicious packets | com.dynatrace.extension.f5.bigip.gtm.profile.malicious_count | The number of malicious packets received. | Count |
| Metric name | Metric key | Description | Unit |
|---|---|---|---|
| Failover and Sync status | com.dynatrace.extension.f5.bigip.sys.cm.state | The failover and config synchronization status of the device. Failover states can be: (0)unknown - the failover status of the device is unknown; (1)offline - the device is offline; (2)forcedOffline - the device is forced offline; (3)standby - the device is standby; (4)active - the device is active. Synchronization status can be: unknown(0), syncing(1), needManualSync(2), inSync(3), syncFailed(4), syncDisconnected(5), standalone(6), awaitingInitialSync(7), incompatibleVersion(8), partialSync(9) | NotApplicable |
| Metric name | Metric key | Description | Unit |
|---|---|---|---|
| Wide IP state | com.dynatrace.extension.f5.bigip.gtm.wip.state | State metric which captures the metadata details of an F5 DNS (GTM) Wide IP. The value is always 1. | NotApplicable |
| Wide IP to Pool link | com.dynatrace.extension.f5.bigip.gtm.wip.pool_link | Relational metric linking F5 DNS (GTM) Pools to a Wide IP | NotApplicable |
| Metric name | Metric key | Description | Unit |
|---|---|---|---|
| Virtual server state | com.dynatrace.extension.f5.bigip.virtualserver.state | General state metric for the server. Value is always 1, but dimensions carry all details of a virtual server. | Unspecified |
| Metric name | Metric key | Description | Unit |
|---|---|---|---|
| Pool member state | com.dynatrace.extension.f5.bigip.gtm.pool_member.state | State metric which captures details of F5 DNS (GTM) Pool Members. Value is always 1. | NotApplicable |
| Metric name | Metric key | Description | Unit |
|---|---|---|---|
| APM total system sessions | com.dynatrace.extension.f5.bigip.apm.session.system_total | The total sessions created in the system. apmAccessStatTotalSessions | Count |
| APM active system sessions | com.dynatrace.extension.f5.bigip.apm.session.system_active.count | The total active user sessions in the system. apmAccessStatCurrentActiveSessions | Count |
| Metric name | Metric key | Description | Unit |
|---|---|---|---|
| Total memory | com.dynatrace.extension.f5.bigip.sys.host.memory.total | The total host memory in bytes (not including TMM). This is for a single host system. | Byte |
| Used memory | com.dynatrace.extension.f5.bigip.sys.host.memory.used | The host memory in bytes currently in use (not including TMM). This is for a single host system. | Byte |
| Metric name | Metric key | Description | Unit |
|---|---|---|---|
| GET Requests | com.dynatrace.extension.f5.bigip.profile.http.stat.get.reqs.count | The total number of HTTP get requests. | Count |
| POST Requests | com.dynatrace.extension.f5.bigip.profile.http.stat.post.reqs.count | The total number of HTTP post requests. | Count |
| 2xx Responses | com.dynatrace.extension.f5.bigip.profile.http.stat.resp2xx.cnt.count | The number of server-side responses in range of 200 to 206 (successful responses) | Count |
| 3xx Responses | com.dynatrace.extension.f5.bigip.profile.http.stat.resp3xx.cnt.count | The number of server-side responses in range of 300 to 307 (redirection responses). | Count |
| 4xx Responses | com.dynatrace.extension.f5.bigip.profile.http.stat.resp4xx.cnt.count | The number of server-side responses in range of 400 to 417 (client errors). | Count |
| 5xx Responses | com.dynatrace.extension.f5.bigip.profile.http.stat.resp5xx.cnt.count | The number of server-side responses in range of 500 to 505 (server errors). | Count |
| Metric name | Metric key | Description | Unit |
|---|---|---|---|
| Signature failures | com.dynatrace.extension.f5.bigip.gtm.dnssec.sig_failures_count | Total number of general signature failures. | Count |
| RRSET failures | com.dynatrace.extension.f5.bigip.gtm.dnssec.rrset_failures_count | Total number of failures due to an RRSET failing to be signed. | Count |
| DNSKEY queries | com.dynatrace.extension.f5.bigip.gtm.dnssec.dnskey_queries_count | Total number of queries for DNSKEY type. | Count |
| Metric name | Metric key | Description | Unit |
|---|---|---|---|
| Preferred lb requests | com.dynatrace.extension.f5.bigip.gtm.pool.lb_preferred_count | The number of times which the preferred load balance method is used for the specified pool. | Count |
| Alternate lb requests | com.dynatrace.extension.f5.bigip.gtm.pool.lb_alternate_count | The number of times which the alternate load balance method is used for the specified pool. | Count |
| Fallback lb requests | com.dynatrace.extension.f5.bigip.gtm.pool.lb_fallback_count | The number of times which the fallback load balance method is used for the specified pool. | NotApplicable |
| Dropped messages | com.dynatrace.extension.f5.bigip.gtm.pool.dropped_count | The number of dropped DNS messages for the specified pool. | Count |
| Return to DNS | com.dynatrace.extension.f5.bigip.gtm.pool.return_to_dns_count | The number of times which a resolve was returned to DNS (for resolution) for the specified pool. | Count |
| Return from DNS | com.dynatrace.extension.f5.bigip.gtm.pool.return_from_dns_count | The number of times which a resolve was returned from DNS for the specified pool. | Count |
| Metric name | Metric key | Description | Unit |
|---|---|---|---|
| LTM nodes | com.dynatrace.extension.f5.bigip.ltm.nodes | The number of ltmNodeAddr entries in the table. | Count |
| LTM pools | com.dynatrace.extension.f5.bigip.ltm.pools | The number of ltmPool entries in the table. | Count |
| LTM virtual servers | com.dynatrace.extension.f5.bigip.ltm.virtualservers | The number of ltmVirtualServ entries in the table. | Count |
| Metric name | Metric key | Description | Unit |
|---|---|---|---|
| DNS Pool state | com.dynatrace.extension.f5.bigip.gtm.pool.state | State metric which captures details of DNS (GTM) Pools. Value is always 1. | NotApplicable |
| Metric name | Metric key | Description | Unit |
|---|---|---|---|
| Ephemeral connections | com.dynatrace.extension.f5.bigip.virtualserver.stat.ephemeral.tot.conns.count | The total ephemeral connections to the specified virtual server. | Count |
| Slow connections killed | com.dynatrace.extension.f5.bigip.virtualserver.stat.client.slow.killed.count | The number of slow client-side connections that have been killed on the specified virtual server. | Count |
| Evicted connections | com.dynatrace.extension.f5.bigip.virtualserver.stat.client.evicted.conns.count | The number of client-side connections that have been evicted on the specified virtual server. | Count |
| Metric name | Metric key | Description | Unit |
|---|---|---|---|
| Insecure handshakes accepted | com.dynatrace.extension.f5.bigip.profile.server.ssl.stat.insecure.handshake.accepts.count | The number of handshakes, including mid-stream re-negotiations, performed with peers not supporting SSL secure renegotiation. | Count |
| Insecure handshakes rejected | com.dynatrace.extension.f5.bigip.profile.server.ssl.stat.insecure.handshake.rejects.count | The number of rejected initial handshakes with peers not supporting SSL secure renegotiation. | Count |
| Insecure renegotiations rejected | com.dynatrace.extension.f5.bigip.profile.server.ssl.stat.insecure.renegotiation.rejects.count | The number of rejected renegotiation attempts by peers not supporting SSL secure renegotiation. | Count |
| Metric name | Metric key | Description | Unit |
|---|---|---|---|
| System Users | com.dynatrace.extension.f5.bigip.sys.host.num_users | The number of user sessions for which this host is storing state information. hrSystemNumUsers | Count |
| System Processes | com.dynatrace.extension.f5.bigip.sys.host.num_processes | The number of process contexts currently loaded or running on this system. hrSystemProcesses | Count |
| System Max Processes | com.dynatrace.extension.f5.bigip.sys.host.max_processes | The maximum number of process contexts this system can support. hrSystemMaxProcesses | Count |
| Load Average 1min | com.dynatrace.extension.f5.bigip.sys.host.load_average | The 1 minute load average. laLoad | Count |
| Metric name | Metric key | Description | Unit |
|---|---|---|---|
| Client bytes in | com.dynatrace.extension.f5.bigip.sys.clientBytesIn | The number of bytes received by the system from client-side. | Byte |
| Client bytes out | com.dynatrace.extension.f5.bigip.sys.clientBytesOut | The number of bytes sent to client-side from the system. | Byte |
| Server bytes in | com.dynatrace.extension.f5.bigip.sys.serverBytesIn | The number of bytes received by the system from server-side. | Byte |
| Server bytes out | com.dynatrace.extension.f5.bigip.sys.serverBytesOut | The number of bytes sent to server-side from the system. | Byte |
| Client current connections | com.dynatrace.extension.f5.bigip.sys.clientCurConns | The current connections from client-side to the system. | Count |
| Client max connections | com.dynatrace.extension.f5.bigip.sys.clientMaxConns | The maximum connections from client-side to the system. | Count |
| Server current connections | com.dynatrace.extension.f5.bigip.sys.serverCurConns | The current connections from server-side to the system. | Count |
| Server max connections | com.dynatrace.extension.f5.bigip.sys.serverMaxConns | The maximum connections from server-side to the system. | Count |
| Pva client current connections | com.dynatrace.extension.f5.bigip.sys.hwClientCurConns | The current hardware accelerated connections from client-side to the system. | Count |
| Pva client max connections | com.dynatrace.extension.f5.bigip.sys.hwClientMaxConns | The maximum hardware accelerated connections from client-side to the system. | Count |
| Metric name | Metric key | Description | Unit |
|---|---|---|---|
| Bytes received | com.dynatrace.extension.f5.bigip.pool_member.stat.server.bytes.in.count | The number of bytes received by the specified pool member from server-side. | Byte |
| Bytes transmitted | com.dynatrace.extension.f5.bigip.pool_member.stat.server.bytes.out.count | The number of bytes sent to server-side from the specified pool member. | Byte |
| Packets received | com.dynatrace.extension.f5.bigip.pool_member.stat.server.pkts.in.count | The number of packets received by the specified pool member from server-side. | Count |
| Packets transmitted | com.dynatrace.extension.f5.bigip.pool_member.stat.server.pkts.out.count | The number of packets sent to server-side from the specified pool member. | Count |
| Metric name | Metric key | Description | Unit |
|---|---|---|---|
| Profile state | com.dynatrace.extension.f5.bigip.gtm.profile.state | A state metric containing the details of a DNS Profile. The value is always 1, use the dimensions to understand the details. | NotApplicable |
| Metric name | Metric key | Description | Unit |
|---|---|---|---|
| Monitor status | com.dynatrace.extension.f5.bigip.pool_member.monitor.status | The hierarchical load balance state for the specified node address, including parent status. Value is always 1. Status dimension takes values: unchecked(0), checking(1), inband(2), up(3), addr-down(18), down(19), forced-down(20), maint(21), irule-down(22), inband-down(23), down-manual-resume(24) | Unspecified |
| Pool Member state | com.dynatrace.extension.f5.bigip.pool_member.state | General state metric for the pool_member. Value is always 1, but dimensions 'Enabled state' and 'Availability state' define the state. The availability state takes the following values: 0 (none/error); 1 (green/available in some capacity); 2 (yellow/not currently available); 3 (red/not available); 4 (blue/availability is unknown); 5 (gray/unlicensed). Enabled state takes values 0 (none), 1 (enabled), 2 (disabled), 3 (disabled by parent). | Unspecified |
| Metric name | Metric key | Description | Unit |
|---|---|---|---|
| APM total access profile sessions | com.dynatrace.extension.f5.bigip.apm.profile.total_sessions.count | The total user sessions in the specified access profile. apmPaStatTotalSessions | Count |
| APM active access profile sessions | com.dynatrace.extension.f5.bigip.apm.profile.active_sessions.count | The total active user sessions in the specified access profile. apmPaStatCurrentActiveSessions | Count |
| Metric name | Metric key | Description | Unit |
|---|---|---|---|
| Data Plane CPU | com.dynatrace.extension.f5.bigip.sys.data.cpu1min | The average CPU usage of the data plane in the last one minute. | Percent |
| Control Plane CPU | com.dynatrace.extension.f5.bigip.sys.control.cpu1min | The average CPU usage of the control plane in the last one minute. | Percent |
| Analysis Plane CPU | com.dynatrace.extension.f5.bigip.sys.analysis.cpu1min | The average CPU usage of the analysis plane in the last one minute. | Percent |
| Metric name | Metric key | Description | Unit |
|---|---|---|---|
| Total swap | com.dynatrace.extension.f5.bigip.mem.total.swap | The total amount of swap space configured for this host. | KiloByte |
| Available swap | com.dynatrace.extension.f5.bigip.mem.avail.swap | The amount of swap space currently unused or available. | KiloByte |
| Shared memory | com.dynatrace.extension.f5.bigip.mem.shared | The total amount of real or virtual memory currently allocated for use as shared memory. This object will not be implemented on hosts where the underlying operating system does not explicitly identify memory as specifically reserved for this purpose. | KiloByte |
| Cached memory | com.dynatrace.extension.f5.bigip.mem.cached | The total amount of real or virtual memory currently allocated for use as cached memory. This object will not be implemented on hosts where the underlying operating system does not explicitly identify memory as specifically reserved for this purpose. | KiloByte |
| Buffer memory | com.dynatrace.extension.f5.bigip.mem.buffer | The total amount of real or virtual memory currently allocated for use as memory buffers. This object will not be implemented on hosts where the underlying operating system does not explicitly identify memory as specifically reserved for this purpose. | KiloByte |
| TMM memory total | com.dynatrace.extension.f5.bigip.sys.tmm.memory.total | The total memory available to TMM (Traffic Management Microkernel). | Byte |
| TMM memory used | com.dynatrace.extension.f5.bigip.sys.tmm.memory.used | The memory currently in use by TMM (Traffic Management Microkernel). | Byte |
| Other TMOS memory total | com.dynatrace.extension.f5.bigip.sys.tmos.other.memory.total | The total memory available to other TMOS processes (excluding TMM). | Byte |
| Other TMOS memory used | com.dynatrace.extension.f5.bigip.sys.tmos.other.memory.used | The memory currently in use by other TMOS processes (excluding TMM). | Byte |
| Metric name | Metric key | Description | Unit |
|---|---|---|---|
| Status | com.dynatrace.extension.f5.bigip.sys.interface.status | The current state of the specified interface. | Unspecified |
| Bytes received | com.dynatrace.extension.f5.bigip.sys.interface.stat.bytes.in.count | The number of bytes received on the specified interface. | Byte |
| Bytes transmitted | com.dynatrace.extension.f5.bigip.sys.interface.stat.bytes.out.count | The number of bytes transmitted out of the specified interface. | Byte |
| Packets received | com.dynatrace.extension.f5.bigip.sys.interface.stat.pkts.in.count | The number of packets received on this interface. | Count |
| Packets transmitted | com.dynatrace.extension.f5.bigip.sys.interface.stat.pkts.out.count | The number of packets transmitted out of the specified interface. | Count |
| Dropped incoming packets | com.dynatrace.extension.f5.bigip.sys.interface.stat.drops.in.count | The number of packets dropped on ingress for various reasons on the specified interface. | Count |
| Dropped outgoing packets | com.dynatrace.extension.f5.bigip.sys.interface.stat.drops.out.count | The number of packets aged out or with excessive transmission delays due to multiple deferrals on the specified interface. | Count |
| Incoming errors | com.dynatrace.extension.f5.bigip.sys.interface.stat.errors.in.count | The number of received packets that are either undersized, oversized, or have FCS errors by the specified interface. | Count |
| Outgoing errors | com.dynatrace.extension.f5.bigip.sys.interface.stat.errors.out.count | The number of excessive collisions, incremented for each frame that experienced 16 collisions during transmission and was aborted on the specified interface. | Count |
| Metric name | Metric key | Description | Unit |
|---|---|---|---|
| Requests | com.dynatrace.extension.f5.bigip.pool_member.stat.tot.requests.count | The total number of requests going through the specified pool member. | Count |
| Current connections | com.dynatrace.extension.f5.bigip.pool_member.stat.server.current_conns | The current number of connections from server-side to the specified pool member. | Count |
| Queued connections | com.dynatrace.extension.f5.bigip.pool_member.stat.server.queued_conns | The number of connections currently in queue. | Count |
| Metric name | Metric key | Description | Unit |
|---|---|---|---|
| Bytes received | com.dynatrace.extension.f5.bigip.pool.stat.server.bytes.in.count | The number of bytes received by the specified pool from server-side. | Byte |
| Bytes transmitted | com.dynatrace.extension.f5.bigip.pool.stat.server.bytes.out.count | The number of bytes sent to server-side from the specified pool. | Byte |
| Packets received | com.dynatrace.extension.f5.bigip.pool.stat.server.pkts.in.count | The number of packets received by the specified pool from server-side. | Count |
| Packets transmitted | com.dynatrace.extension.f5.bigip.pool.stat.server.pkts.out.count | The number of packets sent to server-side from the specified pool. | Count |
| Metric name | Metric key | Description | Unit |
|---|---|---|---|
| Failures | com.dynatrace.extension.f5.bigip.rule.event.stat.failures.count | The number of failures for executing the specified rule. | Count |
| Aborts | com.dynatrace.extension.f5.bigip.rule.event.stat.aborts.count | The number of aborts when executing the specified rule. | Count |
| Executions | com.dynatrace.extension.f5.bigip.rule.event.stat.total.executions.count | The total number of event executions for the specified rule. | Count |
| Metric name | Metric key | Description | Unit |
|---|---|---|---|
| Bits received | com.dynatrace.extension.f5.bigip.gtm.virtualserver.bits_persec_in_count | The number of bits per second received by the specified virtual server. | BitPerSecond |
| Bits sent | com.dynatrace.extension.f5.bigip.gtm.virtualserver.bits_persec_out_count | The number of bits per second sent by the specified virtual server. | BitPerSecond |
| Packets received | com.dynatrace.extension.f5.bigip.gtm.virtualserver.pkts_persec_in_count | The number of packets per second received by the specified virtual server. | PerSecond |
| Packets sent | com.dynatrace.extension.f5.bigip.gtm.virtualserver.pkts_persec_out_count | The number of packets per second received by the specified virtual server. | PerSecond |
| Connections | com.dynatrace.extension.f5.bigip.gtm.virtualserver.connections_count | The number of total connections to the specified virtual server. | Count |
| Metric name | Metric key | Description | Unit |
|---|---|---|---|
| - | com.dynatrace.extension.network_device.if.bytes_in.count | - | - |
| - | com.dynatrace.extension.network_device.if.bytes_out.count | - | - |
| - | com.dynatrace.extension.network_device.if.in.errors.count | - | - |
| - | com.dynatrace.extension.network_device.if.in.discards.count | - | - |
| - | com.dynatrace.extension.network_device.if.out.errors.count | - | - |
| - | com.dynatrace.extension.network_device.if.out.discards.count | - | - |
| - | com.dynatrace.extension.network_device.if.lastchange | - | - |
| Metric name | Metric key | Description | Unit |
|---|---|---|---|
| Members | com.dynatrace.extension.f5.bigip.pool.member.cnt | The total number of members in the specified pool. | Count |
| Active members | com.dynatrace.extension.f5.bigip.pool.active.member.cnt | The number of the current active members in the specified pool. | Count |
| Pool state | com.dynatrace.extension.f5.bigip.pool.state | General state metric for the pool. Value is always 1, but dimensions 'Enabled state' and 'Availability state' define the state. The availability state takes the following values: 0 (none/error); 1 (green/available in some capacity); 2 (yellow/not currently available); 3 (red/not available); 4 (blue/availability is unknown); 5 (gray/unlicensed). Enabled state takes values 0 (none), 1 (enabled), 2 (disabled), 3 (disabled by parent). | Unspecified |
| Metric name | Metric key | Description | Unit |
|---|---|---|---|
| Block size | com.dynatrace.extension.f5.bigip.sys.host.disk.block.size | The number of bytes in the specified partition. | Byte |
| Total blocks | com.dynatrace.extension.f5.bigip.sys.host.disk.total.blocks | The number of total blocks in the specified partition. | Count |
| Free blocks | com.dynatrace.extension.f5.bigip.sys.host.disk.free.blocks | The number of free blocks in the specified partition. | Count |
| Metric name | Metric key | Description | Unit |
|---|---|---|---|
| Physical Sensor Value | com.dynatrace.extension.f5.bigip.sensor.value | The most recent measurement obtained by the agent for this sensor. entPhySensorValue | Count |
| Metric name | Metric key | Description | Unit |
|---|---|---|---|
| Idle CPU | com.dynatrace.extension.f5.bigip.sys.global.host.cpu.idle1m | The average time spent by the specified processor doing nothing for the system in the last one minute. | Percent |
| IO Wait CPU | com.dynatrace.extension.f5.bigip.sys.global.host.cpu.iowait1m | The average time spent by the specified processor waiting for external I/O to complete for the system in the last one minute. | Percent |
| IRQ CPU | com.dynatrace.extension.f5.bigip.sys.global.host.cpu.irq1m | The average time spent by the specified processor servicing hardware interrupts for the system in the last one minute. | Percent |
| Soft IRQ CPU | com.dynatrace.extension.f5.bigip.sys.global.host.cpu.softirq1min | The average time spent by the specified processor servicing soft interrupts for the system in the last one minute. | Percent |
| Stolen CPU | com.dynatrace.extension.f5.bigip.sys.global.host.cpu.stolen1m | The average time 'stolen' from the system in the last one minute. | Percent |
| System CPU | com.dynatrace.extension.f5.bigip.sys.global.host.cpu.system1m | The average time spent by the specified processor servicing system calls for the system in the last one minute. | Percent |
| User CPU | com.dynatrace.extension.f5.bigip.sys.global.host.cpu.user1m | The average time spent by the specified processor in user context for the system in the last one minute. | Percent |
| Metric name | Metric key | Description | Unit |
|---|---|---|---|
| Connection limit | com.dynatrace.extension.f5.bigip.virtualserver.conn_limit | The maximum number of connections the specified virtual server is allowed to have open at one time | Count |
| Requests | com.dynatrace.extension.f5.bigip.virtualserver.stat.tot.requests.count | The total number of requests going through the specified virtual server. | Count |
| Max connections | com.dynatrace.extension.f5.bigip.virtualserver.stat.client.max_conns | The maximum number of connections from client-side to the specified virtual server. This includes queued connections. | Count |
| Current connections | com.dynatrace.extension.f5.bigip.virtualserver.stat.client.current_conns | The current connections from client-side to the specified virtual server. | Count |
| Metric name | Metric key | Description | Unit |
|---|---|---|---|
| Secure handshakes | com.dynatrace.extension.f5.bigip.profile.server.ssl.stat.secure.handshakes.count | The number of handshakes, including mid-stream re-negotiations, performed with peers supporting SSL secure renegotiation. | Count |
| Handshake failures | com.dynatrace.extension.f5.bigip.profile.server.ssl.stat.handshake.failures.count | The total number of handshake failures. | Count |
| Metric name | Metric key | Description | Unit |
|---|---|---|---|
| Requests | com.dynatrace.extension.f5.bigip.pool.stat.tot.requests.count | The total number of requests to the specified pool. | Count |
| Current connections | com.dynatrace.extension.f5.bigip.pool.stat.server.current_conns | The current number of connections from server-side to the specified pool. | Count |
| Queued connections | com.dynatrace.extension.f5.bigip.pool.stat.server.queued_conns | The number of connections currently in queue | Count |
| Current sessions | com.dynatrace.extension.f5.bigip.pool.stat.cur.sessions | The current number of sessions to the specified pool. | Count |
| Metric name | Metric key | Description | Unit |
|---|---|---|---|
| Common connections | com.dynatrace.extension.f5.bigip.profile.server.ssl.stat.tot.compat.conns.count | The total number of concurrent compat connections with established SSL sessions being maintained by the filter. | Count |
| Native connections | com.dynatrace.extension.f5.bigip.profile.server.ssl.stat.tot.native.conns.count | The total number of concurrent native connections with established SSL sessions being maintained by the filter. | Count |
| Fatal alerts | com.dynatrace.extension.f5.bigip.profile.server.ssl.stat.fatal.alerts.count | The total number of the fatal alerts. | Count |
| DTLSv1 connections | com.dynatrace.extension.f5.bigip.profile.server.ssl.stat.dtlsv1.count | The total connections for SSL DTLS protocol version 1. | Count |
| DTLSv2 connections | com.dynatrace.extension.f5.bigip.profile.server.ssl.stat.sslv2.count | The total connections for SSL protocol version 2. | Count |
| SSLv3 connections | com.dynatrace.extension.f5.bigip.profile.server.ssl.stat.sslv3.count | The total connections for SSL protocol version 3. | Count |
| TLSv1.1 connections.count | com.dynatrace.extension.f5.bigip.profile.server.ssl.stat.tlsv11.count | The total connections for SSL TLS protocol version 1.1. | Count |
| TLSv1.2 connections | com.dynatrace.extension.f5.bigip.profile.server.ssl.stat.tlsv12.count | The total connections for SSL TLS protocol version 1.2. | Count |
| TLSv1 connections | com.dynatrace.extension.f5.bigip.profile.server.ssl.stat.tlsv1.count | The total connections for SSL TLS protocol version 1. | Count |
| Metric name | Metric key | Description | Unit |
|---|---|---|---|
| Virtual server state | com.dynatrace.extension.f5.bigip.gtm.virtualserver.state | State metric describing the details of a DNS virtual server. The value is always 1, use the dimensions to understand the details. | NotApplicable |
| Metric name | Metric key | Description | Unit |
|---|---|---|---|
| APM current connections | com.dynatrace.extension.f5.bigip.apm.current_conns | The total current SSL/VPN connections in the system | Count |
| APM connectivity licenses | com.dynatrace.extension.f5.bigip.apm.total_licenses | The total connectivity session licenses in the system | Count |
Infrastructure & Operations app for displaying Connections chart group on LTM Profile entities.instance-memory-advanced feature set:
com.dynatrace.extension.f5.bigip.sys.tmm.memory.totalcom.dynatrace.extension.f5.bigip.sys.tmm.memory.usedcom.dynatrace.extension.f5.bigip.sys.tmos.other.memory.totalcom.dynatrace.extension.f5.bigip.sys.tmos.other.memory.usedinstance-cpu-advanced feature set:
com.dynatrace.extension.f5.bigip.sys.data.cpu1mincom.dynatrace.extension.f5.bigip.sys.control.cpu1mincom.dynatrace.extension.f5.bigip.sys.analysis.cpu1minsnmp.ip field.1.338.0 and a minimum EEC version of 1.333.0.sys.name dimension would always be null on generic interface metrics, causing some issues with topology linking of metricscom.dynatrace.extension.f5.bigip.sys.uptime and func:com.dynatrace.extension.f5.bigip.sys.uptime.sec
com.dynatrace.extension.network_device.sysuptime is still present in the com.dynatrace.extension.network_device.sysuptime metricfunc:com.dynatrace.extension.f5.bigip.sys.uptime.sec can be visualized by dividing com.dynatrace.extension.network_device.sysuptime by 100sys.name and mac.address dimensions are required on all network metrics and filtered for empty values. This caused unnecessary stress on topology engine✨ New in this version:
1.318Advanced interfaces feature set with the following metrics:
com.dynatrace.extension.network_device.if.lastchange.countcom.dynatrace.extension.network_device.if.in.multicast_pkts.countcom.dynatrace.extension.network_device.if.out.multicast_pkts.countcom.dynatrace.extension.network_device.if.in.broadcast_pkts.countcom.dynatrace.extension.network_device.if.out.broadcast_pkts.countcom.dynatrace.extension.network_device.if.in.ucast_pkts.countcom.dynatrace.extension.network_device.if.out.ucast_pkts.countdefault feature set:com.dynatrace.extension.network_device.if.in.errors.countcom.dynatrace.extension.network_device.if.out.errors.countcom.dynatrace.extension.network_device.if.in.discards.countcom.dynatrace.extension.network_device.if.out.errors.countMetrics in "default" feature set will always be enabled and cannot be disabled. These metrics are mandatory. Take extra caution configuring devices and interfaces for which you are collecting data. Make use of Interface filters to limit the number of interfaces, otherwise, all interfaces on the device will be collected by default.
In case you do not wish to collect interfaces on your device, enter $eq(!) in the "Interface Name" filter field on the Feature Sets screen during configuration.
neighbor-discovery feature set was removed. This is now handled by the SNMP Autodiscovery extension for any kind of deviceSNAT Type and SNAT Pool were not populating due to deprecated OIDsisInstanceOf to calls to support many-to-many cardinality.device-connection-stats covers connectivity and traffic statisticsdevice-packet-stats is a more detailed set of metrics covering statistics at packet levelentity-counts gives a view of total nodes, pools, and virtual serverschassis-components feature set
apm-licenses feature set