






































































Learn the Dynatrace Query Language
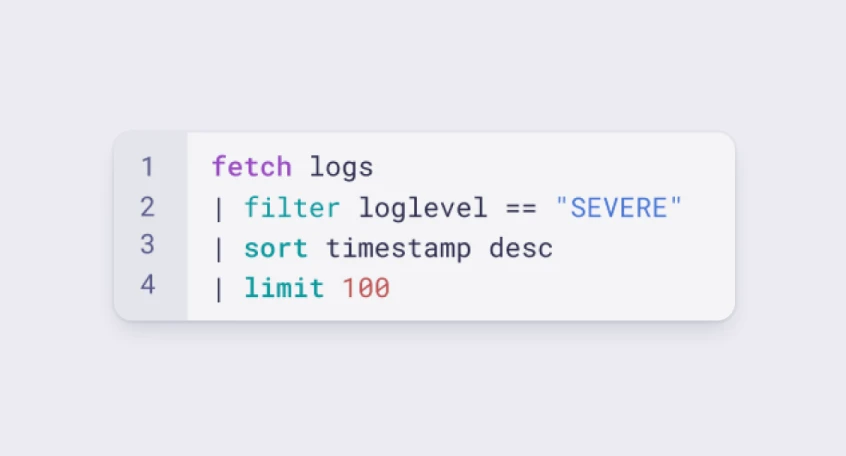
Explore data, discover patterns, anomalies and outliers, and create statistical modeling with DQL, our powerful query language..
Learn DQL
 Generic Cisco Device
Monitor Cisco devices using SNMP to feed Dynatrace with metrics and alerts.
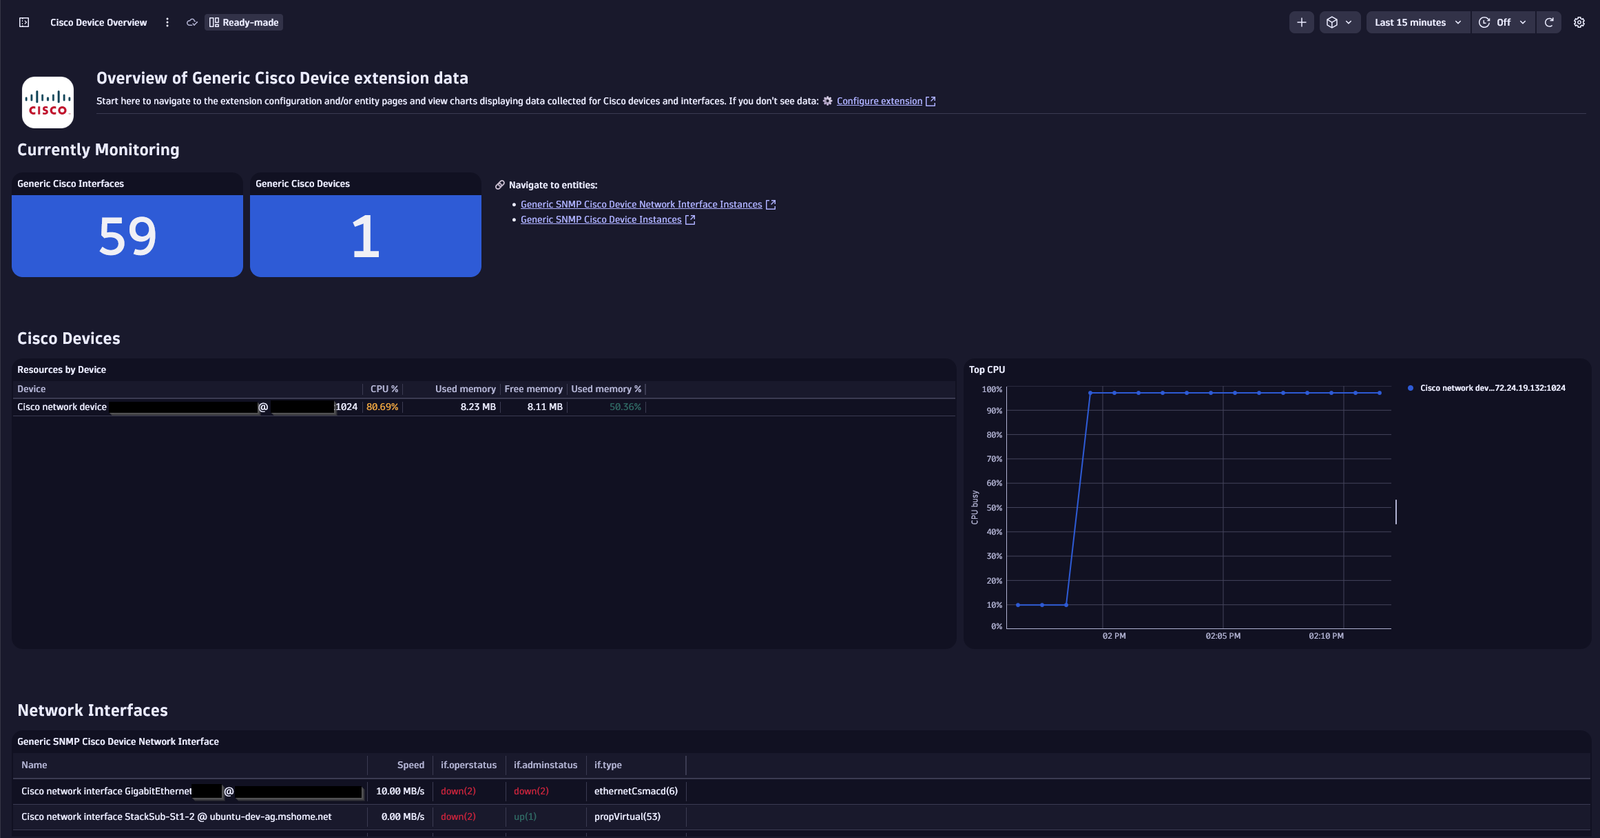
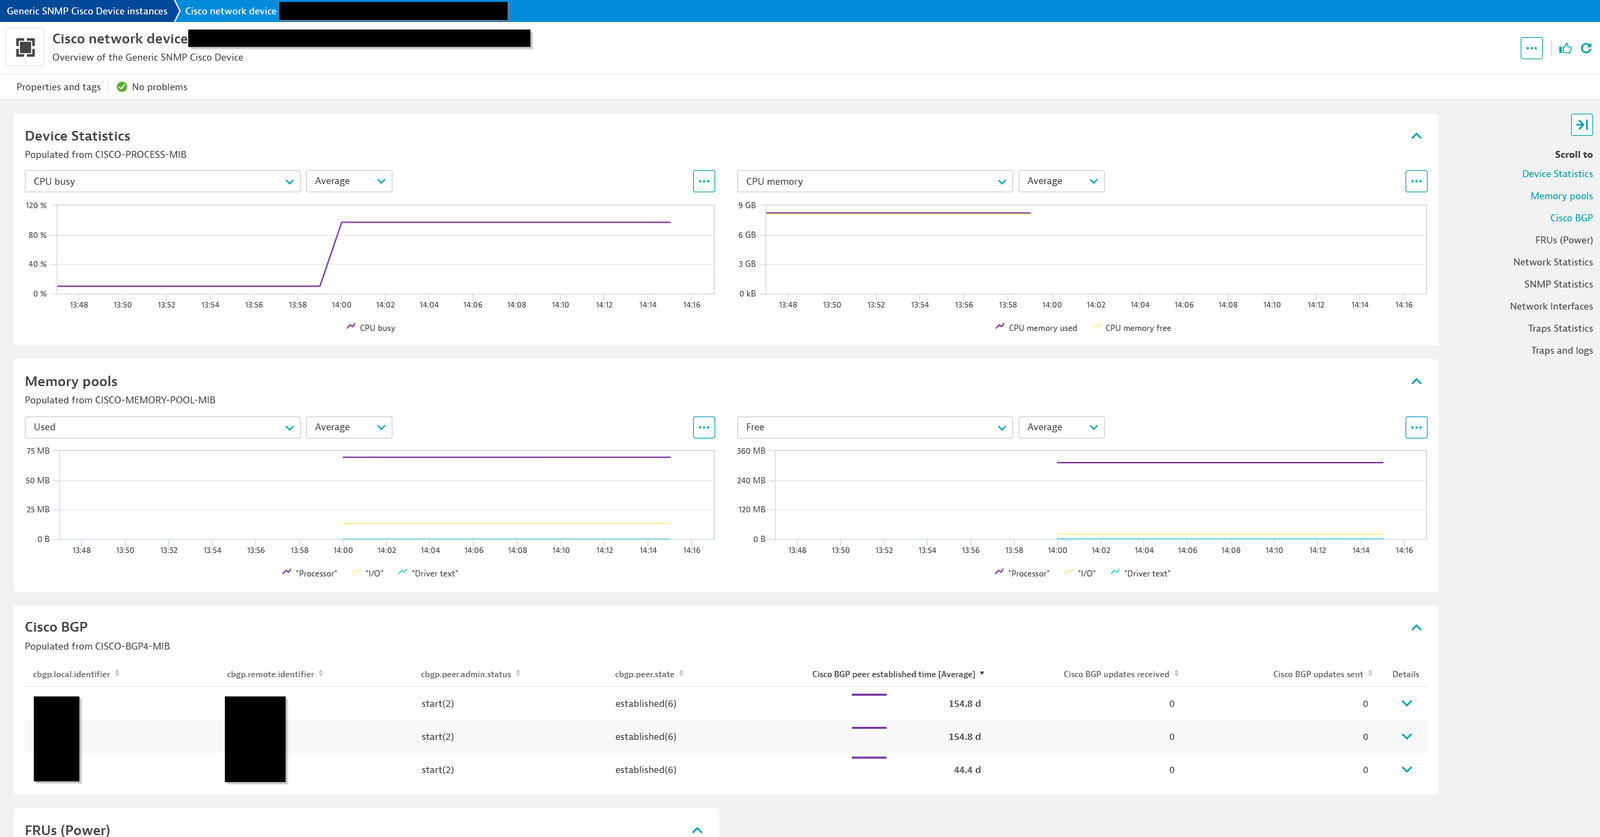
ExtensionCisco devices are a critical component in your network infrastructure. The Generic Cisco Device monitoring extension allows for remote monitoring of your Cisco network devices via the Simple Network Management Protocol (SNMP).
For more information on the installation and configuration, please see Generic Cisco Device extension in the Dynatrace Documentation.
This extension is designed to generically provide visibility into a wide variety of Cisco network devices. Only products still supported by Cisco will be officially supported but it can be used to monitor any devices that meet the requirements for SNMP connectivity and support the MIBs and OIDs used.
Below is a complete list of the feature sets provided in this version. To ensure a good fit for your needs, individual feature sets can be activated and deactivated by your administrator during configuration.
| Metric name | Metric key | Description | Unit |
|---|---|---|---|
| - | com.dynatrace.extension.network_device.sysuptime | - | - |
| - | com.dynatrace.extension.network_device.cpu_usage | - | - |
| - | com.dynatrace.extension.network_device.memory_used | - | - |
| - | com.dynatrace.extension.network_device.memory_free | - | - |
| - | com.dynatrace.extension.network_device.if.status | - | - |
| Metric name | Metric key | Description | Unit |
|---|---|---|---|
| Memory pool used (32 bit) | com.dynatrace.extension.snmp-generic-cisco-device.memory_pool.used | The number of bytes from the memory pool that are currently in use. | Byte |
| Memory pool free (32 bit) | com.dynatrace.extension.snmp-generic-cisco-device.memory_pool.free | The number of bytes from the memory pool that are currently unused. | Byte |
| Memory pool used (64 bit) | com.dynatrace.extension.snmp-generic-cisco-device.enhanced.memory_pool.used | The number of bytes from the enhanced memory pool that are currently in use. | Byte |
| Memory pool free (64 bit) | com.dynatrace.extension.snmp-generic-cisco-device.enhanced.memory_pool.free | The number of bytes from the enhanced memory pool that are currently unused. | Byte |
| Metric name | Metric key | Description | Unit |
|---|---|---|---|
| - | com.dynatrace.extension.snmp-generic-cisco-device.lldp_neighbor | - | - |
| Metric name | Metric key | Description | Unit |
|---|---|---|---|
| Messages delivered | com.dynatrace.extension.snmp-generic-cisco-device.snmp.in.pkts.count | Total number of messages delivered from the transport service | Count |
| Silently dropped PDUs | com.dynatrace.extension.snmp-generic-cisco-device.snmp.silentdrops.count | Number of silently dropped PDUs due to the large reply size | Count |
| Unsupported SNMP version messages | com.dynatrace.extension.snmp-generic-cisco-device.snmp.in.bad.versions.count | Total number of messages delivered with an unsupported SNMP version | Count |
| Messages with bad community names | com.dynatrace.extension.snmp-generic-cisco-device.snmp.in.bad.community.names.count | Number of messages with an unknown SNMP community | Count |
| Messages not allowed in community | com.dynatrace.extension.snmp-generic-cisco-device.snmp.in.bad.community.uses.count | Number of messages not allowed for the used SNMP community | Count |
| 'noSuchName' errors | com.dynatrace.extension.snmp-generic-cisco-device.snmp.in.nosuchnames.count | Number of PDUs delivered with 'noSuchName' error | Count |
| 'badValue' errors | com.dynatrace.extension.snmp-generic-cisco-device.snmp.in.bad.values.count | Number of PDUs delivered with 'badValue' error | Count |
| Metric name | Metric key | Description | Unit |
|---|---|---|---|
| Fan state | com.dynatrace.extension.snmp-generic-cisco-device.envmon.fan.state | Current state of the fan instrumented | Unspecified |
| Fan temperature | com.dynatrace.extension.snmp-generic-cisco-device.envmon.temperature.status.value | Current temperature of the fan instrumented | Unspecified |
| Metric name | Metric key | Description | Unit |
|---|---|---|---|
| - | com.dynatrace.extension.network_device.if.bytes_in.count | - | - |
| - | com.dynatrace.extension.network_device.if.bytes_out.count | - | - |
| - | com.dynatrace.extension.network_device.if.in.errors.count | - | - |
| - | com.dynatrace.extension.network_device.if.in.discards.count | - | - |
| - | com.dynatrace.extension.network_device.if.out.errors.count | - | - |
| - | com.dynatrace.extension.network_device.if.out.discards.count | - | - |
| - | com.dynatrace.extension.network_device.if.lastchange | - | - |
| Metric name | Metric key | Description | Unit |
|---|---|---|---|
| CRC errors | com.dynatrace.extension.snmp-generic-cisco-device.if.in.crc_errors.count | Number of input packets which had cyclic redundancy checksum errors | Count |
| Last interface status change | com.dynatrace.extension.snmp-generic-cisco-device.if.lastchange | Value of 'sysUpTime' when the interface entered its current state | Count |
| Octets received | com.dynatrace.extension.snmp-generic-cisco-device.if.in.octets.count | The total number of octets received on the interface including framing characters | Count |
| Octets transmitted | com.dynatrace.extension.snmp-generic-cisco-device.if.out.octets.count | The total number of octets transmitted out of the interface including framing characters | Count |
| Inbound errors | com.dynatrace.extension.snmp-generic-cisco-device.if.in.errors.count | Number of inbound packets/transmission units with errors | Count |
| Inbound discards | com.dynatrace.extension.snmp-generic-cisco-device.if.in.discards.count | Number of inbound packets discarded | Count |
| Outbound errors | com.dynatrace.extension.snmp-generic-cisco-device.if.out.errors.count | Number of outbound packets/transmission units with errors | Count |
| Outbound discards | com.dynatrace.extension.snmp-generic-cisco-device.if.out.discards.count | Number of outbound packets discarded | Count |
| Metric name | Metric key | Description | Unit |
|---|---|---|---|
| EIGRP peer smooth round trip time | com.dynatrace.extension.snmp-generic-cisco-device.eigrp.peer.srtt | The computed smooth round trip time for packets to and from the peer (milliseconds). CISCO-EIGRP-MIB. | MilliSecond |
| Metric name | Metric key | Description | Unit |
|---|---|---|---|
| TCP active opens | com.dynatrace.extension.snmp-generic-cisco-device.tcp.activeopens.count | Number of transitions of TCP connections from CLOSED to SYN-SENT | Count |
| TCP passive opens | com.dynatrace.extension.snmp-generic-cisco-device.tcp.passiveopens.count | Number of transitions of TCP connections from CLOSED to SYN-RCVD | Count |
| TCP failed attempts | com.dynatrace.extension.snmp-generic-cisco-device.tcp.attemptfails.count | Number of transitions of TCP connections from SYN-SENT/SYN-RCVD to CLOSED and from SYN-RCVD to LISTEN | Count |
| TCP resets | com.dynatrace.extension.snmp-generic-cisco-device.tcp.estab.resets.count | Number of transitions of TCP connections from ESTABLISHED/CLOSE-WAIT to CLOSED | Count |
| TCP connections | com.dynatrace.extension.snmp-generic-cisco-device.tcp.curr.estab | Number of TCP connections in the ESTABLISHED/CLOSE-WAIT state | Count |
| TCP segments received | com.dynatrace.extension.snmp-generic-cisco-device.tcp.hc.in.segs.count | Total number of segments received (including errors) | Count |
| TCP segments sent | com.dynatrace.extension.snmp-generic-cisco-device.tcp.hc.out.segs.count | Total number of segments sent (excluding retransmissions) | Count |
| TCP segments retransmitted | com.dynatrace.extension.snmp-generic-cisco-device.tcp.retrans.segs.count | Total number of segments retransmitted | Count |
| TCP segment errors | com.dynatrace.extension.snmp-generic-cisco-device.tcp.in.errs.count | Total number of segments received in error | Count |
| TCP segment resets | com.dynatrace.extension.snmp-generic-cisco-device.tcp.out.rsts.count | Number of TCP segments sent containing the RST flag | Count |
| UDP datagrams delivered | com.dynatrace.extension.snmp-generic-cisco-device.udp.hc.in.datagrams.count | Total number of UDP datagrams delivered | Count |
| UDP datagrams received without port | com.dynatrace.extension.snmp-generic-cisco-device.udp.noports.count | Number of received UDP datagrams (no application at the destination port) | Count |
| UDP datagram errors | com.dynatrace.extension.snmp-generic-cisco-device.udp.in.errors.count | Number of received and not delivered UDP datagrams (other than no application at the destination port) | Count |
| UDP datagrams sent | com.dynatrace.extension.snmp-generic-cisco-device.udp.hc.out.datagrams.count | Total number of UDP datagrams sent | Count |
| Metric name | Metric key | Description | Unit |
|---|---|---|---|
| Cisco BGP peer established time | com.dynatrace.extension.snmp-generic-cisco-device.cbgp.established_time | This timer indicates how long (in seconds) this peer has been in the established state or how long since this peer was last in the established state. | Second |
| Cisco BGP updates received | com.dynatrace.extension.snmp-generic-cisco-device.cbgp.updates_received_count | The number of BGP UPDATE messages received on the connection with the peer. | Count |
| Cisco BGP updates sent | com.dynatrace.extension.snmp-generic-cisco-device.cbgp.updates_sent_count | The number of BGP UPDATE messages sent on the connection with the peer. | Count |
| Cisco BGP peer state | com.dynatrace.extension.snmp-generic-cisco-device.cbgp.peer.state | The BGP peer connection state. | State |
| Cisco BGP peer admin status | com.dynatrace.extension.snmp-generic-cisco-device.cbgp.peer.admin.status | The desired state of the BGP connection. stop(1), start(2). CISCO-BGP4-MIB. | State |
| Metric name | Metric key | Description | Unit |
|---|---|---|---|
| FRU power operational status | com.dynatrace.extension.snmp-generic-cisco-device.fru.power_oper_status | The FRU power operational status | State |
| FRU fan tray operational status | com.dynatrace.extension.snmp-generic-cisco-device.fru.fan_tray_oper_status | The operational state of the fan or fan tray | State |
| Metric name | Metric key | Description | Unit |
|---|---|---|---|
| BGP peer connection state | com.dynatrace.extension.snmp-generic-cisco-device.bgp4.peer.state | The BGP peer connection state. idle(1), connect(2), active(3), opensent(4), openconfirm(5), established(6). BGP4-MIB. | State |
| BGP peer admin status | com.dynatrace.extension.snmp-generic-cisco-device.bgp4.peer.admin.status | The desired state of the BGP connection. stop(1), start(2). BGP4-MIB. | State |
| BGP peer established time | com.dynatrace.extension.snmp-generic-cisco-device.bgp4.established_time | This timer indicates how long (in seconds) this peer has been in the established state or how long since this peer was last in the established state. | Second |
| Metric name | Metric key | Description | Unit |
|---|---|---|---|
| OSPF neighbor state | com.dynatrace.extension.snmp-generic-cisco-device.ospf.nbr.state | The state of the relationship with this neighbor. down (1), attempt (2), init (3), twoWay (4), exchangeStart (5), exchange (6), loading (7), full (8). OSPF-MIB. | Count |
| Metric name | Metric key | Description | Unit |
|---|---|---|---|
| Time since the last re-start | com.dynatrace.extension.snmp-generic-cisco-device.sys.uptime | The time (in hundredths of a second) since the network management portion of the system was last re-initialized | Unspecified |
| CPU busy | com.dynatrace.extension.snmp-generic-cisco-device.cpm.cpu.total.1min.rev | Overall CPU busy percentage in the last 1 min. | Percent |
| CPU load | com.dynatrace.extension.snmp-generic-cisco-device.cpm.cpu.loadavg.1min | Overall CPU load average in the last 1 min. | Count |
| CPU memory used | com.dynatrace.extension.snmp-generic-cisco-device.cpm.cpu.memory.hc.used | Overall CPU wide sys mem currently under use | KiloByte |
| CPU memory free | com.dynatrace.extension.snmp-generic-cisco-device.cpm.cpu.memory.hc.free | Overall CPU wide sys mem free | KiloByte |
| CPU memory used | com.dynatrace.extension.snmp-generic-cisco-device.cpm.cpu.memory.used | Overall CPU wide sys mem currently under use (legacy 32-bit value) | KiloByte |
| CPU memory free | com.dynatrace.extension.snmp-generic-cisco-device.cpm.cpu.memory.free | Overall CPU wide sys mem free (legacy 32-bit value) | KiloByte |
| Metric name | Metric key | Description | Unit |
|---|---|---|---|
| Power supply state | com.dynatrace.extension.snmp-generic-cisco-device.power_supply.state | A state metric representing the details of power supplies on the device. Value is always 1; use the dimensions to understand the status. | NotApplicable |
| Metric name | Metric key | Description | Unit |
|---|---|---|---|
| Active supervisor CPU utilization | com.dynatrace.extension.snmp-generic-cisco-device.ha.active_supervisor.cpu_utilization | The average utilization of CPU on the active supervisor. | Percent |
| Active supervisor memory utilization | com.dynatrace.extension.snmp-generic-cisco-device.ha.active_supervisor.memory_utilization | The average utilization of memory on the active supervisor. | Percent |
| Synchronization state | com.dynatrace.extension.snmp-generic-cisco-device.ha.synchronization.enabled | The state of the auto synchronization of images between the active and standby supervisor. | State |
| Auto synchronization status | com.dynatrace.extension.snmp-generic-cisco-device.ha.synchronization.state | The status of the current auto synchronization process, or if no such process is in progress, then the state of the most recent one. | State |
| Metric name | Metric key | Description | Unit |
|---|---|---|---|
| - | com.dynatrace.extension.network_device.if.in.multicast_pkts.count | - | - |
| - | com.dynatrace.extension.network_device.if.out.multicast_pkts.count | - | - |
| - | com.dynatrace.extension.network_device.if.in.broadcast_pkts.count | - | - |
| - | com.dynatrace.extension.network_device.if.out.broadcast_pkts.count | - | - |
| - | com.dynatrace.extension.network_device.if.in.ucast_pkts.count | - | - |
| - | com.dynatrace.extension.network_device.if.out.ucast_pkts.count | - | - |
| - | com.dynatrace.extension.network_device.if.in.crc_errors.count | - | - |
| Metric name | Metric key | Description | Unit |
|---|---|---|---|
| Sensor value | com.dynatrace.extension.snmp-generic-cisco-device.sensor.value | The value of sensors as reported in the Cisco entity sensor MIB. The type/unit of the value (e.g. rpm, hertz, celcius) depends on the type of sensor (sensor.type dimension). The sensor.status dimension reports the operational status of the sensor. | Unspecified |
| Metric name | Metric key | Description | Unit |
|---|---|---|---|
| Physical component state | com.dynatrace.extension.snmp-generic-cisco-device.component.state | A state metric representing the details of physical components. This is used to collect details about the Cisco device stack. Value is always 1; use the dimensions to view details. | NotApplicable |
| Metric name | Metric key | Description | Unit |
|---|---|---|---|
| Interface speed | com.dynatrace.extension.snmp-generic-cisco-device.if.highspeed | Speed of the network interface in MegaBits per second. | MegaBitPerSecond |
| Octets received (high capacity) | com.dynatrace.extension.snmp-generic-cisco-device.if.hc.in.octets.count | The total number of octets received on the interface including framing characters. This metric uses 64 bit counter and should be used for highspeed devices. | Count |
| Octets transmitted (high capacity) | com.dynatrace.extension.snmp-generic-cisco-device.if.hc.out.octets.count | The total number of octets transmitted out of the interface including framing characters. This metric uses 64 bit counter and should be used for highspeed devices. | Count |
Requires Dynatrace version 1.338.0 and EEC (ActiveGate) version 1.333.0
Fixes:
snmp.ip field.1.338.0 and a minimum EEC version of 1.333.0.com.dynatrace.extension.snmp-generic-cisco-device.component.state moved from default feature set to new entity-enrichment feature set
⚠️ Metric com.dynatrace.extension.network_device.lldp_neighbor was renamed to com.dynatrace.extension.snmp-generic-cisco-device.lldp_neighbor
to avoid conflicts with generic network topology rules
✨ New in this version:
1.318Advanced interfaces feature set
com.dynatrace.extension.network_device.if.in.multicast_pkts.countcom.dynatrace.extension.network_device.if.out.multicast_pkts.countcom.dynatrace.extension.network_device.if.in.broadcast_pkts.countcom.dynatrace.extension.network_device.if.out.broadcast_pkts.countcom.dynatrace.extension.network_device.if.in.ucast_pkts.countcom.dynatrace.extension.network_device.if.out.ucast_pkts.countnetwork:interface entities created by the extension are named after the ifName (name) OID instead of ifDescr (description) OID. This resolves an issue with Network Neighbors not correctly related at interface level⚠️ Note: any settings/configuration based on the names of network:interface entities may need adjusting due to the above change
Advanced interfaces feature set:
com.dynatrace.extension.network_device.if.lastchangecom.dynatrace.extension.network_device.if.in.crc_errorsdefault feature set and moves them to a new Control plane feature set
com.dynatrace.extension.snmp-generic-cisco-device.sys.uptimecom.dynatrace.extension.snmp-generic-cisco-device.cpm.cpu.total.1min.revcom.dynatrace.extension.snmp-generic-cisco-device.cpm.cpu.loadavg.1mincom.dynatrace.extension.snmp-generic-cisco-device.cpm.cpu.memory.hc.usedcom.dynatrace.extension.snmp-generic-cisco-device.cpm.cpu.memory.hc.freecom.dynatrace.extension.snmp-generic-cisco-device.cpm.cpu.memory.usedcom.dynatrace.extension.snmp-generic-cisco-device.cpm.cpu.memory.freeMetrics in "default" feature set will always be enabled and cannot be disabled. These metrics are mandatory. Take extra caution configuring devices and interfaces for which you are collecting data. Make use of Interface filters to limit the number of interfaces, otherwise, all interfaces on the device will be collected by default.
In case you do not wish to collect interfaces on your device, enter $eq(!) in the "Interface Name" filter field on the Feature Sets screen during configuration.
These metrics introduced into the "default" feature set are per interface and cannot be disabled but can be filtered.
dt.security_context to network:device, network:interface, snmp:com_dynatrace_extension_snmp_generic_cisco_device, and snmp:com_dynatrace_extension_snmp_generic_cisco_network_interface entitiesFRU feature set.Changes:
Fix the problem with metadata for count metrics that are not selected properly.
Fix the problem with validation of screen definition.
Requires Dynatrace v. 1.238.
5min interval changed to 1min.
Dashboard improvements - tile with errors contains a links to device screens.
No release notes
No release notes
Version 1.2.3 allows to run the extension on previous ActiveGate release (1.227)