 GitHub Enterprise - SNMP
GitHub Enterprise - SNMP
Monitor your GitHub Enterprise instance remotely with SNMP.
Extension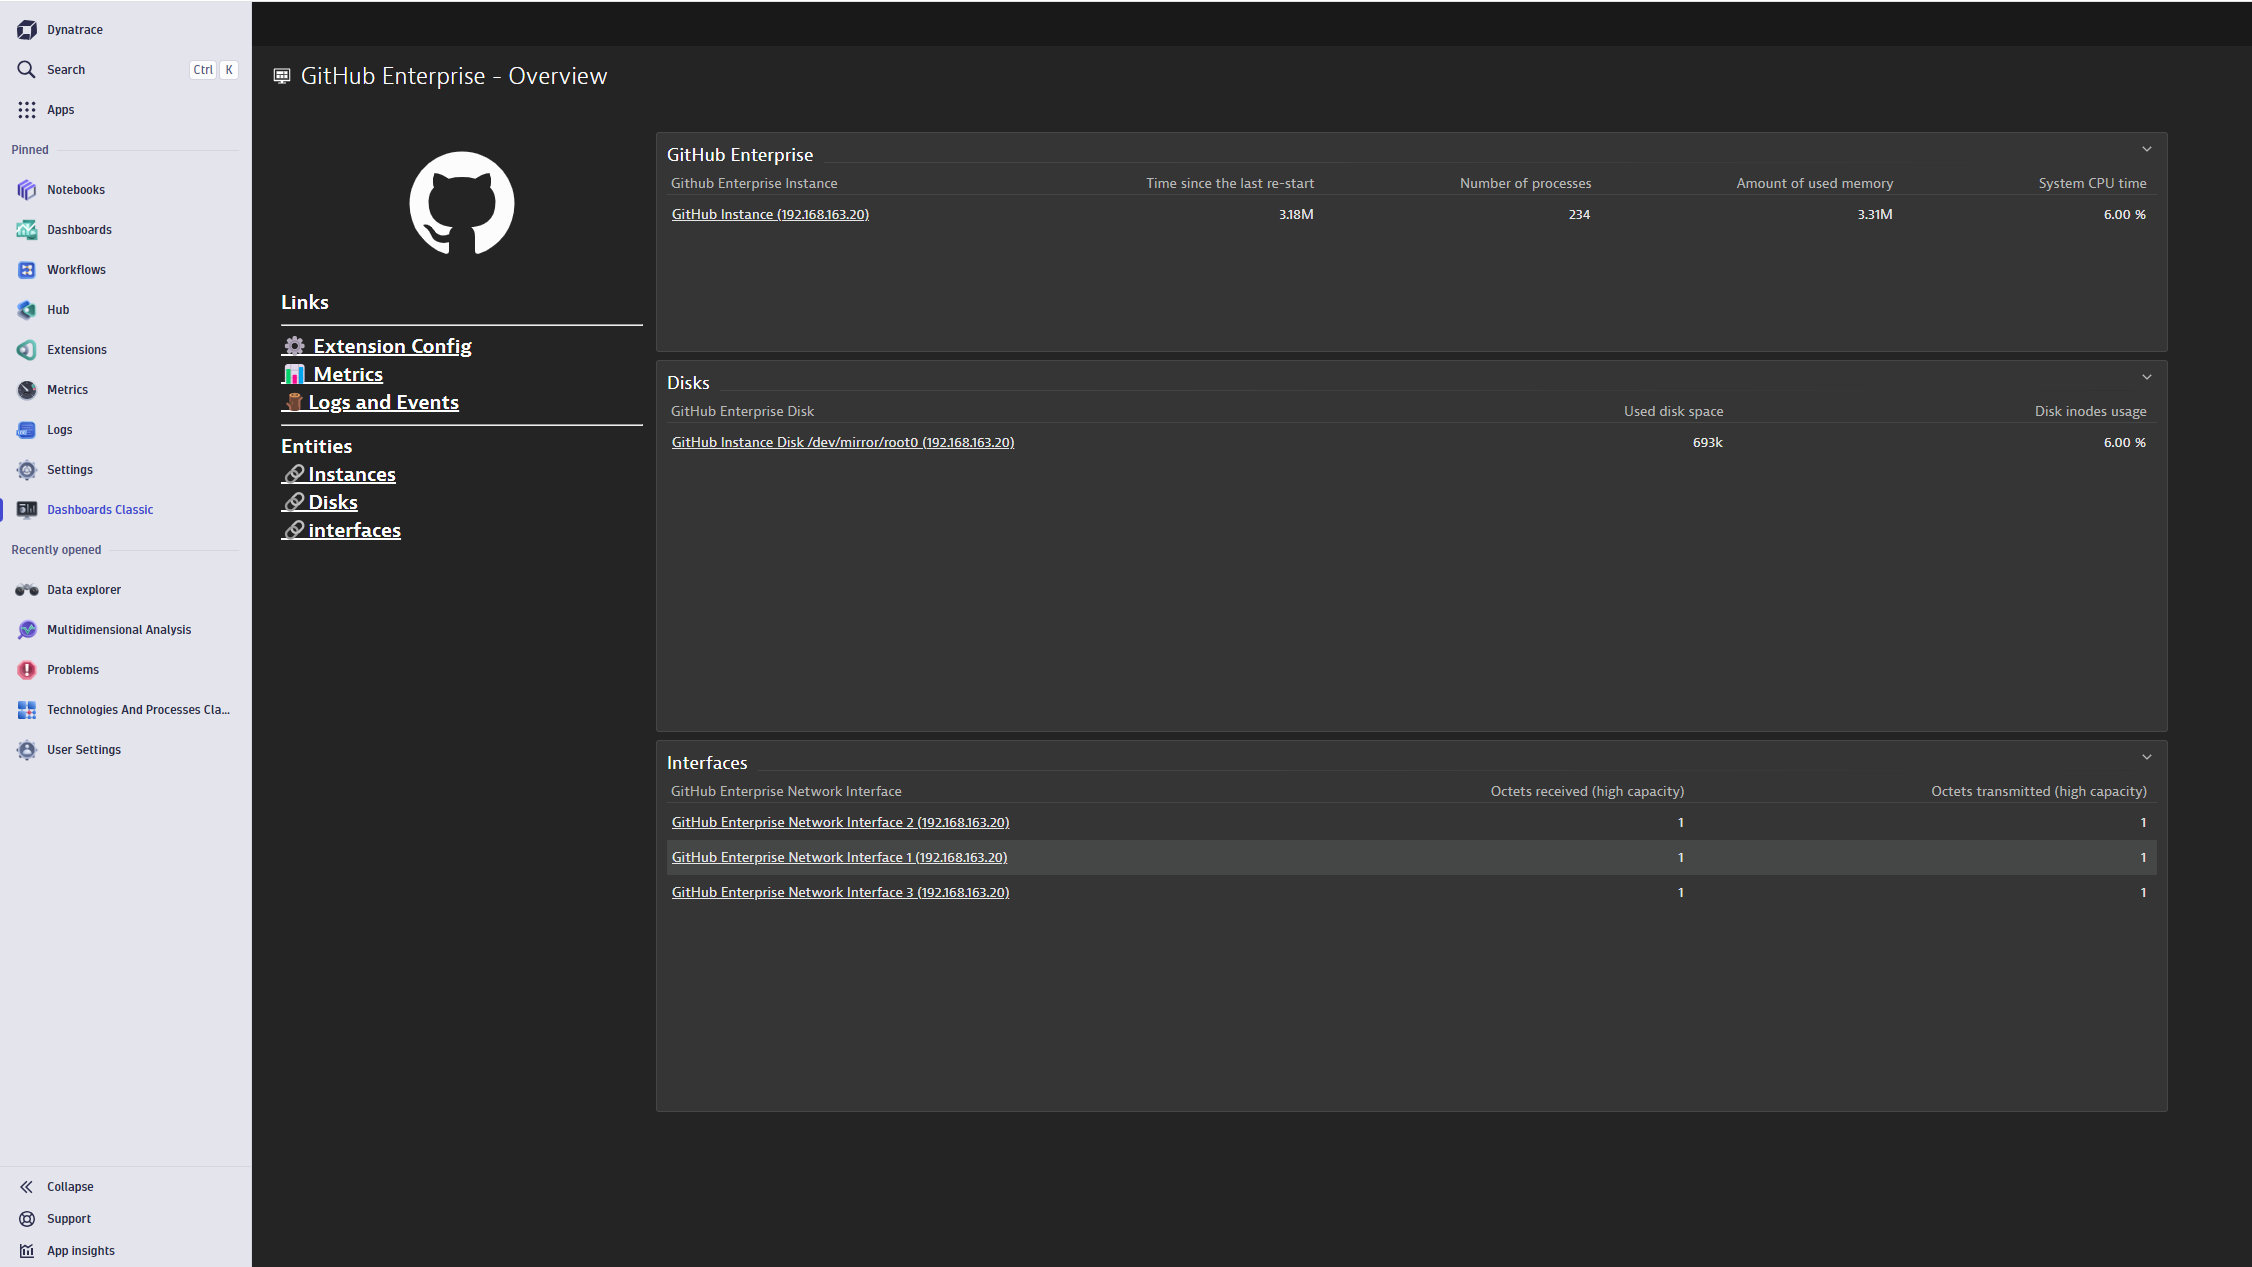
- Product information
- Release notes
Overview
This extension collects infrastructure metrics to provide insights into the resource usage, health and availability of your GitHub Enterprise instances. Metrics are collected through SNMP get polling
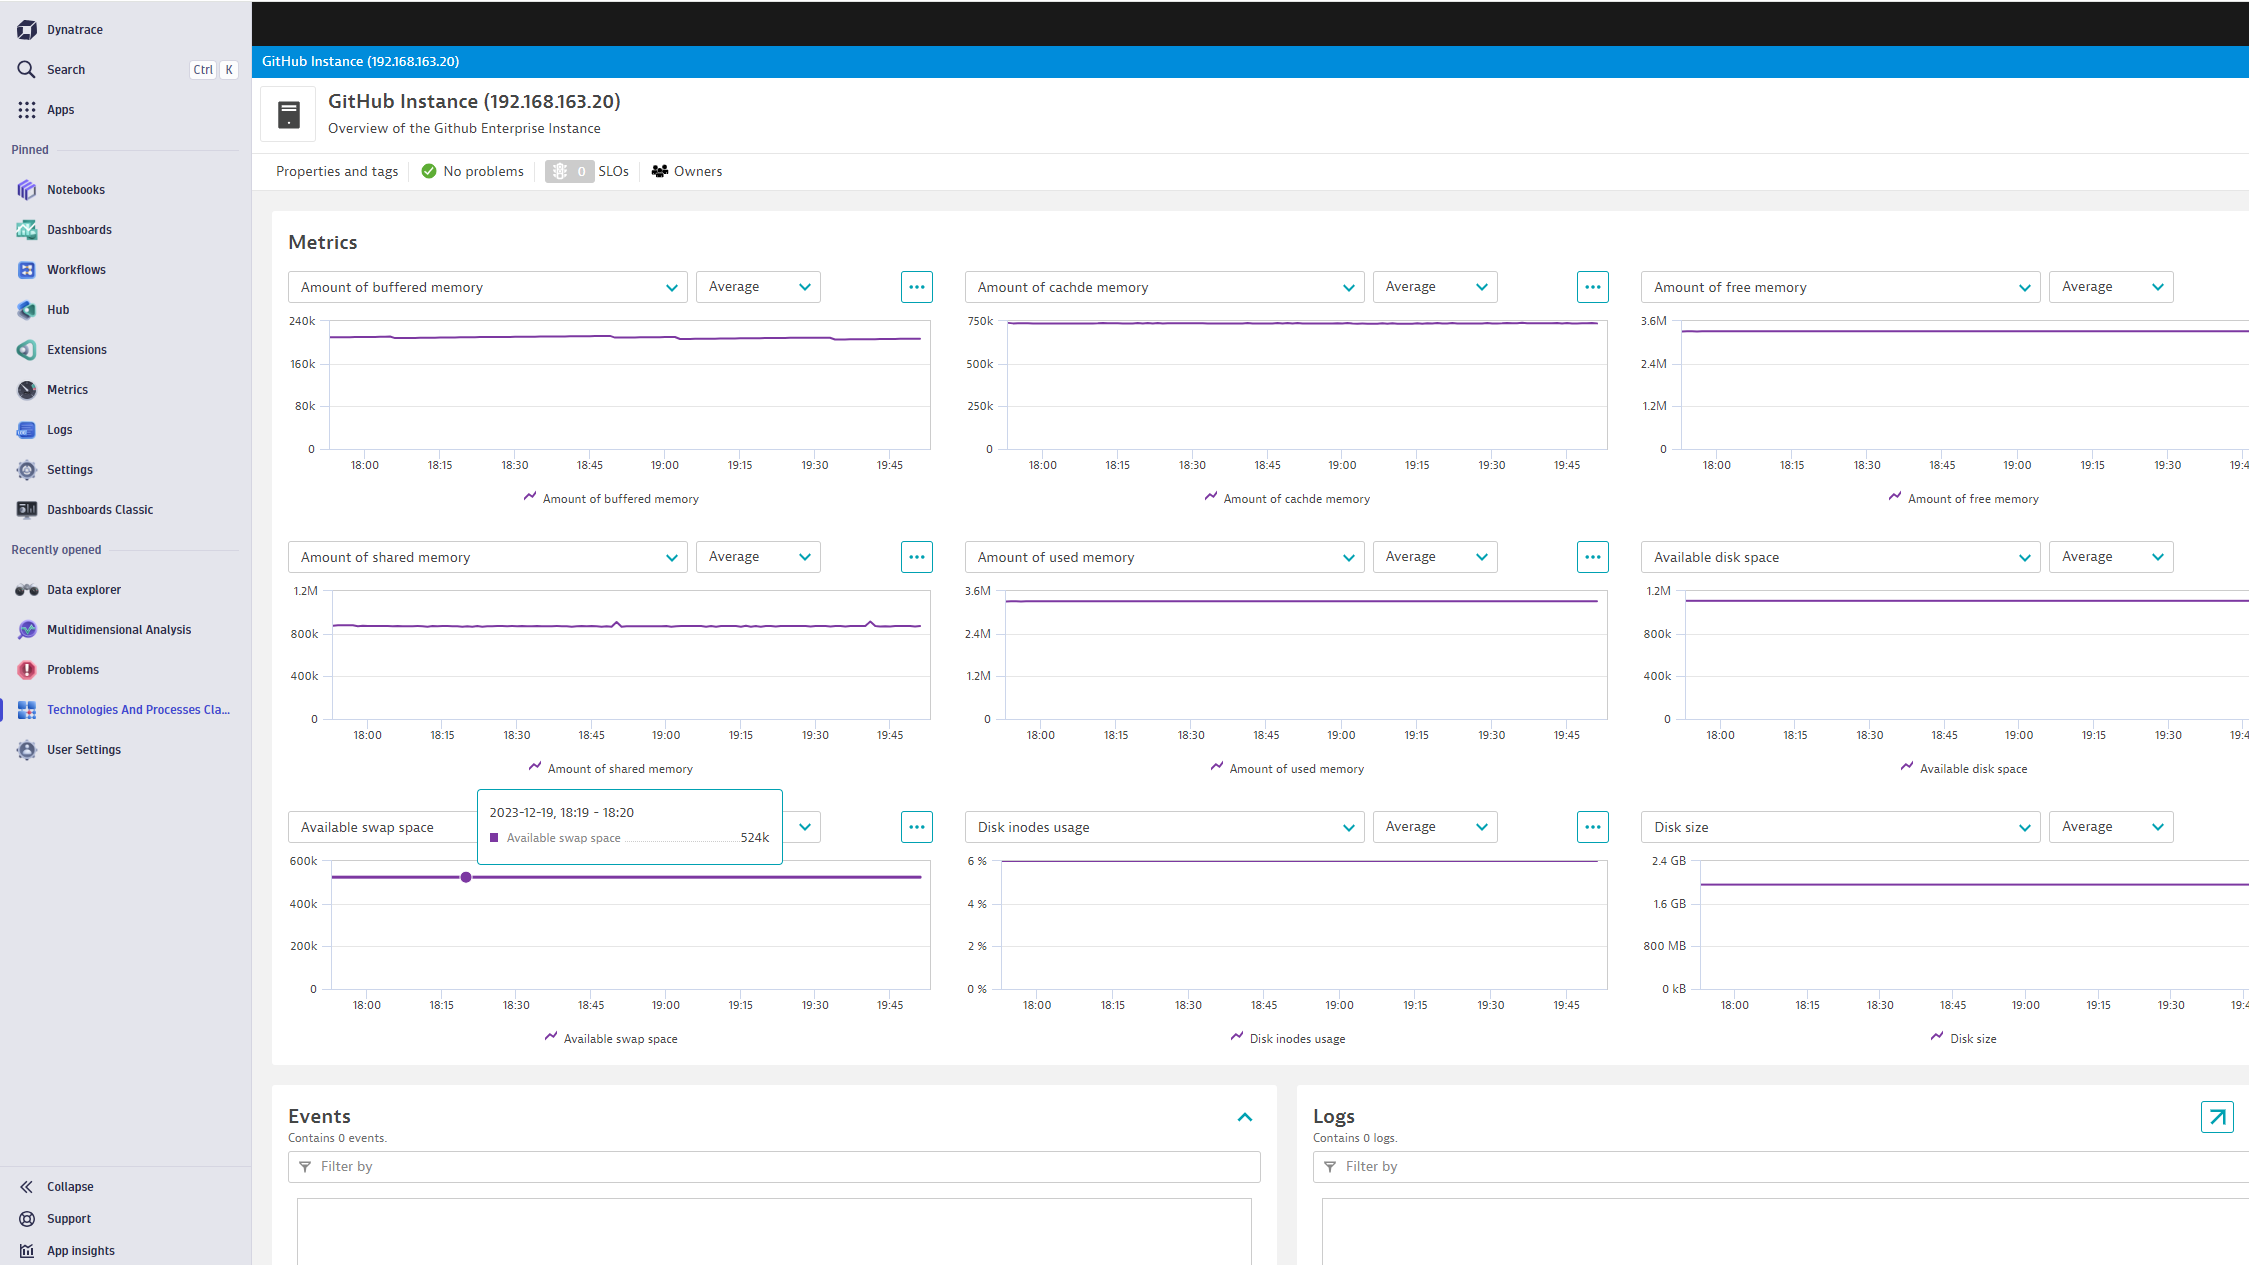
- Instance - CPU, Memory, Disk, Processes, Uptime
- Disk - space, inodes, usage
- Interfaces - bytes (octets) received, transmitted
Use cases
Remotely monitor the infrastructure health of your GitHub Enterprise instances
Get started
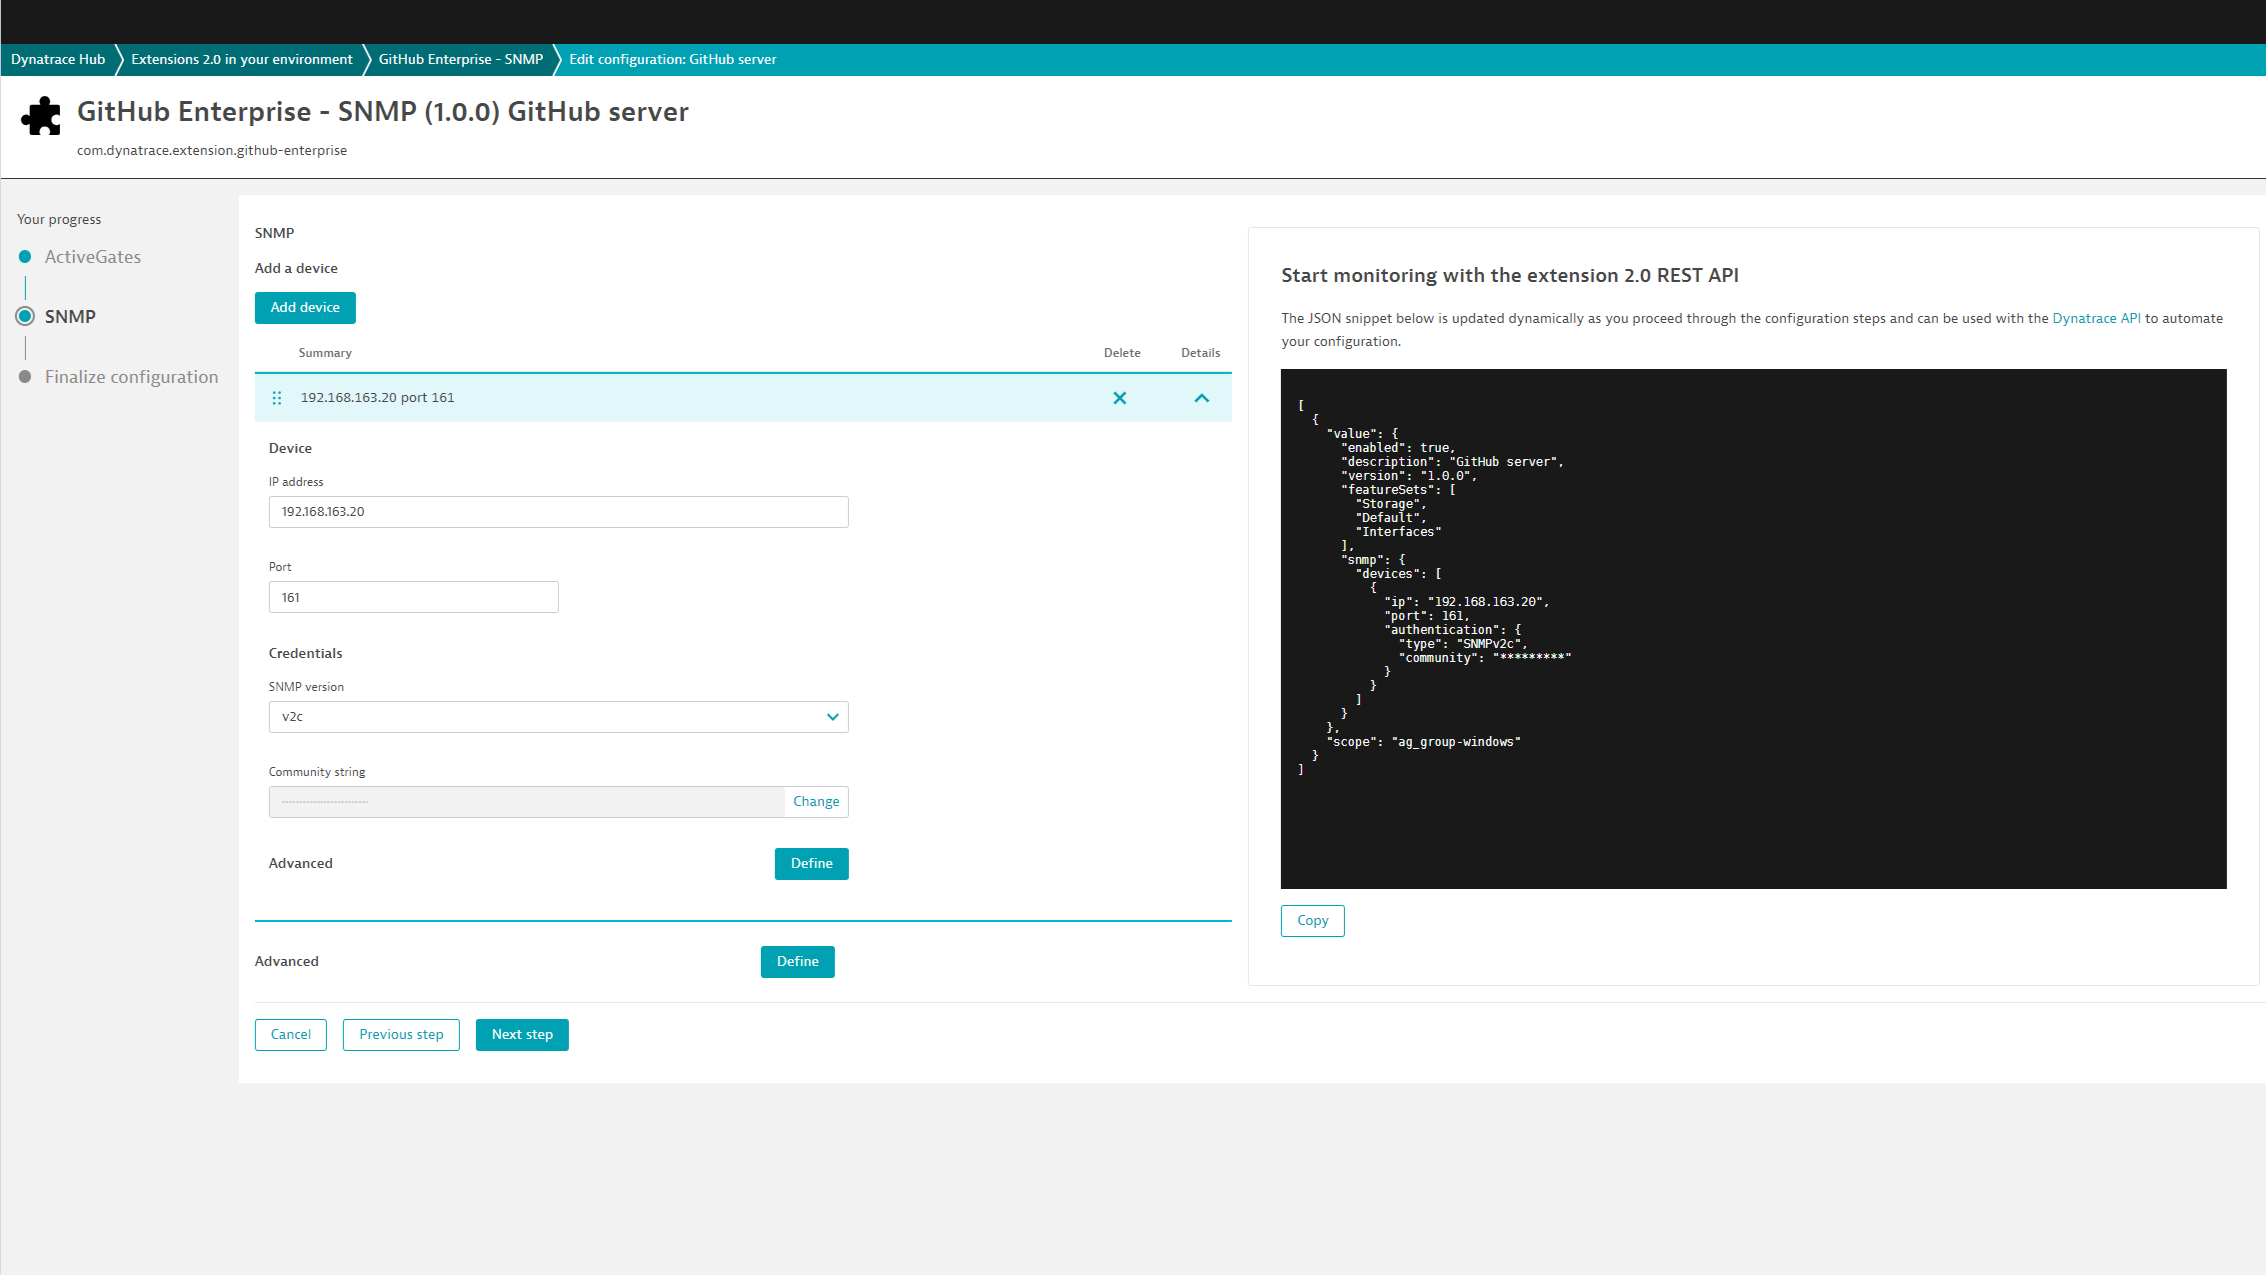
For more information on the installation and configuration, please see GitHub Enterprise - SNMP extension in the Dynatrace Documentation.
Details
Compatibility information
- SNMPv2c and SNMPv3
Feature sets
Below is a complete list of the feature sets provided in this version. To ensure a good fit for your needs, individual feature sets can be activated and deactivated by your administrator during configuration.
Feature setsNumber of metrics included
| Metric name | Metric key | Description | Unit |
|---|---|---|---|
| Time since the last re-start | github.sys.uptime | The time (in hundredths of a second) since the network management portion of the system was last re-initialized | Count |
| Number of processes | github.sys.processes | The number of process contexts currently loaded or running on the host. | Count |
| Host memory | github.memory.size | Amount of RAM on the host | KiloByte |
| Total swap size | github.memory.swap.size | The total amount of swap space configured for this host. | KiloByte |
| Available swap space | github.memory.swap.available | The amount of swap space currently unused or available. | KiloByte |
| Amount of free memory | github.memory.free | The total amount of memory free or available for use on this host. | KiloByte |
| Amount of shared memory | github.memory.shared | The total amount of real or virtual memory currently allocated for use as shared memory. | KiloByte |
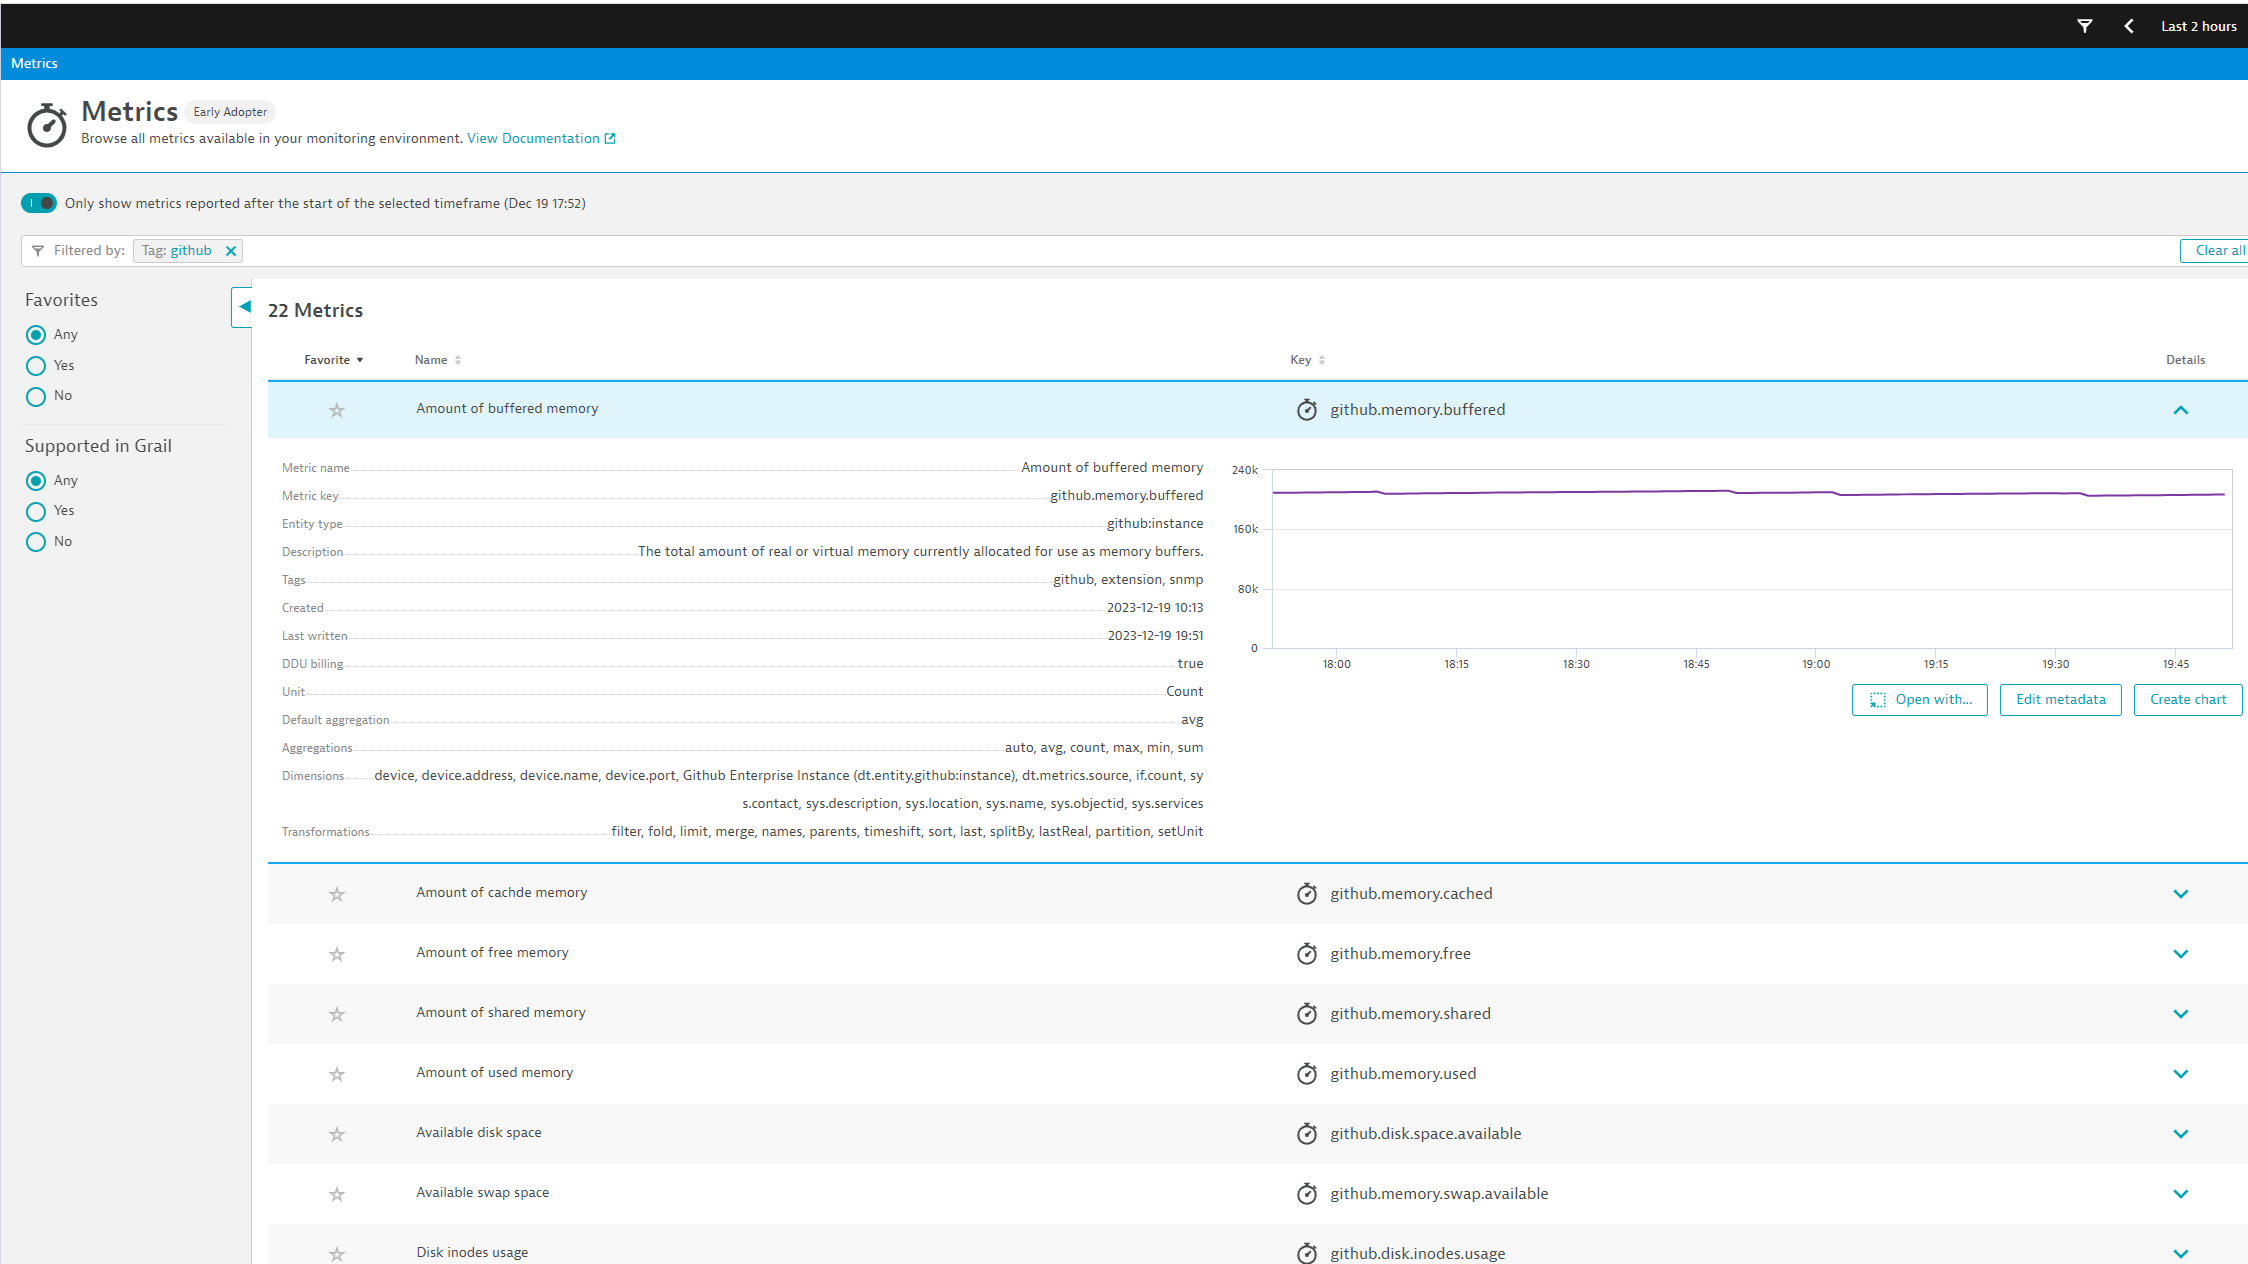
| Amount of buffered memory | github.memory.buffered | The total amount of real or virtual memory currently allocated for use as memory buffers. | KiloByte |
| Amount of cached memory | github.memory.cached | The total amount of real or virtual memory currently allocated for use as cached memory. | KiloByte |
| User CPU time | github.cpu.user.usage | Percentage of user CPU time | Percent |
| System CPU time | github.cpu.system.usage | Percentage of system CPU time | Percent |
| Idle CPU time | github.cpu.idle.usage | Percentages of idle CPU time | Percent |
| Metric name | Metric key | Description | Unit |
|---|---|---|---|
| Octets received (high capacity) | github.if.hc.in.octets.count | The total number of octets received on the interface including framing characters. This metric uses 64 bit counter and should be used for highspeed devices. | Count |
| Octets transmitted (high capacity) | github.if.hc.out.octets.count | The total number of octets transmitted out of the interface including framing characters. This metric uses 64 bit counter and should be used for highspeed devices. | Count |
| Metric name | Metric key | Description | Unit |
|---|---|---|---|
| Disk size | github.disk.size | Total size of the disk/partion | KiloByte |
| Available disk space | github.disk.space.available | Available space on the disk | KiloByte |
| Used disk space | github.disk.space.used | Used space on the disk | KiloByte |
| Disk space usage | github.disk.space.usage | Percentage of space used on disk | Percent |
| Disk inodes usage | github.disk.inodes.usage | Percentage of inodes used on disk | Percent |
Full version history
To have more information on how to install the downloaded package, please follow the instructions on this page.
ReleaseDate
Full version history
- Add platform dashboard
- Update Unified analysis screens for platform apps
- Add dt.security_context
- Fix child_of relationship mappings
- Remove 32 bit counter interface metrics
Full version history
- Update metric unit from Count to KiloByte for disk and memory
- Clean up metric names and descriptions
- Fix the metric
github.memory.usedto report the correct memory used stat. Note the key is now:func:github.memory.used
Full version history
- Bug fix: Poll for additional storage devices
Full version history
- Collect SNMP infrastructure metrics
- Metric metadata
- Custom topology entity types and relationships
- Overview dashboard