

Skip to technology filters Skip to main content
Dynatrace Hub

Extend the platform,
empower your team.

Popular searches:
Home hero bg
Google Artifact RegistryGoogle Artifact Registry
Google Artifact Registry

Google Artifact Registry

Ingest Google Artifact Registry vulnerability findings.

Technology
Free trialDocumentation
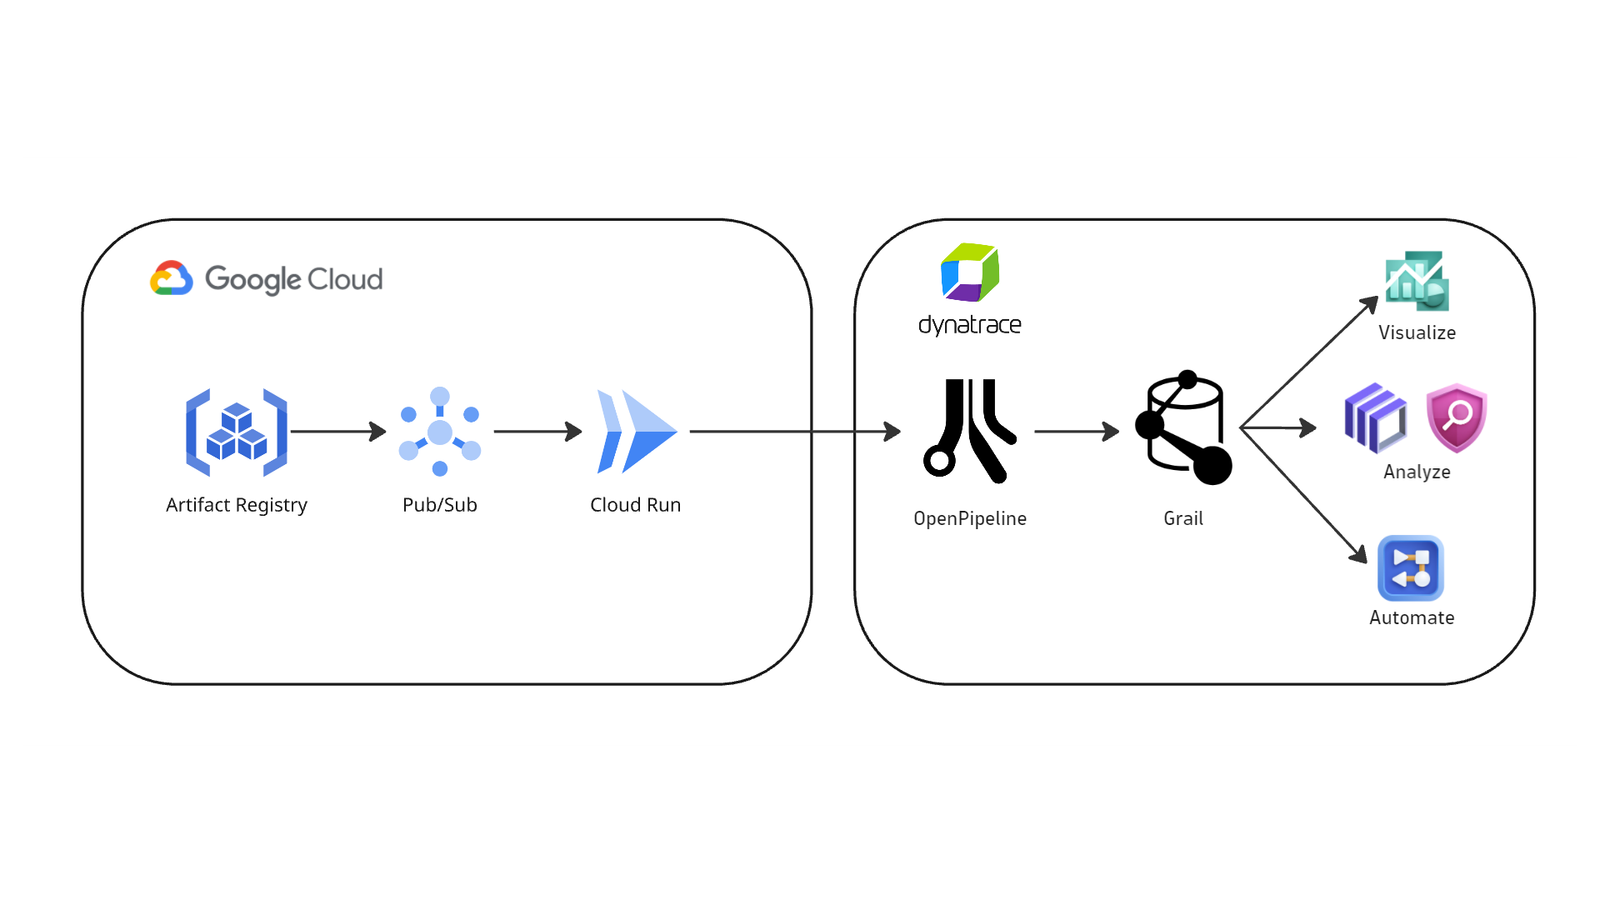
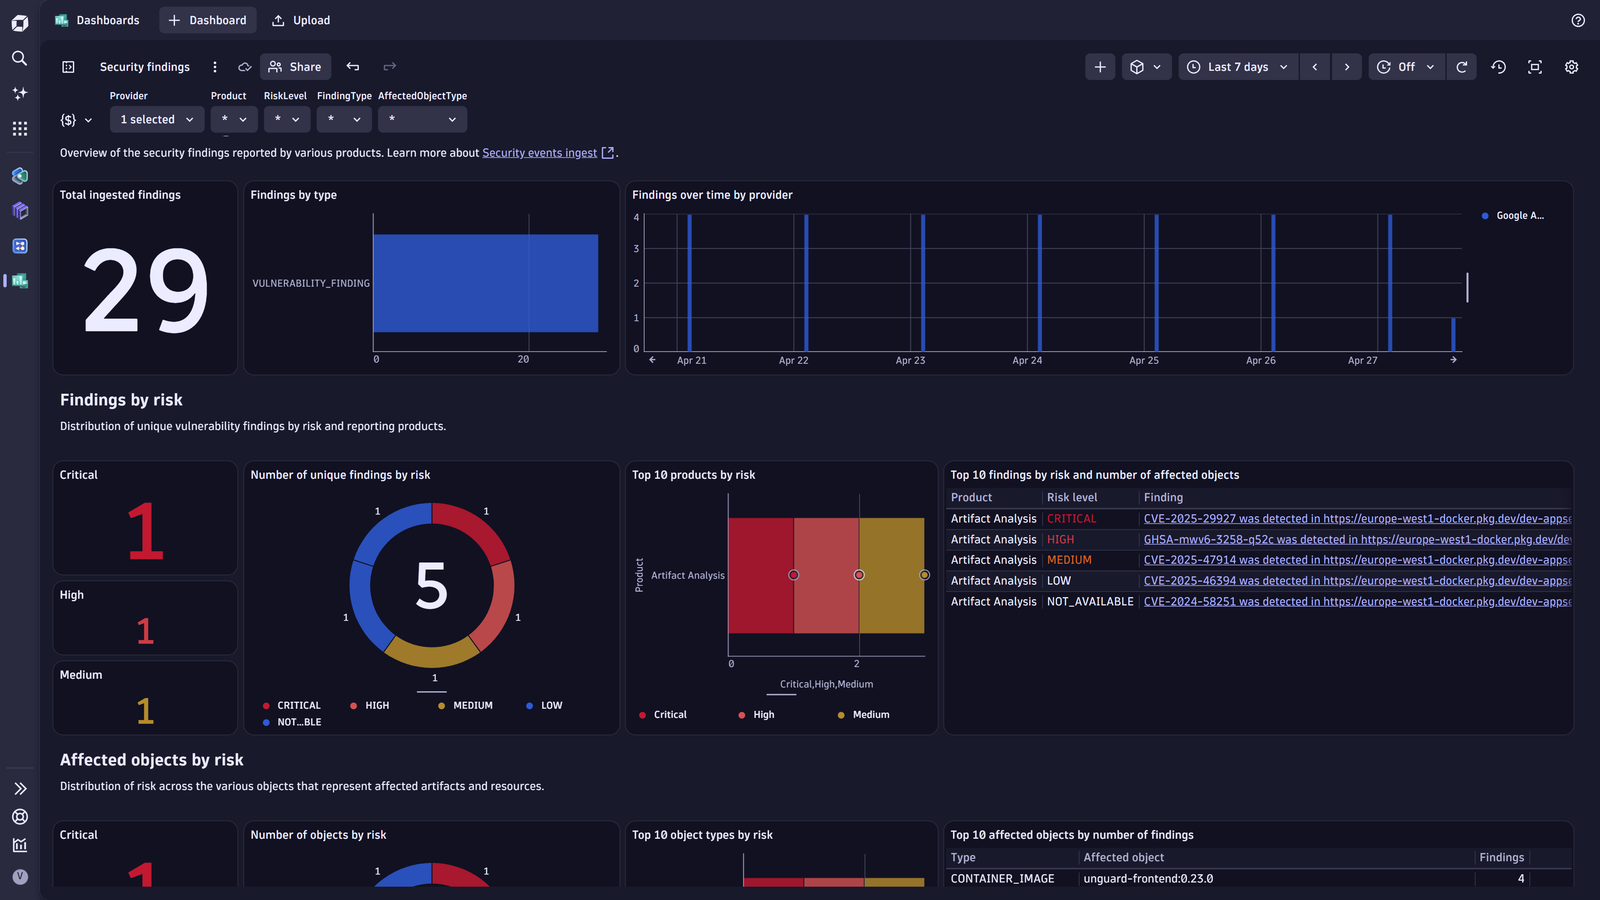
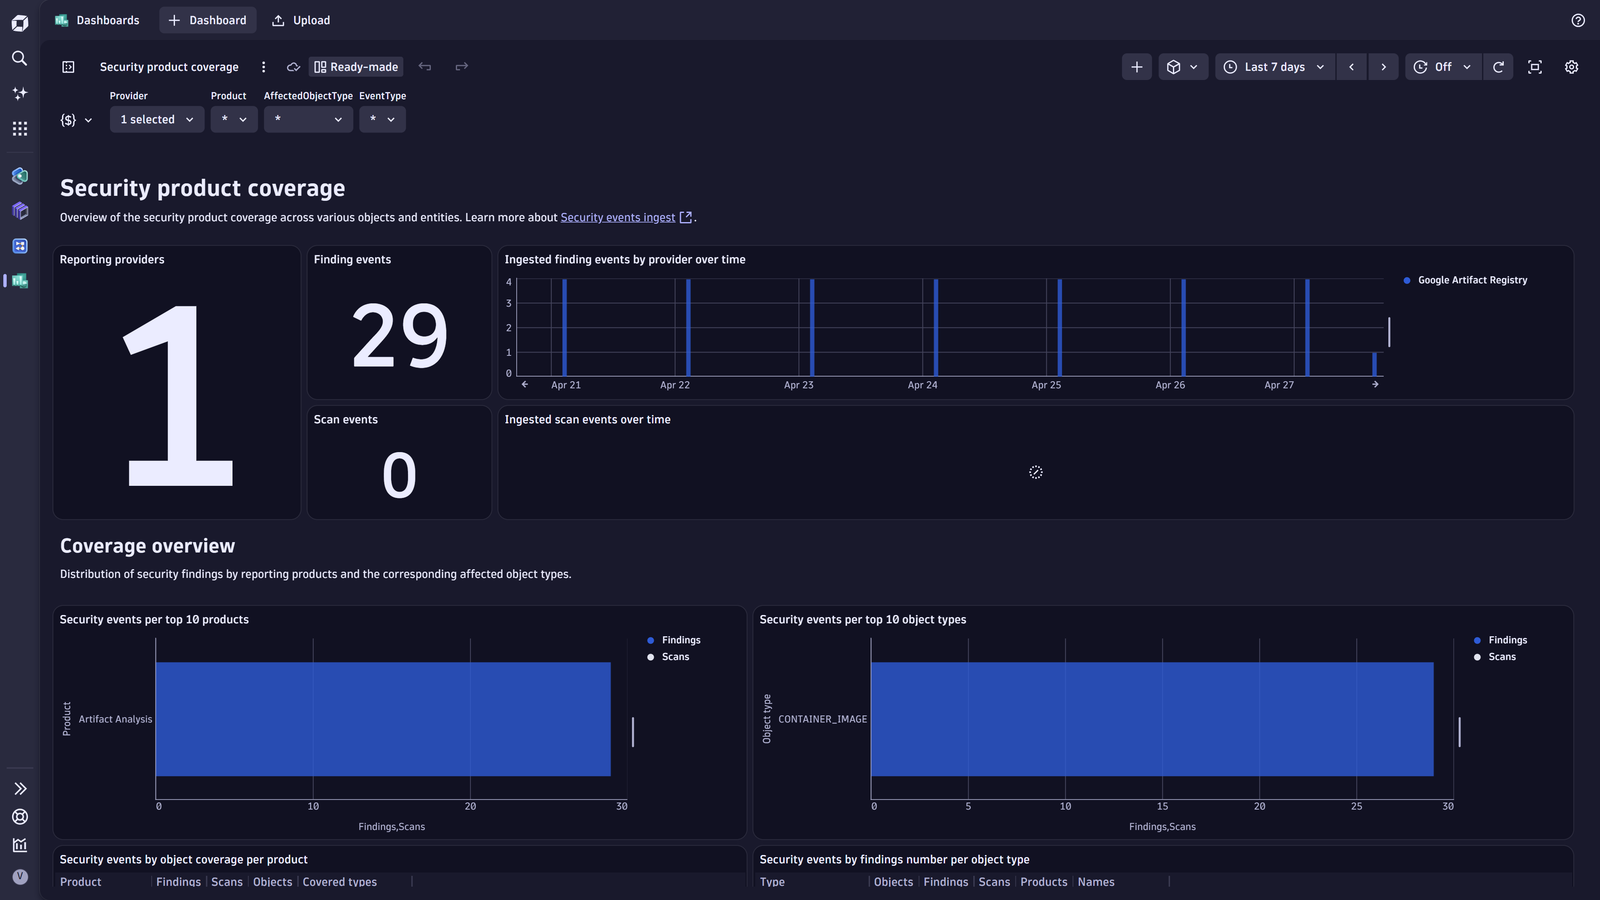
Architecture diagram.Vulnerabilities dashboard.Product coverage dashboard.
  • Product information

Overview

Dynatrace integrates with Google Artifact Registry to allow visibility, orchestration, and prioritization of cross-container registry vulnerability findings.

  • Single pane of glass: Ingest vulnerability findings from Google Artifact Registry into Dynatrace (powered by OpenPipelineâ„¢).

  • Unified analysis: Dynatrace transforms and maps the findings to a unified format for vulnerability findings (powered by Dynatrace Semantic Dictionary).

  • Findings operationalization: Prioritize, visualize, and automate vulnerability findings with runtime context.

  • Unveil blind spots: Discover and eliminate coverage gaps in your Software Development Lifecycle (SDLC).

Use cases

  • Overview: Visualize and report your current security posture and trends around security findings across environments with Dashboards.

  • Prioritization: Analyze and prioritize security findings across multiple tools and products uniformly with Notebooks.

  • Automation: Create notifications and tickets for critical security findings with Workflows.

  • Investigation: Use security findings as an additional dimension for threat hunting and incident forensics using Security Investigator.

Get started

For instructions, go to Ingest Microsoft Defender for Cloud security events.

Details

This integration comes with several sample dashboards and workflows to help you

  • Visualize container vulnerability findings (dashboard)
  • Discover container scanning gaps (dashboard)
  • Automatically create Slack notifications for critical findings (workflow)
  • Automatically create Jira tickets for critical findings (workflow)

Current limitation: To benefit from those ready-made documents, you need to install Microsoft Defender for Cloud integration, and use the corresponding dashboards and workflows.

Dynatrace
DocumentationMore Information
By Dynatrace
Dynatrace support center
Copy to clipboard

Related to Google Artifact Registry

Dashboards logo

Dashboards

Transform complex data into clear visualizations with custom dashboards.

OpenPipeline logo

OpenPipeline

Configure ingest, processing, and persistence of data sent to Grail.

Workflows logo

Workflows

Automate tasks in your IT landscape and move towards autonomous operations.

Dynatrace Hub
Hub HomeBuild your own app
Dynatrace Intelligence - Agentic Operations SystemThe Dynatrace Agentic AI ecosystem
All (914)Log Management and AnalyticsKubernetesAI and LLM ObservabilityInfrastructure ObservabilitySoftware DeliveryApplication ObservabilityApplication SecurityBusiness ObservabilityDigital Experience
Filter
Type
Built and maintained by
Deployment model
SaaS
  • SaaS
  • Managed
Partner FinderBecome a partnerDynatrace Developer

Get data into Dynatrace

Dynatrace supports a wide range of methods for data ingestion. Below are some of the most popular ways to get data into Dynatrace and start observing your whole environment.

Start observing

Hyperscalers

Hyperscalers

Dynatrace seamlessly integrates with all of your hyperscalers and cloud environments.
Read more
OpenTelemetry

OpenTelemetry

Ingest OpenTelemetry traces & metrics, pin them to a dashboard, set alarms, analyze them in the context of metric, log, and diagnostic data.
Read more
OpenPipeline

OpenPipeline

Ingest, process and persist your observability, business and security data from any source in any format and any scale.
Read more

Ingest data using Dynatrace technology

Automatically collects all observability signals with OneAgent, monitor remote extensions, or stay flexible with our versatile API ingest.

OneAgent logo

OneAgent

The simplest way to capture all observation signals automatically and in context.

ActiveGate logo

ActiveGate

Route traffic, monitor clouds and remote technologies & run Synthetic monitors.

Custom Data ingest via API logo

Custom Data ingest via API

Extend Dynatrace with custom ingest APIs.

Get data using these popular technologies

OpenTelemetry logo

OpenTelemetry

Ingest and analyze OTel traces & metrics, set health alerts & view in context.

Prometheus logo

Prometheus

Unlock Prometheus power with intelligent analytics and automated insights.

Micrometer logo

Micrometer

Ingest Spring metrics and put them in context of trace, log and diagnostics data.

Telegraf logo

Telegraf

Monitor hundreds of Telegraf provided plugins and metrics with Dynatrace.

OpenTracing logo

OpenTracing

Ingest and chart OpenTracing data, set alerts, and analyze everything in the context of traces, metrics, logs, and diagnostics data.

StatsD logo

StatsD

The easiest way to get your custom application metrics into Dynatrace.

Stream Log Data

Use these popular Open Source data processing pipelines.

Logstash logo

Logstash

Stream log data from Logstash and analyze it in Dynatrace.

Fluentd logo

Fluentd

Stream log data to Dynatrace via Fluentd for analysis.

Fluent Bit logo

Fluent Bit

Stream logs to Dynatrace via Fluent Bit for analysis and AI observability.

Get data from container platforms

Seamlessly monitor and trace requests of microservices in your container platforms.

See more (5)
Docker logo

Docker

Automated distributed tracing and metrics for microservices running in Docker.

OpenShift Control Plane logo

OpenShift Control Plane

Get insights into your OpenShift control plane with metrics from its components.

containerd logo

containerd

Distributed tracing and metrics for services in containerd in Kubernetes.

VMware Tanzu logo

VMware Tanzu

Harness automation and AI to simplify Kubernetes observability at scale.

Cloud Foundry logo

Cloud Foundry

Harness automation and AI to simplify observability on Cloud Foundry at scale.

Pivotal Platform logo

Pivotal Platform

Multi-cloud platform for the deployment, management, and continuous delivery of applications. Pivotal is now VMware Tanzu.

Get real user monitoring data from mobile and web applications

iOS logo

iOS

Optimize iOS app performance with real-time monitoring and UX insights.

Android logo

Android

Monitor Android app stability, performance, and usage in real-time.

React Native logo

React Native

Monitor mobile applications built with React Native running on iOS or Android.

Mobile logo

Mobile

Analyze real user monitoring data of mobile apps in context with the backend.

OneAgent logo

OneAgent

The simplest way to capture all observation signals automatically and in context.

ActiveGate logo

ActiveGate

Route traffic, monitor clouds and remote technologies & run Synthetic monitors.

Get data from security products and tools

See more (18)
Amazon ECR logo

Amazon ECR

Ingest Amazon Elastic Container Registry vulnerability findings and scan events.

Google Artifact Registry logo

Google Artifact Registry

Ingest Google Artifact Registry vulnerability findings.

OCSF logo

OCSF

Ingest security findings in Open Cybersecurity Schema Framework (OCSF) format.

Tenable logo

Tenable

Ingest Tenable vulnerability findings, scan events, and audit logs.

Snyk logo

Snyk

Ingest Snyk vulnerability findings, scans, and audit logs.

Sonatype Lifecycle logo

Sonatype Lifecycle

Ingest Sonatype vulnerability findings, scans, and audit logs.

Are you looking for something different?

We have hundreds of apps, extensions, and other technologies to customize your environment