





























































Skip to technology filters Skip to main content
Dynatrace Hub

Extend the platform,
empower your team.

Popular searches:
Home hero bg
Microsoft Hyper-V InfrastructureMicrosoft Hyper-V Infrastructure
Microsoft Hyper-V Infrastructure

Microsoft Hyper-V Infrastructure

Monitor health and performance of the Hyper-V clusters, hosts and VMs.

Extension
Free trialDocumentation
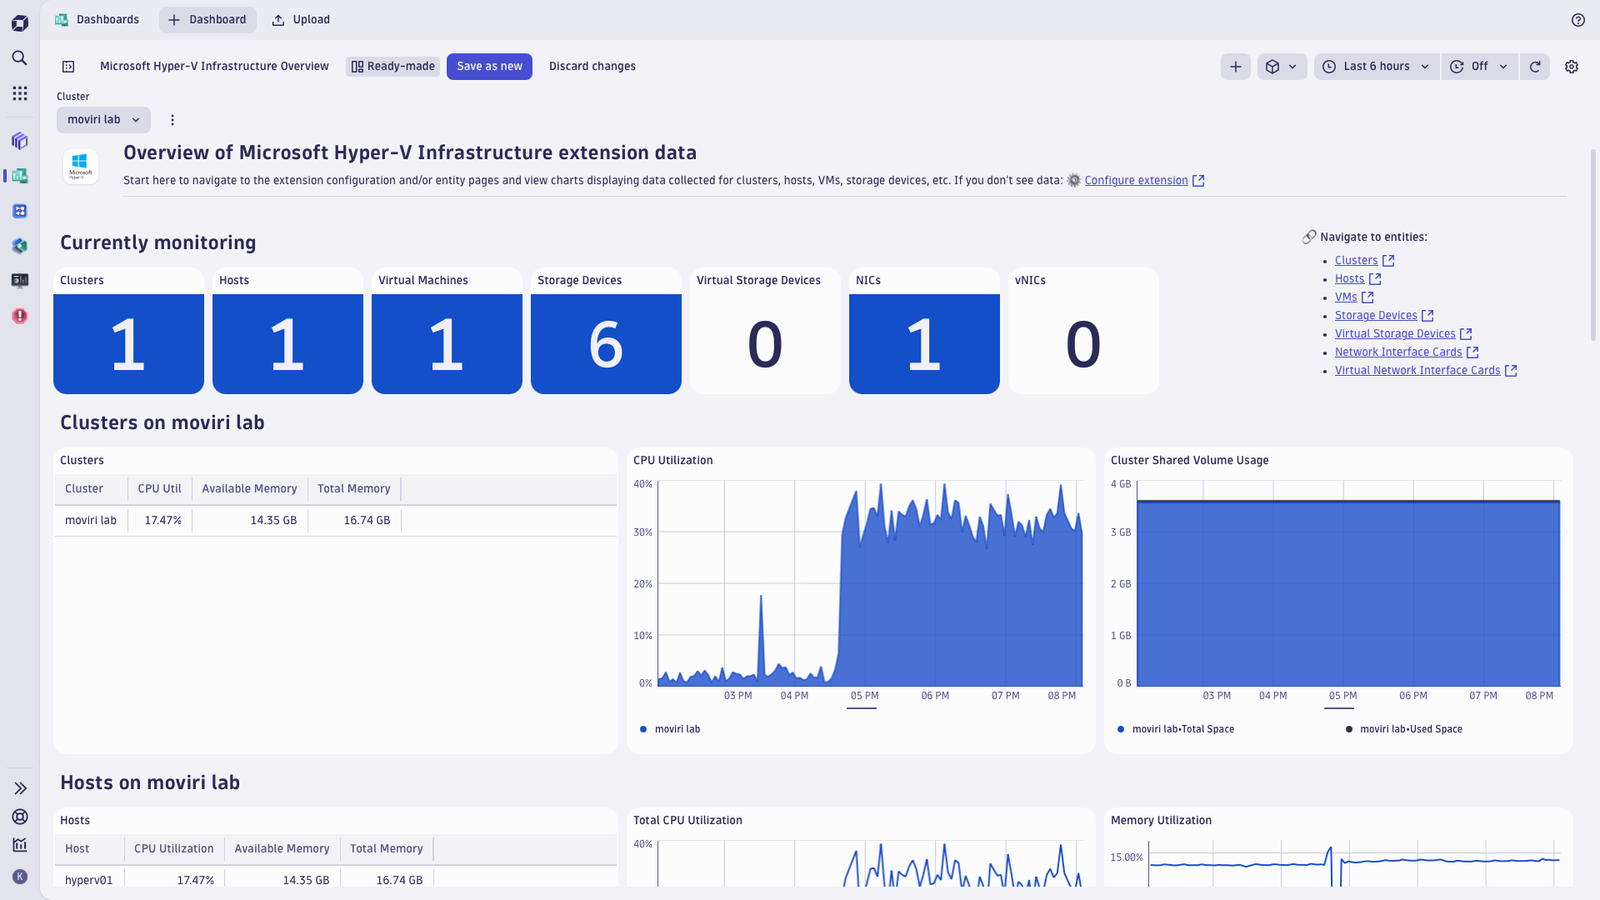
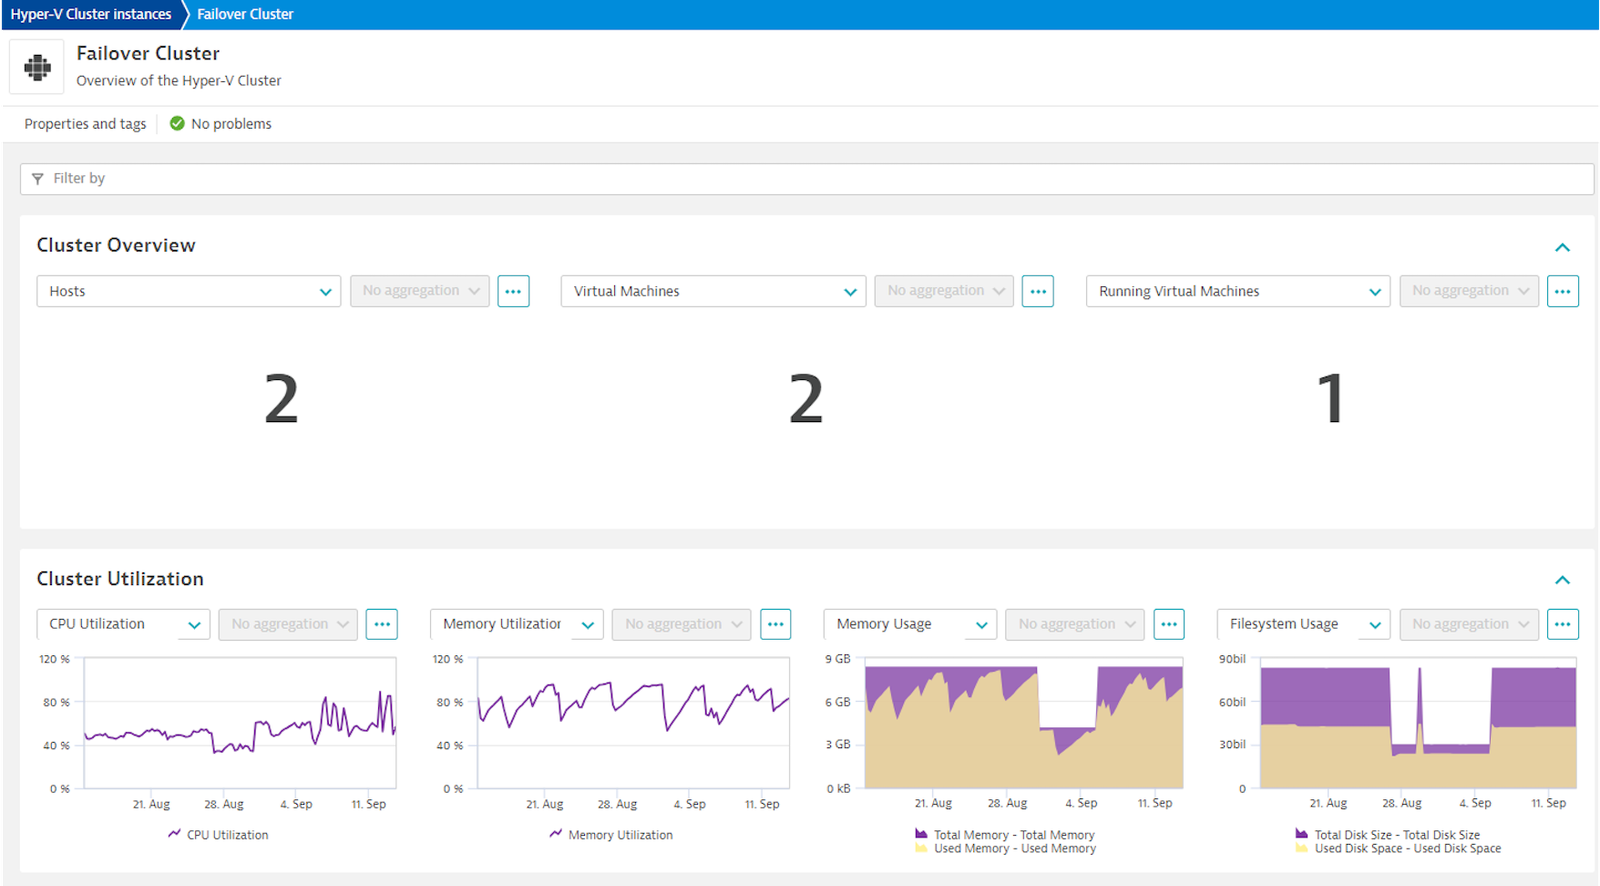
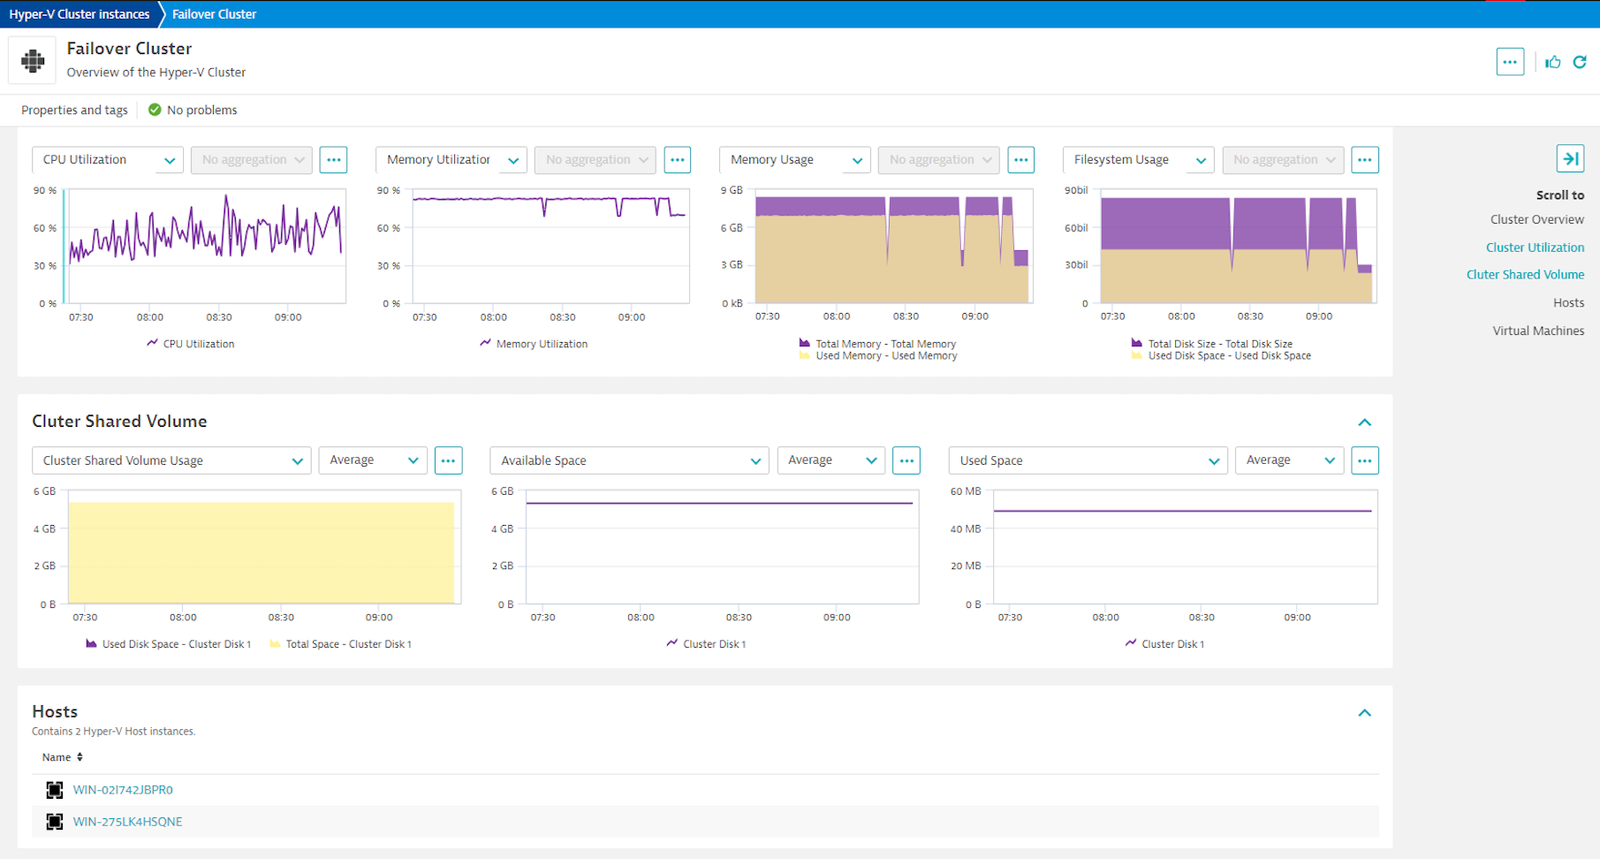
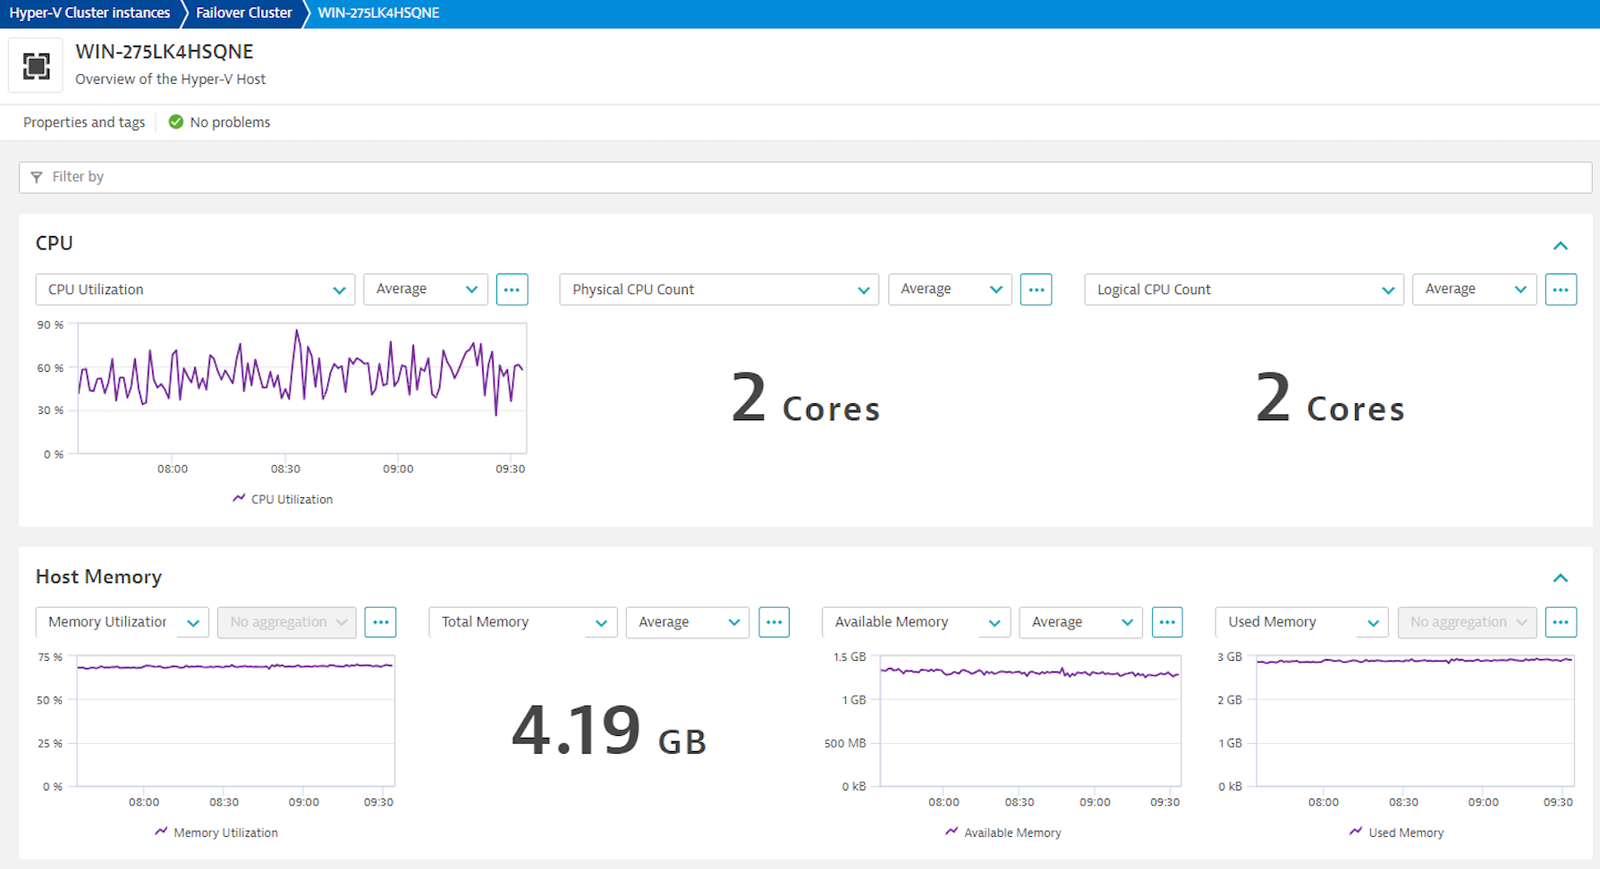
Hyper-V top level dashboardFailover cluster overviewFailover cluster performance metricsHyper-V host overview
  • Product information
  • Release notes

Overview

Get insights into performance of the Hyper-V fabric, tracking health, performance and resource utilization of the Hyper-V VMs, together with the context of their host and cluster resources. Monitor Hyper-V clusters, detect problems ahead of serious impact, and pinpoint the bottlenecks in the virtualization and application layer, including:

  • Processor bottlenecks
  • Memory shortages
  • Network overload
  • Storage shortages
  • Slowness in the dependent applications hosted on the Hyper-V cluster

Hyper-V extension leverages PowerShell cmdlets and WMI queries to collect data from the Windows hypervisor, following best practices employed by Microsoft, as well as Dynatrace customers who contributed to validation of this extension in real-life situations.

Use cases

  • Monitor health and performance of your Hyper-V cluster, using built-in analysis screens and easy-to-navigate dashboards
  • Make sure resources are split optimally between the virtual machines
  • Relate performance of the applications and VMs monitored with OneAgent to the underlying Hyper-V resources allotted to the VMs

Get started

For more information on the installation and configuration, please see Microsoft Hyper-V Infrastructure extension in the Dynatrace Documentation.

Details

Compatibility information

This extension requires:

  • x64 OS with BIOS-activated virtualization:
    • Windows 10 Enterprise/Pro/Education
    • Windows Server 2016 or newer
  • Hyper-V VM Configuration Version 9.0 or higher

Note on topological relationships between discovered Hyper-V VMs and OneAgent-monitored VM instances:

  • This extension maintains SAME_AS relationship between discovered VMs and OneAgent-monitored instances of the guest OS, using IP address as the join property.
  • This relationship enables:
    • Davis AI analytics to look together at metrics obtained by this extension and from OneAgent, to completely characterize monitored guest OS instances performance
    • Discovery and Coverage app to suggest which discovered VMs should be instrumented with OneAgent for full visibility into performance
  • This relationship works for known Windows guest OSes, but has limitations when guest OS is Linux. This limitation stems from the fact that on Hyper-V, Linux guest OS should be instrumented with the Microsoft's Linux Integration Service, while this service supports limited spectrum of the Linux distributions. See the link for details.
Dynatrace
DocumentationMore Information
By Dynatrace
Dynatrace support center
Subscribe to new releases
Copy to clipboard

Feature sets

Below is a complete list of the feature sets provided in this version. To ensure a good fit for your needs, individual feature sets can be activated and deactivated by your administrator during configuration.

Feature setsNumber of metrics included
Metric nameMetric keyDescriptionUnit
Disk Utilizationhyperv.host.disk.disk_util-Percent
Total Disk Sizehyperv.host.disk.total_size-Byte
Used Disk Spacehyperv.host.disk.used_space-Byte
Available Disk Spacehyperv.host.disk.space_free-Byte
Metric nameMetric keyDescriptionUnit
Network Bytes Senthyperv.host.network_interface_card.bytes_sent-BytePerSecond
Network Bytes Receivedhyperv.host.network_interface_card.bytes_received-BytePerSecond
Network Bytes Transferredhyperv.host.network_interface_card.bytes_transferred-BytePerSecond
Metric nameMetric keyDescriptionUnit
Disk Read Ratehyperv.host.disk.read_rate-PerSecond
Disk Write Ratehyperv.host.disk.write_rate-PerSecond
Disk IOPShyperv.host.disk.iops-PerSecond
Metric nameMetric keyDescriptionUnit
Disk Read Ratehyperv.virtual_machine.storage_device.read_rate-PerSecond
Disk Write Ratehyperv.virtual_machine.storage_device.write_rate-PerSecond
Disk IOPShyperv.virtual_machine.storage_device.iops-PerSecond
Metric nameMetric keyDescriptionUnit
Network Packets Senthyperv.host.network_interface_card.packets_sent-BytePerSecond
Network Packets Receivedhyperv.host.network_interface_card.packets_received-BytePerSecond
Network Packets Transferredhyperv.host.network_interface_card.packets_transferred-BytePerSecond
Metric nameMetric keyDescriptionUnit
Total Spacehyperv.cluster_shared_volume.total_space-Byte
Used Disk Spacehyperv.cluster_shared_volume.used_space-Byte
Available Disk Spacehyperv.cluster_shared_volume.free_space-Byte
Read Ratehyperv.cluster_shared_volume.read_rate-PerSecond
Write Ratehyperv.cluster_shared_volume.write_rate-PerSecond
Metric nameMetric keyDescriptionUnit
CPU Utilizationhyperv.host.cpu_utilization-Percent
Logical CPU Counthyperv.host.logical_cpu_count.gauge-Cores
Physical CPU Counthyperv.host.physical_cpu_count.gauge-Cores
CPU Reservehyperv.host.cpu_reserve-Percent
Metric nameMetric keyDescriptionUnit
Network Packets Senthyperv.virtual_machine.network_interface_card.packets_sent-PerSecond
Network Packets Receivedhyperv.virtual_machine.network_interface_card.packets_received-PerSecond
Network Packets Transferredhyperv.virtual_machine.network_interface_card.packets_transferred-PerSecond
Metric nameMetric keyDescriptionUnit
Disk Utilization of the Virtual Hard Disk file according the the Host OShyperv.virtual_machine.storage_device.disk_util-Percent
Free Disk Spacehyperv.virtual_machine.storage_device.free_disk_space-Byte
Total Disk Spacehyperv.virtual_machine.storage_device.total_disk_space-Byte
Used Disk Spacehyperv.virtual_machine.storage_device.used_disk_space-Byte
Metric nameMetric keyDescriptionUnit
Memory Utilizationhyperv.host.memory_util-Percent
Total Memoryhyperv.host.total_memory-KiloByte
Used Memoryhyperv.host.used_memory-Byte
Available Memoryhyperv.host.available_memory-KiloByte
Metric nameMetric keyDescriptionUnit
Network Bytes Senthyperv.virtual_machine.network_interface_card.bytes_sent-BytePerSecond
Network Bytes Receivedhyperv.virtual_machine.network_interface_card.bytes_received-BytePerSecond
Network Bytes Transferredhyperv.virtual_machine.network_interface_card.bytes_transferred-BytePerSecond
Metric nameMetric keyDescriptionUnit
Virtual Machine Counthyperv.host.virtual_machine_count.gauge-Count
Running Virtual Machine Counthyperv.host.running_virtual_machine_count.gauge-Count
Uptimehyperv.host.uptime-Second
Metric nameMetric keyDescriptionUnit
CPU Counthyperv.virtual_machine.cpu_count.gauge-Cores
CPU Reservehyperv.virtual_machine.cpu_reserve-Percent
CPU Utilizationhyperv.virtual_machine.cpu_utilizationCPU Utilization % relative to the hosts total capacity.Percent
Real CPU Utilizationhyperv.virtual_machine.real_cpu_utilizationCPU Utilization % as seen on the VMPercent
Total Memoryhyperv.virtual_machine.total_memory-Byte
Available Memoryhyperv.virtual_machine.available_memory-Byte
Used Memoryhyperv.virtual_machine.used_memory-Byte
Memory Utilizationhyperv.virtual_machine.memory_util-Percent
Memory Pressurehyperv.virtual_machine.memory_pressure-Percent

Related to Microsoft Hyper-V Infrastructure

Microsoft Hyper-V Virtual Machines logo

Microsoft Hyper-V Virtual Machines

Monitor Microsoft Hyper-V virtual machines from the guest OS perspective.

Full version history

To have more information on how to install the downloaded package, please follow the instructions on this page.
ReleaseDate

Full version history

⚠️ WARNING ⚠️️: Possible breaking changes and warnings - PLEASE READ before upgrading:

  • This version requires a minimum Dynatrace version of 1.338.0 and a minimum EEC version of 1.333.0.
  • This version includes a potentially breaking change for Dynatrace on Grail.
    • With the inclusion of OpenPipeline processing rules, any metrics ingested from the extension will be processed by a dedicated OpenPipeline pipeline instead of the default pipeline.
    • This means that any created custom dynamic rules will no longer be used on metrics ingested from the extension. If you want to keep enforcing them, please create pipeline groups.
    • Additionally, some field names are handled differently in OpenPipeline, e.g. capitalization. Please double-check any custom dashboards and alerts you have created for this extension.
    • You must opt-in to OpenPipeline configuration via Settings API – see the documentation.

New in this version:

  • Smartscape on Grail. This extension will populate new Smartscape nodes and edges via OpenPipeline extraction.
  • Added feature set metadata for recommended metrics.

Full version history

Improved in this version

  • Repackaged Python libraries for future Python 3.14 compatibility

Full version history

Improved in this version

  • Improved detection of elevated-privileges user.
  • Removed .NET commands to allow the extension to run even in PowerShell's Constrained Language mode.
  • Resolved issue with dashboard links not opening on pure Gen3 tenants.

Full version history

⚠️ Breaking change

  • The semantic of the hyperv.host.disk.iops metric updated to fix an issue where it reported the sum of read and write data size instead of disk operations. As a result, this metric values lose continuity after the upgrade. Other metrics are not affected by this change.

Improved in this version

  • Resolved an issue with Host CPU utilization metric not matching the value visible on the Hyper-V console.
  • Improved detection of elevated-privileges user.
  • Proper feature-set assignment of all the metrics that were sitting under no feature set.

Full version history

⚠️ Important Change:

  • This release requires a Minimum Dynatrace Version version of 1.318.0 or higher.

New in this version:

  • Added ALERT_TEMPLATES for anomaly detectors in the Davis Anomaly Detection app (latest Dynatrace only).

Full version history

Hyper-V extension release notes

Full version history

3.0.9

Published Thu Dec 4 2025

Patch level changes

  • Expire virtual machines so they don't appear on multiple hosts after a VM has been migrated
  • Clean up the DB to avoid re-ingesting existing datapoints

3.0.7

Published Thu Aug 28 2025

Patch level changes

  • Fixed an issue with improper filtering when the Hyper-V host is not part of a cluster or fails to retrieve the cluster name
  • Refreshed alert definitions

3.0.5

Published Fri Aug 08 2025

⚠️IMPORTANT CHANGES

  1. This extension release requires Dynatrace cluster version 1.313 or later.
  2. The extension now runs with elevated privileges, which requires editing the extensionsuser.conf to allow the extension to run with such privileges. In return, you get much improved scalability and stability of the monitoring. See the tile text for more details.
  3. Breaking change this upgrade will require recreation of the monitoring configurations.

New features

  • Added the ability to interpret entity filters as an allow or deny rule, which simplifies filtering configuration and makes it more flexible.
  • The dt.security_context attribute is now propagated to all entities created by the extension. When enabling entity access control based on dt.security_context ensure you set the Grail security context destination property to dt.security_context.
  • Enabled the extension to present the Dynatrace Platform (a.k.a. Gen3) entity details screens in the future platform apps that will expect these screens.

2.2.39

Published Tue Jun 24 2025

⚠️IMPORTANT CHANGE This extension release requires Dynatrace cluster version 1.310 or later. ⚠️If your Dynatrace cluster is on an earlier version, use previous release of this extension, tagged 2.2.38.

New features

  • Added the Dynatrace Platform (a.k.a. Gen3) dashboard

Plus, carry-on from release 2.2.38

  • Added an option to choose between Interactive and Batch logon types
  • Bug fixes related to the Cluster Shared Volume and Disk metrics reporting
  • Switch to use FQDNs instead of hostnames wherever possible in the cluster and host identification

2.2.38

Published Tue Jun 24 2025

New features

  • Added an option to choose between Interactive and Batch logon types

Patch level changes

  • Bug fixes related to the Cluster Shared Volume and Disk metrics reporting
  • Switch to use FQDNs instead of hostnames wherever possible in the cluster and host identification

2.2.21

Published Thu Mar 27 2025

Patch level changes

  • fixed CPU utilization metric readouts that were artificially inflated for multicore processors

2.2.15

Published Mon Feb 10 2025

New features

  • Added Real CPU Utilization metric

Patch level changes

  • Fixed slow memory leak showing up in some environments where PowerShell calls were not cleared entirely after each execution due to race conditions

2.2.11

Published Fri Aug 16 2024

Patch level changes

  • Changed way of reading the cluster name to PowerShell instead of WMI - to address an issue with access permissions

2.2.10

Published Tue Aug 06 2024

New features

  • Generate a log event when a VM is moved between hosts

Patch level changes

  • Fixed issue with multiple threads modifying the same list of VMs
  • Improve error handling for WMI queries

2.2.5

Published Fri Jul 12 2024

Patch level changes

  • Added ability to set a debug log level and the collection frequency
  • A fix for an incorrect count of VMs on one of the UA screens

2.2.4

Published Wed Jul 03 2024

Patch level changes

  • Fix locks that hindered performance and clean up the VM stats

2.0.15

Published Wed May 15 2024

New features

  • Added option to use the credential vault to manage user credentials required by the extension

Patch level changes

  • Split VM collection into 3 separate "query" methods to improve execution time
  • Added sourceEntityType for all metrics

2.0.14

Published Fri Apr 05 2024

Patch level changes

  • Fixed alert json for func metrics since they were using metricId instead of metricSelector.

2.0.13

Published Thu Apr 04 2024

New features

  • Added SAME_AS relationship between discovered VMs and OneAgent-monitored instances of the guest OS, using IP address as the join property. This relationship enables
    • Davis AI analytics to look together at metrics obtained by this extension and from OneAgent, to completely characterize monitored guest OS instances performance
    • Discovery and Coverage app to suggest which discovered VMs should be instrumented with OneAgent for full visibility into performance

Patch level changes

  • Stated the requirement that Windows user account who runs the extension requires Read and Write access to the Windows TEMP directory.

2.0.12

Published Mon Feb 26 2024

New features

  • This release introduces an important change Hyper-V extension requires local activation now (i..e. activation on an OneAgent-instrumented host).
  • Previous releases allowed remote installation (i.e. activation on an ActiveGate), but because of Hyper-V specifics, this very often caused permission issues that severely limited extension functionality and weren't solvable. So anyway - we have been advising you to move to local activation. Now it's the only way to activate this extension.

Patch level changes

  • Additionally, this release fixes some issues with filtering monitored entities.

2.0.10

Published Fri Feb 09 2024

Patch level changes

  • Fixed reporting of the rate metrics and occasional issues with metric extraction from nested environments.

2.0.3

Published Wed Nov 29 2023

Patch level changes

  • Fixed a bug affecting extension activation under certain conditions. Extension logs on affected systems reported "AttributeError 'dict' object has no attribute 'feature_sets' "

2.0.0

Published Wed Sep 27 2023

Dynatrace Hub
Hub HomeGet data into DynatraceBuild your own app
Dynatrace Intelligence - Agentic Operations SystemThe Dynatrace Agentic AI ecosystem
All (914)Log Management and AnalyticsKubernetesAI and LLM ObservabilitySoftware DeliveryApplication ObservabilityApplication SecurityBusiness ObservabilityDigital Experience
Filter
Type
Built and maintained by
Deployment model
SaaS
  • SaaS
  • Managed
Partner FinderBecome a partnerDynatrace Developer

Infrastructure Observability

Get automatic and intelligent observability across cloud and hybrid environments with continuous auto-discovery of any type of infrastructure, all in context and with precise, AI-powered answers.

Essentials

Get automatic and intelligent infrastructure monitoring and observability across hybrid and cloud environments.

OneAgent logo

OneAgent

The simplest way to capture all observation signals automatically and in context.

Discovery & Coverage logo

Discovery & Coverage

Ensure enterprise-wide visibility. Discover and remediate coverage gaps.

Infrastructure & Operations logo

Infrastructure & Operations

Detailed hosts, process, and network insights across the entire environment.

Databases logo

Databases

Monitor databases, prevent issues, and resolve incidents quickly in real time.

Clouds logo

Clouds

Gain full visibility and proactive monitoring across your cloud infrastructure.

Hybrid cloud

AWS logo

AWS

Reliable, scalable, and inexpensive cloud computing services.

Microsoft Azure logo

Microsoft Azure

Cloud computing service for building, testing, deploying, and managing services.

Google Cloud logo

Google Cloud

Meet your business challenges head on with cloud computing services from Google.

VMware logo

VMware

Monitor health and performance of VMware virtual machines.

Nutanix Clusters logo

Nutanix Clusters

Monitor Nutanix clusters' performance, usage and availability, with Nutanix API.

Microsoft Hyper-V Infrastructure logo

Microsoft Hyper-V Infrastructure

Monitor health and performance of the Hyper-V clusters, hosts and VMs.

Technology coverage

F5 BIG-IP logo

F5 BIG-IP

Gain insights into the performance of your F5 BIG-IP LTM and DNS solutions.

Oracle Database logo

Oracle Database

Observe, analyze and optimize the usage, health and performance of your database.

Microsoft SQL Server logo

Microsoft SQL Server

Improve the health and performance monitoring of your Microsoft SQL Servers.

Also popular

See more (5)
Juniper Networks (SNMP) logo

Juniper Networks (SNMP)

Gain insights into the performance of your Juniper networking solutions.

SNMP Traps logo

SNMP Traps

Supplement network monitoring with event-based data reported via SNMP Traps.

Generic Cisco Device logo

Generic Cisco Device

Monitor Cisco devices using SNMP to feed Dynatrace with metrics and alerts.

Palo Alto firewalls logo

Palo Alto firewalls

Palo Alto extension for problems detection.

Remote Windows Host Monitoring logo

Remote Windows Host Monitoring

Monitor health and performance of Windows Hosts without installing an agent.

AWS Lambda logo

AWS Lambda

Automatic and intelligent end-to-end observability of AWS Lambda traces and logs.

More resources

Amazon API Gateway logo

Amazon API Gateway

Service for developers to create, publish, maintain, monitor, and secure APIs.

Amazon AppStream 2.0 logo

Amazon AppStream 2.0

Fully managed application streaming service that provides users with instant access to their desktop applications from anywhere.

Amazon Athena logo

Amazon Athena

Interactive query service that makes it easy to analyze data directly in Amazon S3 using standard SQL.

Amazon Aurora logo

Amazon Aurora

Relational database service developed and offered by Amazon Web Services.

Amazon CloudFront logo

Amazon CloudFront

Content delivery network offered by Amazon Web Services.

Amazon CloudSearch logo

Amazon CloudSearch

Set up, manage, and scale a search solution for your website or application using CloudSearch.

Amazon CloudWatch Logs logo

Amazon CloudWatch Logs

Monitor, store, and access your log files from instances, AWS CloudTrail, Route 53, and other sources.

Amazon Cognito logo

Amazon Cognito

Add user sign-up, sign-in, and access control to your web and mobile apps quickly and easily.

Amazon Connect logo

Amazon Connect

Easy to use omnichannel cloud contact center that helps you to provide superior customer service at a lower cost.

Amazon DocumentDB logo

Amazon DocumentDB

Amazon DocumentDB (with MongoDB compatibility) is a fast, reliable, and fully managed database service.

Amazon DynamoDB Accelerator (DAX) logo

Amazon DynamoDB Accelerator (DAX)

Fully managed, highly available, in-memory cache for your Amazon DynamoDB.

Amazon EC2 Auto Scaling logo

Amazon EC2 Auto Scaling

Amazon EC2 Auto Scaling helps you ensure that you have the correct number of Amazon EC2 instances available.

Amazon EC2 Spot Fleet logo

Amazon EC2 Spot Fleet

Spot Instances and On-Demand Instances to meet the target capacity that you specified.

Amazon Elastic Container Service (ECS) logo

Amazon Elastic Container Service (ECS)

Fully managed container orchestration service.

Amazon Elastic File Service (EFS) logo

Amazon Elastic File Service (EFS)

Cloud storage service provided by Amazon Web Services.

Amazon Elastic Transcoder logo

Amazon Elastic Transcoder

Convert and transcode media files stored in Amazon S3.

Amazon ElastiCache logo

Amazon ElastiCache

Fully managed, Redis- and Memcached-compatible service delivering real-time performance for modern applications by Amazon Web Services.

Amazon Elasticsearch Service logo

Amazon Elasticsearch Service

Fully managed service to deploy, secure, and run Elasticsearch cost effectively at scale, without the operational overhead.

Amazon EMR logo

Amazon EMR

Cloud big data platform for processing vast amounts of data using open source tools.

Amazon EventBridge logo

Amazon EventBridge

Serverless event bus to connect applications together using data from your own applications, integrated SaaS applications, and AWS services.

Amazon FSx for Lustre logo

Amazon FSx for Lustre

Makes it easy and cost-effective to launch and run the popular, high-performance Lustre file system.

Amazon FSx for Windows File Server logo

Amazon FSx for Windows File Server

Provides a managed Microsoft Windows file servers, backed by a native Windows file system.

Amazon GameLift logo

Amazon GameLift

Enables developers to deploy, operate, and scale dedicated, low-cost servers in the cloud for session-based, multiplayer games.

Amazon Inspector logo

Amazon Inspector

Tests the network accessibility of your EC2 instances and the security state of your applications that run on those instances.

AWS IoT logo

AWS IoT

Run local compute, messaging, data caching, and machine learning inference capabilities.

Amazon Keyspaces for Apache Cassandra logo

Amazon Keyspaces for Apache Cassandra

Scalable, highly available, and managed Apache Cassandra–compatible database service.

Amazon Kinesis Data Analytics logo

Amazon Kinesis Data Analytics

Transform and analyze streaming data in real time with open source framework and engine for processing data streams (Apache Flink).

Amazon Kinesis Data Firehose logo

Amazon Kinesis Data Firehose

Fully managed service for delivering real-time streaming data.

Amazon Kinesis Data Streams logo

Amazon Kinesis Data Streams

Collect log and event data from sources such as servers, desktops, and mobile devices.

Amazon Kinesis Video Streams logo

Amazon Kinesis Video Streams

Provides you SDKs to install on your devices to make it easy to stream media.

Amazon Lex logo

Amazon Lex

Service for building conversational interfaces for applications using voice and text.

Amazon MQ logo

Amazon MQ

Managed message broker service for Apache ActiveMQ that makes it easy to migrate to a message broker in the cloud.

Amazon MSK logo

Amazon MSK

Fully managed service that enables you to build and run applications that use Apache Kafka to process streaming data.

Amazon Neptune logo

Amazon Neptune

Fast, reliable, fully managed graph database built for highly connected datasets.

Amazon Polly logo

Amazon Polly

Cloud service that converts text into lifelike speech.

Amazon Quantum Ledger Database (QLDB) logo

Amazon Quantum Ledger Database (QLDB)

Ledger by a central trusted authority that provides an immutable, and cryptographically verifiable transaction log.

Amazon Redshift logo

Amazon Redshift

Data warehouse product which forms part of the larger cloud-computing platform AWS.

Amazon Rekognition logo

Amazon Rekognition

Amazon Rekognition makes it easy to add image and video analysis to your applications.

Amazon Route 53 logo

Amazon Route 53

Effectively connects user requests to infrastructure running in AWS.

Amazon Simple Email Service (SES) logo

Amazon Simple Email Service (SES)

Cloud-based service that helps developers send marketing, notification, and transactional emails.

Amazon Simple Notification Service (SNS) logo

Amazon Simple Notification Service (SNS)

Provides a simple web services interface that can be used to create topics you want to notify apps.

Amazon Simple Queue Service (SQS) logo

Amazon Simple Queue Service (SQS)

Programmatic sending of messages via web service applications.

Amazon Simple Workflow Service (SWF) logo

Amazon Simple Workflow Service (SWF)

Makes it easy to build applications that coordinate work across distributed components.

Amazon Textract logo

Amazon Textract

Makes it easy to add document text detection and analysis to your applications.

Amazon Transfer Family logo

Amazon Transfer Family

Provides fully managed support for file transfers directly into and out of Amazon S3 using SFTP, FTPS, and FTP.

Amazon Translate logo

Amazon Translate

Text translation service using machine learning to provide high-quality translation on demand.

Amazon VPC (NAT Gateway) logo

Amazon VPC (NAT Gateway)

Connect to the Internet from instances within a private subnet in an AWS Virtual Private Cloud.

Amazon WorkMail logo

Amazon WorkMail

Secure, managed business email and calendaring service with support for existing desktop and mobile email clients.

Are you looking for something different?

We have hundreds of apps, extensions, and other technologies to customize your environment

Extend your knowledge

Learn the Dynatrace Query Language

Learn the Dynatrace Query Language

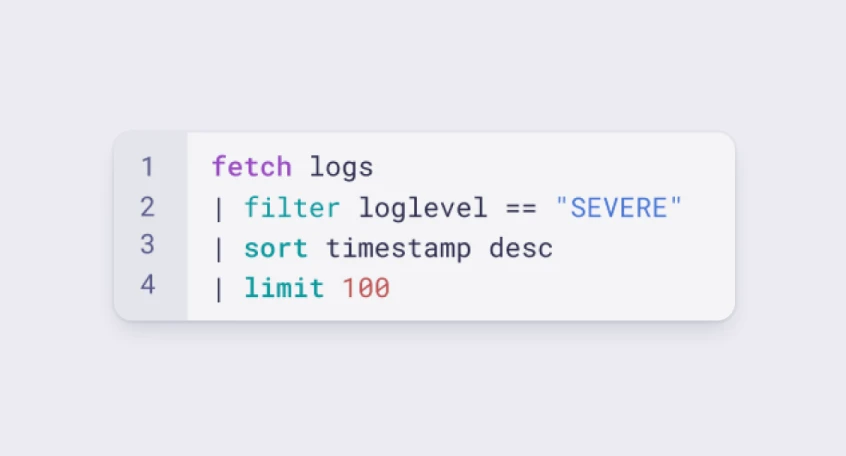
Explore data, discover patterns, anomalies and outliers, and create statistical modeling with DQL, our powerful query language..
Learn DQL
Get certified and advance your career

Get certified and advance your career

Go to Dynatrace University for practical, on-demand courses and learning paths -- from platform basics to key certifications.
Build skills