


































































Skip to technology filters Skip to main content
Dynatrace Hub

Extend the platform,
empower your team.

Popular searches:
Home hero bg
Microsoft SQL ServerMicrosoft SQL Server
Microsoft SQL Server

Microsoft SQL Server

Improve the health and performance monitoring of your Microsoft SQL Servers.

Extension
Free trialDocumentation
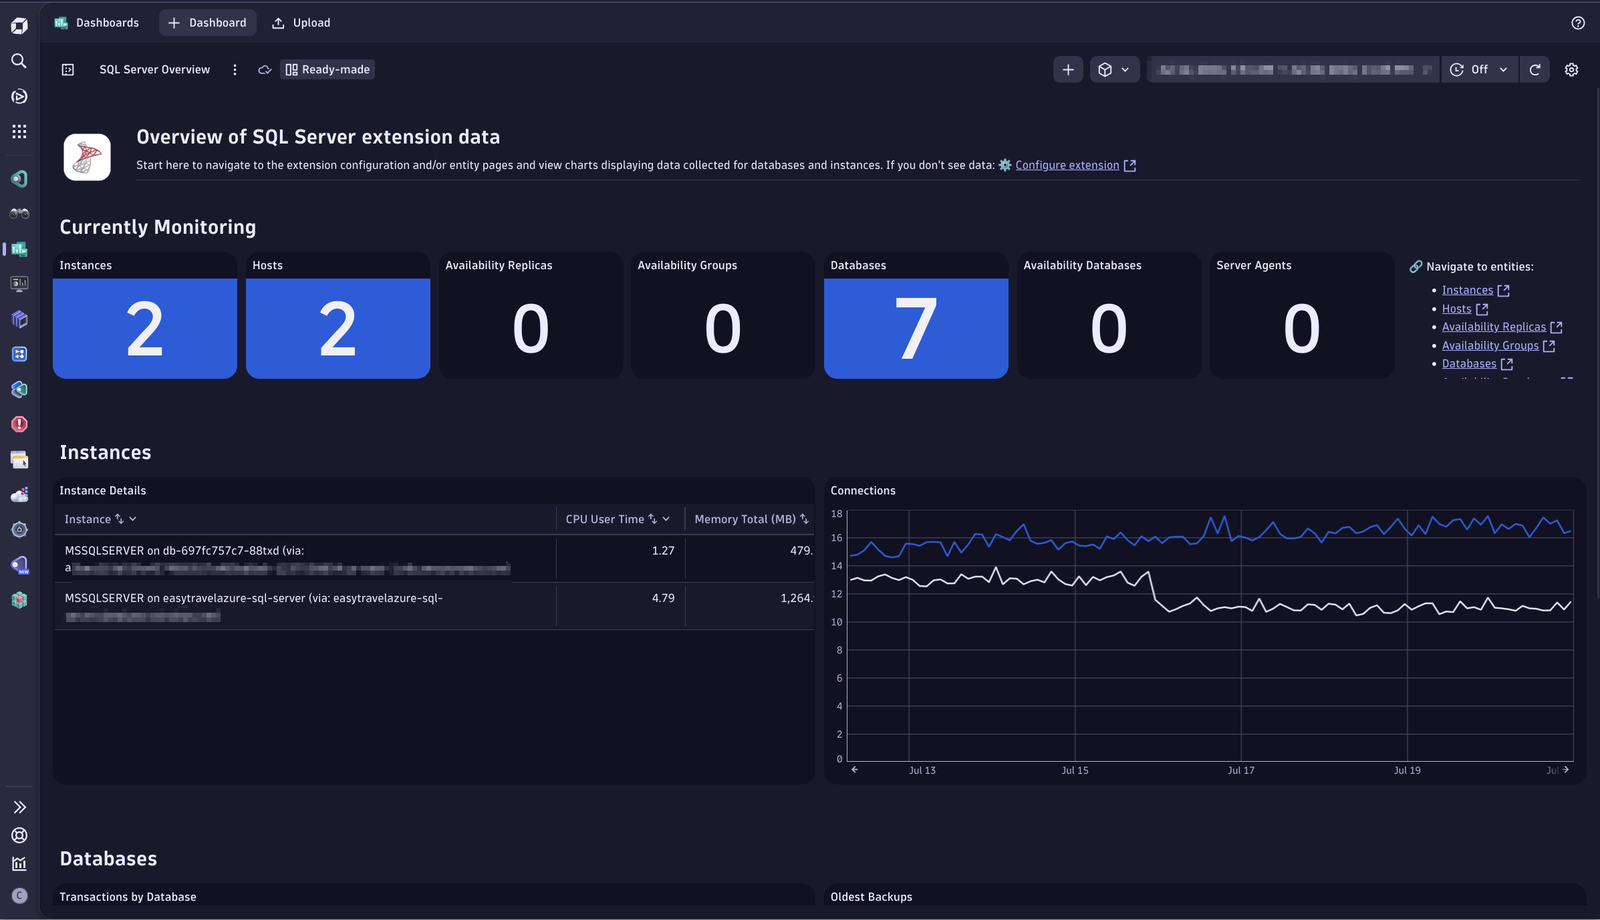
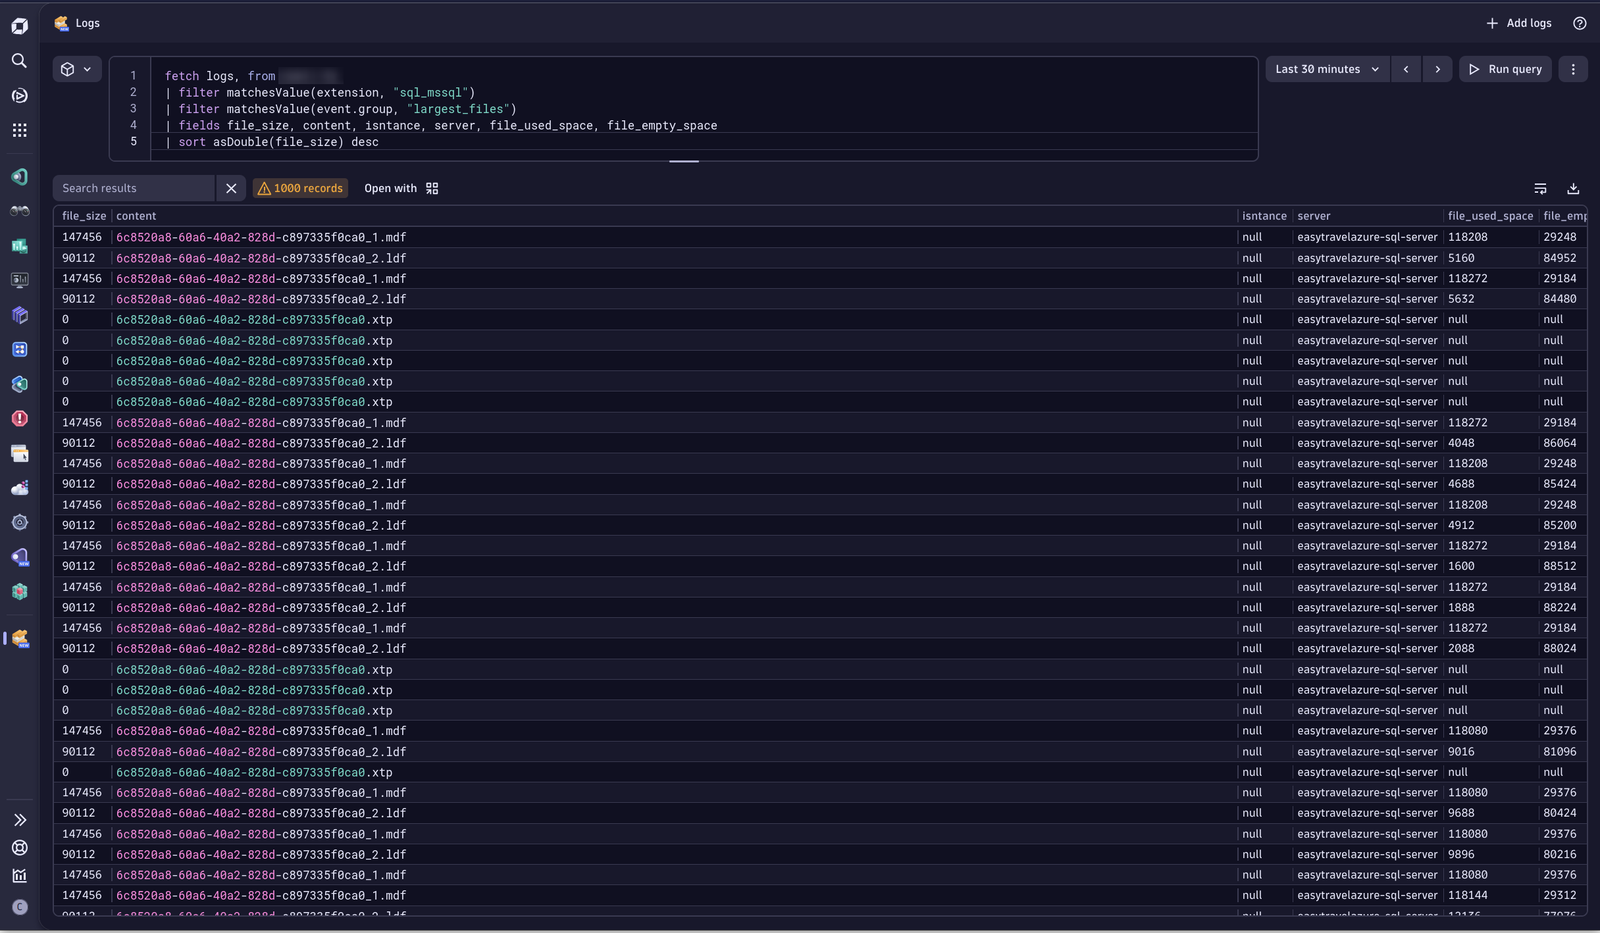
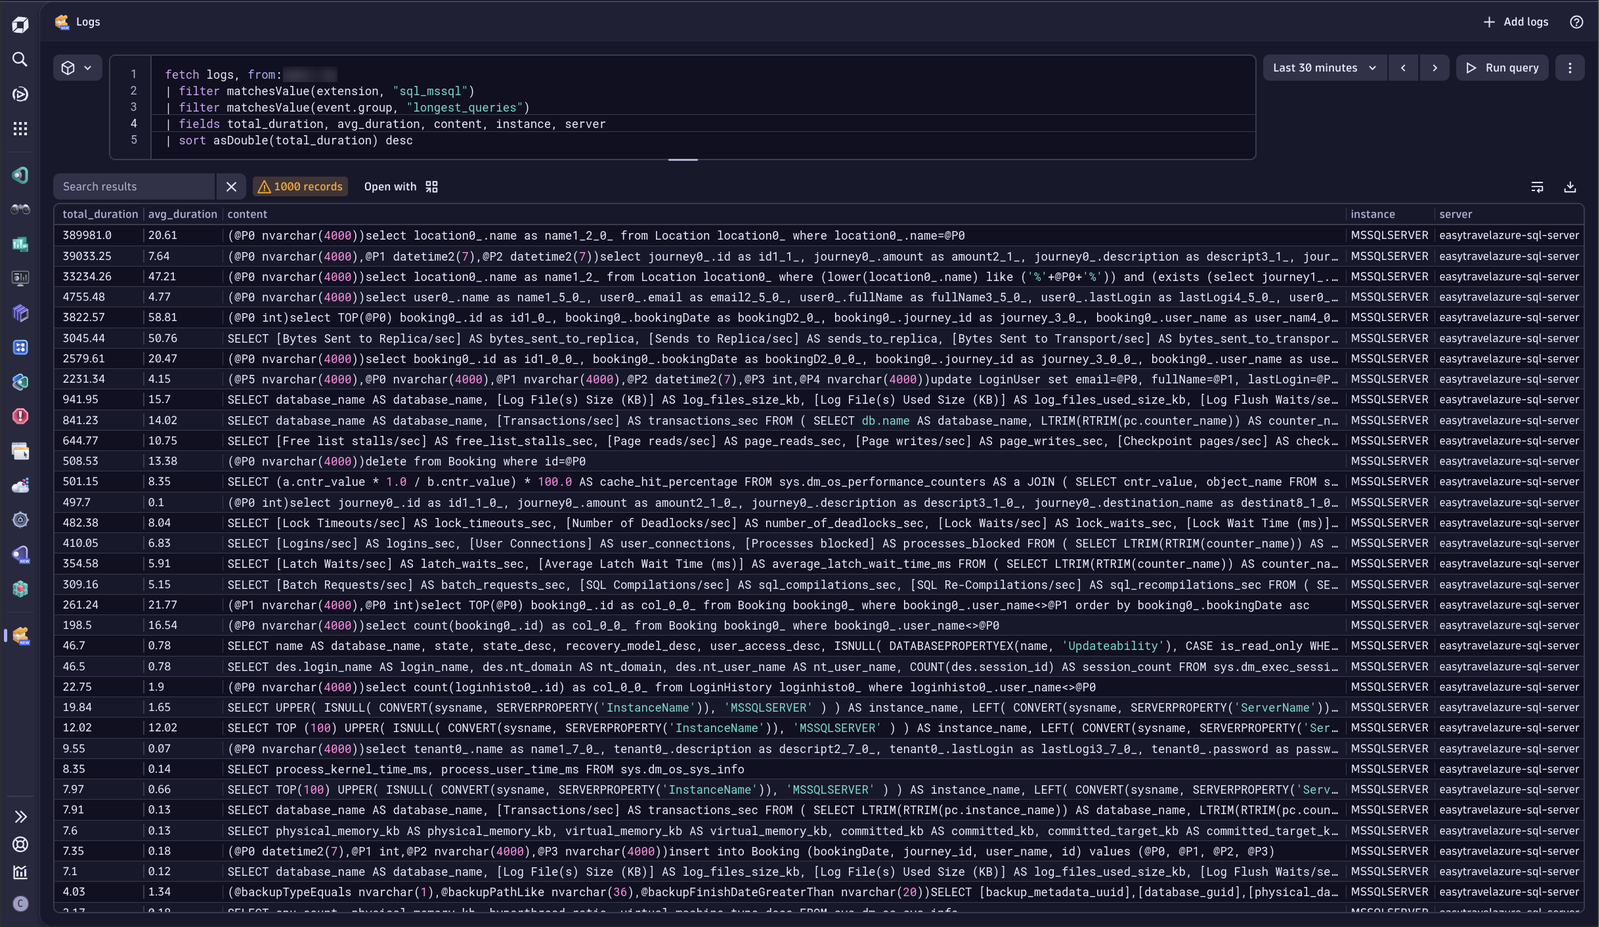
Get an overview of your SQL Server monitoring using New Dashboards, which are bundled with the extension upon activation.See the largest files in your SQL Server Environment via logs ingested by the extension.See the longest running queries in your SQL Server environment via logs ingested by the extension.
  • Product information
  • Release notes

Overview

Microsoft SQL Server database monitoring is based on a remote monitoring approach implemented as a Dynatrace ActiveGate extension. The extension queries MS SQL databases for key performance and health metrics, extending your visibility, and allowing DAVIS AI to provide anomaly detection and problem analysis.

Use cases

  • Understand the impact of resource shortages, locks or other database issues have on your application by observing the database server itself.
  • Track health and performance of the MS SQL servers

Get started

For more information on the installation and configuration, please see Microsoft SQL Server extension in the Dynatrace Documentation.

Details

Compatibility information

Supported types of SQL Server

  • SQL Server (editions: Enterprise, Standard, Developer, Web, Express) on Windows servers.
  • Azure SQL Database.
  • Azure SQL Managed Instance.

Important note: The extension is reported to work with other types of SQL Server, such as AWS RDS or SQL Server on Linux, but they are not officially supported.

Supported types of HA or replication

  • Always On

Important note: Other types of replication and HA monitoring, including publisher/subscriber model, are not supported yet.

Supported versions of SQL Server

Any version of SQL Server with active extended support by Microsoft is supported by this extension. Please refer to the official Microsoft documentation about lifecycle dates for SQL Server.

Simultaneous use of different versions of extension

  • Running two or more different versions of the extension against the same SQL Server is not supported.
  • Running different major versions (for example, version 1 and version 2) of the extension on the same tenant is highly discouraged and is not supported. This will break the topology model.

Compatibility with OneAgent

  • In order for SQL Server Instance entity to be linked to the Host entity, they must share the same IP address. If the monitoring configuration for SQL Server is configured with a different IP address, two instances will not be linked with each other.
Dynatrace
DocumentationMore Information
By Dynatrace
Dynatrace support center
Subscribe to new releases
Copy to clipboard

Feature sets

Below is a complete list of the feature sets provided in this version. To ensure a good fit for your needs, individual feature sets can be activated and deactivated by your administrator during configuration.

Feature setsNumber of metrics included
Metric nameMetric keyDescriptionUnit
Database statesql-server.databases.stateDatabase stateState
Transactionssql-server.databases.transactions.countNumber of transactions started for the databaseCount
CPU Countsql-server.host.cpusDetected CPU CountCount
Time spent in kernel modesql-server.cpu.kernelTime.countTime spent by all threads in kernel modeMilliSecond
Time spent in user modesql-server.cpu.userTime.countTime spent by all threads in user modeMilliSecond
Physical memorysql-server.memory.physicalTotal amount of physical memory on the machineKiloByte
Virtual memorysql-server.memory.virtualTotal amount of virtual address space available to the process in user modeKiloByte
Total server memorysql-server.memory.totalAmount of memory the server has committed using the memory managerKiloByte
Target server memorysql-server.memory.targetAmount of memory that can be consumed by memory managerKiloByte
Uptimesql-server.uptimeTime in seconds since instance was last startedSeconds
Loginssql-server.general.logins.countNumber of logins started, excluding pooled connectionsCount
User connectionssql-server.general.userConnectionsNumber of users currently connected to SQL ServerCount
Processes blockedsql-server.general.processesBlockedNumber of currently blocked processesCount
Active workerssql-server.worker.activeWorkersNumber of workers that are actively executing tasksgauge
Max workerssql-server.worker.maxWorkersMaximum number of workers that can be activegauge
Worker threads percentagesql-server.worker.threadsPercentPercentage of worker threads in usePercent
Metric nameMetric keyDescriptionUnit
Bytes sent to replicasql-server.replica.bytesSent.countMessage bytes queued to be sent to replicasByte
Sends to replicasql-server.replica.sends.countNumber of messages queued to be sent to replicaCount
Bytes sent to transportsql-server.replica.bytesSentToTransport.countDequeued message bytes sent across network to replicasByte
Sends to transportsql-server.replica.sendsToTransport.countNumber of messages sent across network to replicasCount
Bytes received from replicasql-server.replica.bytesReceived.countMessage bytes received from replicaByte
Receives from replicasql-server.replica.receives.countNumber of messages received from replicaCount
Resent messagessql-server.replica.resentMessages.countNumber of messages that had to be resent to replicaCount
Metric nameMetric keyDescriptionUnit
SQL Agent Statussql-server.sql.agent.statusThe status of the SQL Server Agent on the database instanceUnspecified
Metric nameMetric keyDescriptionUnit
Synchronization statesql-server.always-on.db.synchronizationStateData-movement stateState
Synchronization healthsql-server.always-on.db.synchronizationHealthIntersection of the synchronization state of a database that is joined to the group on the replica and the availability mode of the replicaState
Database statesql-server.always-on.db.stateState of the availability databaseState
Log send queue sizesql-server.always-on.db.logSendQueueSizeAmount of log records of the primary database not sent to the secondary databasesKibiByte
Log send ratesql-server.always-on.db.logSendRateAverage rate at which primary replica instance sends dataKiloBytePerSecond
Redo queue sizesql-server.always-on.db.redoQueueSizeAmount of log records in the log files of the secondary replica that has not yet been redoneKiloByte
Redo ratesql-server.always-on.db.redoRateAverage Rate at which the log records are being redone on a given secondary databaseKiloBytePerSecond
Filestream send ratesql-server.always-on.db.filestreamSendRateThe rate at which the filestream files are shipped to the secondary replicaKiloBytePerSecond
Automated backup preferencesql-server.always-on.ag.automatedBackupPreferencePreferred location for backups in this availability groupState
Primary recovery healthsql-server.always-on.ag.primaryRecoveryHealthIndicates the recovery health of the primary replicaState
Secondary recovery healthsql-server.always-on.ag.secondaryRecoveryHealthIndicates the recovery health of a secondary replicaState
Synchronization healthsql-server.always-on.ag.synchronizationHealthReflects a rollup of the synchronization health of all replicas the groupState
Availability modesql-server.always-on.ar.availabilityModeThe availability mode of the replicaState
Failover modesql-server.always-on.ar.failoverModeThe failover mode of the replicaState
Is replica localsql-server.always-on.ar.isLocalWhether the replica is localState
Replica rolesql-server.always-on.ar.roleCurrent groups role of a local replica or a connected remote replicaState
Operational statesql-server.always-on.ar.operationalStateCurrent operational state of the replicaState
Recovery healthsql-server.always-on.ar.recoveryHealthRollup of the database_state columnState
Synchronization healthsql-server.always-on.ar.synchronizationHealthRollup of the database synchronization state of all joined replicas and the availability mode of the replicaState
Connected statesql-server.always-on.ar.connectedStateWhether a secondary replica is currently connected to the primary replicaState
Metric nameMetric keyDescriptionUnit
Buffer cache hitsql-server.buffers.cacheHitRatioPercentage of pages found in the buffer cache without having to read from diskPercent
Free list stallssql-server.buffers.freeListStalls.countNumber of requests that had to wait for a free pageCount
Page readssql-server.buffers.pageReads.countNumber of physical database page reads that are issuedCount
Page writessql-server.buffers.pageWrites.countNumber of physical database page writes that are issuedCount
Checkpoint pagessql-server.buffers.checkpointPages.countNumber of pages flushed to disk by a checkpoint or other operations that require all dirty pages to be flushedCount
Page life expectancysql-server.buffers.pageLifeExpectancyNumber of seconds a page will stay in the buffer pool without referencesSecond
Connection memorysql-server.memory.connectionTotal amount of dynamic memory the server is using for maintaining connectionsKiloByte
Memory grants outstandingsql-server.memory.grantsOutstandingNumber of processes that have successfully acquired a workspace memory grantCount
Memory grants pendingsql-server.memory.grantsPendingNumber of processes waiting for a workspace memory grantCount
Metric nameMetric keyDescriptionUnit
Sessionssql-server.sessionsNumber of active sessions per userCount
Metric nameMetric keyDescriptionUnit
Database file sizesql-server.databases.file.sizeTotal size of files of specific types per databaseKiloByte
Database file used sizesql-server.databases.file.usedSpaceTotal size of space used in files of specific types per databaseKiloByte
Database file empty sizesql-server.databases.file.emptySpaceTotal size of empty space in files of specific types per databaseKiloByte
Metric nameMetric keyDescriptionUnit
Failed Distributed Transactionssql-server.databases.failedDistributedTransactions.countThe number of failed distributed transactionsCount
Server locks by wait typesql-server.locks.byWaitTypeTime spent waiting for locks by wait typeSecond
Batch requestssql-server.sql.batchRequests.countNumber of Transact-SQL command batches receivedCount
SQL compilationssql-server.sql.compilations.countNumber of SQL statement compilationsCount
SQL re-compilationssql-server.sql.recompilations.countNumber of SQL statement re-compilationsCount
Percent of Elapsed time for Requests wait typesql-server.locks.elapsedTimeRequestsPercentPercentage of elapsed time for requests wait type performance counter_namePercent
Metric nameMetric keyDescriptionUnit
Lock timeoutssql-server.locks.timeouts.countNumber of lock requests that timed out, including requests for NOWAIT locksCount
Deadlockssql-server.locks.deadlocks.countNumber of lock requests that resulted in a deadlockCount
Lock waitssql-server.locks.waits.countNumber of lock requests that required the caller to waitCount
Lock wait timesql-server.locks.waitTime.countWait time for locksMilliSecond
Metric nameMetric keyDescriptionUnit
Latch waitssql-server.latches.waits.countNumber of latch requests that could not be granted immediatelyCount
Average latch wait timesql-server.latches.averageWaitTime.countAverage latch wait time for latch requests that had to waitMilliSecond
Metric nameMetric keyDescriptionUnit
Log files sizesql-server.databases.log.filesSizeCumulative size of all the transaction log files in the databaseKiloByte
Log files used sizesql-server.databases.log.filesUsedSizeThe cumulative used size of all the log files in the databaseKiloByte
Log flush waitssql-server.databases.log.flushWaits.countNumber of commits waiting for the log flushCount
Log growthssql-server.databases.log.growths.countNumber of times the transaction log for the database has been expandedCount
Log shrinkssql-server.databases.log.shrinks.countNumber of log shrinks for this databaseCount
Log truncationssql-server.databases.log.truncations.countNumber of times the transaction log has been truncated (in Simple Recovery Model)Count
Percent log usedsql-server.databases.log.percentUsedPercentage of space in the log that is in usePercent
Metric nameMetric keyDescriptionUnit
Minutes since last backupsql-server.databases.backup.ageNumber of minutes passed since last backupMinute
Size of the last backupsql-server.databases.backup.sizeSize of the last backup of that typeByte

Related to Microsoft SQL Server

Microsoft SQL Server (local) logo

Microsoft SQL Server (local)

Improve the health and performance monitoring of your Microsoft SQL Servers.

Full version history

To have more information on how to install the downloaded package, please follow the instructions on this page.
ReleaseDate

Full version history

  • Managed: Fixed a Unified Analysis screen definition that prevented data from being shown when execution interval for the extension was changed to any value higher than 1.

Full version history

⚠️WARNING⚠️: Possible breaking changes and warnings - PLEASE READ before upgrading:

  • This version requires a minimum Dynatrace version of 1.338.0 and a minimum EEC version of 1.337.0.
  • This version includes a breaking change for Dynatrace on Grail.
    • With the inclusion of OpenPipeline processing rules, any metrics ingested from the extension will be processed by a dedicated OpenPipeline pipeline.
    • This means that any dynamic route configured to process any metrics from the extension will be dropped in favor of the dedicated pipeline. Please, refer to pipeline groups to continue using dynamic routes.
    • With the inclusion of OpenPipeline processing rules, any logs ingested from the extension will be processed by a dedicated OpenPipeline pipeline instead of the classic log pipeline.
    • This means that classic rules will no longer be used on logs ingested from the extension. Please be sure to migrate any you still need to OpenPipeline rules.
    • Additionally, some field names are handled differently in OpenPipeline, e.g. capitalization. Please double-check any custom dashboards and alerts you have created for this extension.
    • You must opt-in to OpenPipeline configuration via Settings API – see the documentation.
  • Feature sets have been refactored, with new feature sets added and some other ones removed, meaning that in most cases, you will need to re-create monitoring configurations when updating to this version, as well as check properly all the new feature sets to ensure you're enabling the same insights as before.
  • SQL Agent removed from Classic Topology.
  • Log entries captured from the agent_requests and application_requests event groups have been removed in favor of the generic all_requests event group. Please use the program_name attribute to correctly filter for agent or application requests.

New in this version:

  • Smartscape on Grail.
  • Added feature set metadata for recommended metrics.
  • Fixed a bug where the failed_jobs query was returning the server name in a different format than the rest of the queries, generating duplicate entities.

Full version history

  • (Platform) Fixed filtering for dt.entity.sql:sql_server_database charts in Infrastructure & Operations app.

Full version history

  • Refactored failed jobs query to make it more efficient.
  • (Managed) Fixed metric events to be attached to the right entity.
  • (Platform) Fixed alerting templates so they are attached to the right entity.

Full version history

Fixes and Improvements:

  • Entity sql:sql_server_instance would display a duplicate for a short period of time after ingesting logs. Topology rules have been corrected.

Full version history

New Features

  • Added ALERT_TEMPLATES for anomaly detectors in the Davis Anomaly Detection app.

Full version history

New Features

  • Added Worker Metrics to the Default Feature Set

    • Active Workers: Displays the number of workers actively executing tasks.
    • Max Workers: Shows the maximum number of workers that can be active.
    • Worker Threads Percentage: Indicates the percentage of worker threads currently in use.
  • Added Query Performance Metric to the Queries Feature Set

    • Percent of Elapsed Time for Requests Wait Type: Represents the percentage of elapsed time for requests categorized by wait type performance counter.
  • Added @@servername as a New Attribute

    • Added as an additional attribute to Server Instances.

Improvements

  • Updated {device.name} to {device} on database instances, enabling the database name to appear in the naming string.

Bug Fixes

  • Failed Distributed Transactions Query Updated
    • Resolved an issue where a temporary duplicate could occur if an orphaned query was recorded.

Future Breaking Change

In a future update Transaction Logs and Transaction logs FeatureSets will be merged into one.

Full version history

Potential Breaking Change affecting Availability Replica Entities

Bug Fix:

  • Availability Replica would not handle name instances correctly. This has been fixed and now relationship mapping will happen as expected. The previously incorrect entities may no longer appear.

Dimension Changes:

  • Product Version Dimension has now been changed to DB Instance Version on SQL Server Instance Entity. This is now a standardized value across Database Extensions.

Attribute Changes

  • All Entities created by the SQL Server Extension now have the security_context attribute which is entered via the Monitoring Configuration.

Full version history

Bugfix

  • failed_jobs previously would ingest job failures older than 5 minutes depending on the time of hour. This has been corrected.

Warning

  • Transaction Logs featureSet to be removed in a future update. Transaction logs will continue to exist

Full version history

Improvements

  • Added new alert SQL Server is unreachable to monitor database availability, based on Uptime metric
  • Uptime visualization updated from single value display to graph chart visualization for better alert investigation

Full version history

Bug fixes:

  • Current Jobs query syntax fix. This was causing a breakage of the extension

Warning:

  • "Transaction Logs" featureSet to be removed in a future update. "Transaction logs" will continue to exist.
  • Minimum EEC version increased (1.303) for Query Interval which was causing breakage issues when updating to 2.7.0 and above

Full version history

Bug fixes:

  • buffer_cache_hit bundled alert now fixed.
  • Minimum EEC version increased to 1.303 for Query Interval which was causing breakage issues when updating to 2.7.0 and above

Improvements:

  • event.group added for agent and application queries log ingest
  • Added "Job Category id" and "Job Category name" to Current and Failed Jobs

Features:

  • Now able to see the locks and waits of impacted requests.
  • Added Gen 3 dashboard to visualize the locks and waits data

Warning:

  • "Transaction Logs" featureSet to be removed in a future update. "Transaction logs" will continue to exist.

Full version history

New Feature:

  • Configurable frequency for the SQL queries

Full version history

Adds the SAME_AS relationship between SQL Instances and related Process Group Instances on OneAgent monitored hosts.

Full version history

Features:

  • Added a built-in dashboard for 3rd gen SaaS tenants.

Full version history

Fixed in this version:

  • Sorting SQL statements in Databases app would produce duplicate results

Full version history

New Entity
  • SQL Agent added to topology
New Metrics
  • Agent Status
  • Failed Distributed Transactions Count
New Log Ingests
  • Top 25 Agent Queries running longer than 60 seconds
  • Top 25 Application Queries running longer than 60 seconds

Bug Fixes

  • Fixed an issue where Databases App did not display Uptime Hours due to syntax error.
  • Fixed Arithmetic Overflow Error that had a chance to occur in large environments on the Largest Files Managed calculation.

Full version history

Improvements

  • Execution Plan fetching now done in Databases App
  • Instance entity parsing from log records

Changes

  • Removed query plan from longest_queries query
  • Show latest back-up age

Full version history

Improvements:

  • Added default value for availability.replica.instance dimension: MSSQLSERVER.

    This enables the SAME AS relationship between the sql:sql_server_instance and sql:sql_server_availability_replica entities based on the equality of their respective attributes: server = ar_server_name and instance = ar_instance_name.

    Previously, if the replica was running on an instance that had a default name, the relationshp wasn't being established.

Full version history

Bug fixes:

  • Fixed typo in the metric description of the sql-server.databases.log.percentUsed.

Full version history

Bug fixes:

  • Added SAME_AS relationship from sql:sql_server_availability_replica to sql:sql_server_instance based on the matching ar_server_name -> server and ar_instance_name -> instance attributes.

Full version history

Bug fixes:

  • Hotfix for backup age retrieval in metric sql-server.databases.backup.age. Release 2.5.0 introduced a bug where age of the oldest backup instead of the latest one was retrieved.

Full version history

Bug fixes:

  • Only the age of the oldest observable backup was reported in the sql-server.databases.backup.age metric. This has now been fixed and the age of the most recent backup is being reported instead.

Improvements:

  • Additional dimensions in for backup metrics: device_type, recovery_model, software_name.
  • Better granularity for backup_type dimension: "Full", "Full copy-only", "Differential", "Transaction log", "File or filegroup", "Differential file", "Partial", "Differential partial".

Features:

  • Backup monitoring for Azure SQL Database is now available through "Backups" feature set. The sys.dm_database_backups view is queried every 5 minutes and a record about each finished backup is ingested as a log. Can be filtered using the backups_azure value for event.group attribute.
  • Monitoring of each individual backup for SQL Server and Azure SQL Managed Instances is now available through "Backups" feature set. Information about every backup finished within the last 5 minutes is retrieved and ingested as a log record.

Full version history

Improvements:

  • Default timeout for longest_queries is increased to 120 seconds. Allowing query to have more time to complete and fetch the data about top busiest queries on the target database.

Features:

  • New variable "Longest queries timeout" that can be specified per monitoring configuration. Default is 120 seconds. Can be increased to values up to 290 seconds.

Warning:

  • Any value specified in the "Longest queries timeout" variable field must be a valid integer.

Full version history

Bug fixes:

  • Fixed incorrectly detected relationship between Availability Databases and Availability Groups. Previously only one availability database was visible per group.

Warning:

  • Direct topology relationship between Availability Group and Availability Database entity types was removed. Instead, the relationship between them is now derived through Availability Replica.
  • Direct topology relationship between Database and Availability Database is removed. It wasn't detected properly in the past and has been removed as redundant.

Full version history

Bug fixes:

  • Fix retrieval problems in "Queries" and "Jobs" feature sets for instances in non-UTC time zones or running on hosts in non-UTC time zones.

Full version history

Bug fixes:

  • Fixed: Arithmetic overflow error / An expression of non-boolean type specified for Database Files feature set

Full version history

Improvements:

  • Top queries and failed jobs are now correctly retrieved for instances with a timezone other than UTC.

Full version history

New features:

  • Monitoring of current and failed jobs (enabled through Jobs feature set).

Addressed issues:

  • Improved compatibility with new Databases App.

Full version history

  • Number of longest queries collected every minute is reduced from 100 to 10 to comply with existing log ingestion limitations (to be increased back in the future release).
  • Monitoring of backups is now supported on Azure SQL Managed Instance and Analytics Platform System (PDW).
  • The backup_type dimension now contains full backup type names instead of a single letter.

Full version history

Major release with breaking changes

Breaking changes

  • All monitoring configurations must be recreated because of change in feature sets.
  • instance dimension changes its meaning to only contains an actual named instance name or MSSQLSERVER by default.
  • hoursSinceBackup metric is removed and replaced by sql-server.databases.backup.age.

New features

  • Query level monitoring: Top 100 longest running queries are collected every 5 minutes (enabled through Queries feature set).
  • Largest database files monitoring: Top 100 largest database files as monitored every 5 minutes (enabled through Database files feature set).
  • instance dimension is now retrieved from "InstanceName" server property but only contains an actual named instance name. Defaults to MSSQLSERVER for unnamed instances.
  • New server dimension is now retrieved from ServerName but only contains an actual machine or server name, without named instance.
  • Feature sets are not more granularly grouped allowing for fine grained control over which metrics are collected.
  • Detailed backup monitoring with backup size and backup age collected for backup type and individual database.
  • Detailed database files monitoring with average file size, used space, and empty space collected for each file type and individual database.
  • Entity screens are now adapted to the latest versions of SaaS and utilize DQL.
  • Monitoring of communication with availability replcia (bytes sent/received).
  • Conversion of database ID to human readable name for Azure SQL databases.
  • CPU and Memory monitoring.
  • Uptime monitoring.

Bug fixes

  • Incorrect detection of named instances in certain cases was addressed through better identification of instance and server dimensions.

Full version history

  • Fix: missing column name for SQL Server versions below 2019

Full version history

  • Always On support
  • Metric type fixed for Lock Wait Time and Latch Average Wait Time
  • Entities not being generated for hosts without a domain name
  • Entity topology updated
  • List of database entities is now available

Full version history

  • Support for monitoring databases on named instances.

Full version history

  • Release v1.0.1
  • Contains the same metrics that were collected by the previous generation of the SQL Server remote monitoring.
Dynatrace Hub
Hub HomeGet data into DynatraceBuild your own app
Dynatrace Intelligence - Agentic Operations SystemThe Dynatrace Agentic AI ecosystem
All (914)Log Management and AnalyticsKubernetesAI and LLM ObservabilitySoftware DeliveryApplication ObservabilityApplication SecurityBusiness ObservabilityDigital Experience
Filter
Type
Built and maintained by
Deployment model
SaaS
  • SaaS
  • Managed
Partner FinderBecome a partnerDynatrace Developer

Infrastructure Observability

Get automatic and intelligent observability across cloud and hybrid environments with continuous auto-discovery of any type of infrastructure, all in context and with precise, AI-powered answers.

Essentials

Get automatic and intelligent infrastructure monitoring and observability across hybrid and cloud environments.

OneAgent logo

OneAgent

The simplest way to capture all observation signals automatically and in context.

Discovery & Coverage logo

Discovery & Coverage

Ensure enterprise-wide visibility. Discover and remediate coverage gaps.

Infrastructure & Operations logo

Infrastructure & Operations

Detailed hosts, process, and network insights across the entire environment.

Databases logo

Databases

Monitor databases, prevent issues, and resolve incidents quickly in real time.

Clouds logo

Clouds

Gain full visibility and proactive monitoring across your cloud infrastructure.

Hybrid cloud

AWS logo

AWS

Reliable, scalable, and inexpensive cloud computing services.

Microsoft Azure logo

Microsoft Azure

Cloud computing service for building, testing, deploying, and managing services.

Google Cloud logo

Google Cloud

Meet your business challenges head on with cloud computing services from Google.

VMware logo

VMware

Monitor health and performance of VMware virtual machines.

Nutanix Clusters logo

Nutanix Clusters

Monitor Nutanix clusters' performance, usage and availability, with Nutanix API.

Microsoft Hyper-V Infrastructure logo

Microsoft Hyper-V Infrastructure

Monitor health and performance of the Hyper-V clusters, hosts and VMs.

Technology coverage

F5 BIG-IP logo

F5 BIG-IP

Gain insights into the performance of your F5 BIG-IP LTM and DNS solutions.

Oracle Database logo

Oracle Database

Observe, analyze and optimize the usage, health and performance of your database.

Microsoft SQL Server logo

Microsoft SQL Server

Improve the health and performance monitoring of your Microsoft SQL Servers.

Also popular

See more (5)
Juniper Networks (SNMP) logo

Juniper Networks (SNMP)

Gain insights into the performance of your Juniper networking solutions.

SNMP Traps logo

SNMP Traps

Supplement network monitoring with event-based data reported via SNMP Traps.

Generic Cisco Device logo

Generic Cisco Device

Monitor Cisco devices using SNMP to feed Dynatrace with metrics and alerts.

Palo Alto firewalls logo

Palo Alto firewalls

Palo Alto extension for problems detection.

Remote Windows Host Monitoring logo

Remote Windows Host Monitoring

Monitor health and performance of Windows Hosts without installing an agent.

AWS Lambda logo

AWS Lambda

Automatic and intelligent end-to-end observability of AWS Lambda traces and logs.

More resources

Amazon API Gateway logo

Amazon API Gateway

Service for developers to create, publish, maintain, monitor, and secure APIs.

Amazon AppStream 2.0 logo

Amazon AppStream 2.0

Fully managed application streaming service that provides users with instant access to their desktop applications from anywhere.

Amazon Athena logo

Amazon Athena

Interactive query service that makes it easy to analyze data directly in Amazon S3 using standard SQL.

Amazon Aurora logo

Amazon Aurora

Relational database service developed and offered by Amazon Web Services.

Amazon CloudFront logo

Amazon CloudFront

Content delivery network offered by Amazon Web Services.

Amazon CloudSearch logo

Amazon CloudSearch

Set up, manage, and scale a search solution for your website or application using CloudSearch.

Amazon CloudWatch Logs logo

Amazon CloudWatch Logs

Monitor, store, and access your log files from instances, AWS CloudTrail, Route 53, and other sources.

Amazon Cognito logo

Amazon Cognito

Add user sign-up, sign-in, and access control to your web and mobile apps quickly and easily.

Amazon Connect logo

Amazon Connect

Easy to use omnichannel cloud contact center that helps you to provide superior customer service at a lower cost.

Amazon DocumentDB logo

Amazon DocumentDB

Amazon DocumentDB (with MongoDB compatibility) is a fast, reliable, and fully managed database service.

Amazon DynamoDB Accelerator (DAX) logo

Amazon DynamoDB Accelerator (DAX)

Fully managed, highly available, in-memory cache for your Amazon DynamoDB.

Amazon EC2 Auto Scaling logo

Amazon EC2 Auto Scaling

Amazon EC2 Auto Scaling helps you ensure that you have the correct number of Amazon EC2 instances available.

Amazon EC2 Spot Fleet logo

Amazon EC2 Spot Fleet

Spot Instances and On-Demand Instances to meet the target capacity that you specified.

Amazon Elastic Container Service (ECS) logo

Amazon Elastic Container Service (ECS)

Fully managed container orchestration service.

Amazon Elastic File Service (EFS) logo

Amazon Elastic File Service (EFS)

Cloud storage service provided by Amazon Web Services.

Amazon Elastic Transcoder logo

Amazon Elastic Transcoder

Convert and transcode media files stored in Amazon S3.

Amazon ElastiCache logo

Amazon ElastiCache

Fully managed, Redis- and Memcached-compatible service delivering real-time performance for modern applications by Amazon Web Services.

Amazon Elasticsearch Service logo

Amazon Elasticsearch Service

Fully managed service to deploy, secure, and run Elasticsearch cost effectively at scale, without the operational overhead.

Amazon EMR logo

Amazon EMR

Cloud big data platform for processing vast amounts of data using open source tools.

Amazon EventBridge logo

Amazon EventBridge

Serverless event bus to connect applications together using data from your own applications, integrated SaaS applications, and AWS services.

Amazon FSx for Lustre logo

Amazon FSx for Lustre

Makes it easy and cost-effective to launch and run the popular, high-performance Lustre file system.

Amazon FSx for Windows File Server logo

Amazon FSx for Windows File Server

Provides a managed Microsoft Windows file servers, backed by a native Windows file system.

Amazon GameLift logo

Amazon GameLift

Enables developers to deploy, operate, and scale dedicated, low-cost servers in the cloud for session-based, multiplayer games.

Amazon Inspector logo

Amazon Inspector

Tests the network accessibility of your EC2 instances and the security state of your applications that run on those instances.

AWS IoT logo

AWS IoT

Run local compute, messaging, data caching, and machine learning inference capabilities.

Amazon Keyspaces for Apache Cassandra logo

Amazon Keyspaces for Apache Cassandra

Scalable, highly available, and managed Apache Cassandra–compatible database service.

Amazon Kinesis Data Analytics logo

Amazon Kinesis Data Analytics

Transform and analyze streaming data in real time with open source framework and engine for processing data streams (Apache Flink).

Amazon Kinesis Data Firehose logo

Amazon Kinesis Data Firehose

Fully managed service for delivering real-time streaming data.

Amazon Kinesis Data Streams logo

Amazon Kinesis Data Streams

Collect log and event data from sources such as servers, desktops, and mobile devices.

Amazon Kinesis Video Streams logo

Amazon Kinesis Video Streams

Provides you SDKs to install on your devices to make it easy to stream media.

Amazon Lex logo

Amazon Lex

Service for building conversational interfaces for applications using voice and text.

Amazon MQ logo

Amazon MQ

Managed message broker service for Apache ActiveMQ that makes it easy to migrate to a message broker in the cloud.

Amazon MSK logo

Amazon MSK

Fully managed service that enables you to build and run applications that use Apache Kafka to process streaming data.

Amazon Neptune logo

Amazon Neptune

Fast, reliable, fully managed graph database built for highly connected datasets.

Amazon Polly logo

Amazon Polly

Cloud service that converts text into lifelike speech.

Amazon Quantum Ledger Database (QLDB) logo

Amazon Quantum Ledger Database (QLDB)

Ledger by a central trusted authority that provides an immutable, and cryptographically verifiable transaction log.

Amazon Redshift logo

Amazon Redshift

Data warehouse product which forms part of the larger cloud-computing platform AWS.

Amazon Rekognition logo

Amazon Rekognition

Amazon Rekognition makes it easy to add image and video analysis to your applications.

Amazon Route 53 logo

Amazon Route 53

Effectively connects user requests to infrastructure running in AWS.

Amazon Simple Email Service (SES) logo

Amazon Simple Email Service (SES)

Cloud-based service that helps developers send marketing, notification, and transactional emails.

Amazon Simple Notification Service (SNS) logo

Amazon Simple Notification Service (SNS)

Provides a simple web services interface that can be used to create topics you want to notify apps.

Amazon Simple Queue Service (SQS) logo

Amazon Simple Queue Service (SQS)

Programmatic sending of messages via web service applications.

Amazon Simple Workflow Service (SWF) logo

Amazon Simple Workflow Service (SWF)

Makes it easy to build applications that coordinate work across distributed components.

Amazon Textract logo

Amazon Textract

Makes it easy to add document text detection and analysis to your applications.

Amazon Transfer Family logo

Amazon Transfer Family

Provides fully managed support for file transfers directly into and out of Amazon S3 using SFTP, FTPS, and FTP.

Amazon Translate logo

Amazon Translate

Text translation service using machine learning to provide high-quality translation on demand.

Amazon VPC (NAT Gateway) logo

Amazon VPC (NAT Gateway)

Connect to the Internet from instances within a private subnet in an AWS Virtual Private Cloud.

Amazon WorkMail logo

Amazon WorkMail

Secure, managed business email and calendaring service with support for existing desktop and mobile email clients.

Are you looking for something different?

We have hundreds of apps, extensions, and other technologies to customize your environment

Extend your knowledge

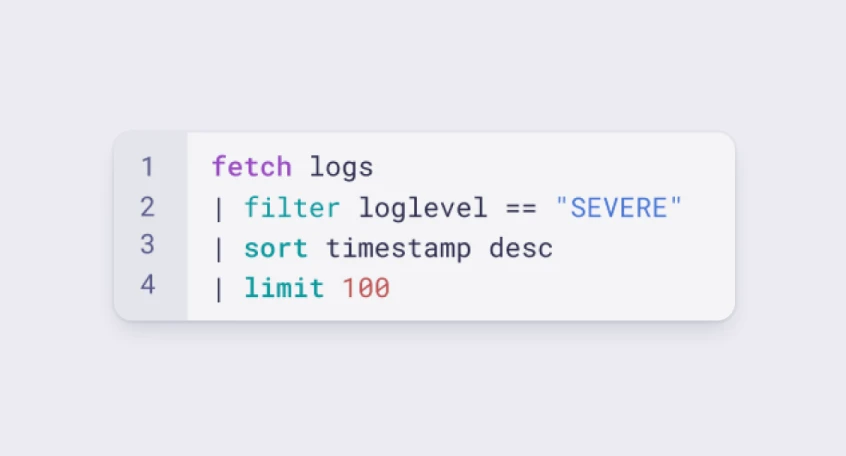
Learn the Dynatrace Query Language

Learn the Dynatrace Query Language

Explore data, discover patterns, anomalies and outliers, and create statistical modeling with DQL, our powerful query language..
Learn DQL

Get certified and advance your career

Get certified and advance your career

Go to Dynatrace University for practical, on-demand courses and learning paths -- from platform basics to key certifications.
Build skills