Skip to technology filters Skip to main content
Dynatrace Hub

Extend the platform,
empower your team.

Popular searches:
Home hero bg
MilvusMilvus
Milvus

Milvus

Gain insights about vector database resource utilization and cache behavior.

Technology
Free trialDocumentation
  • Product information

Overview

Vector databases, exemplified by Milvus, play a crucial role as semantic caches within contemporary Large Language Model (LLM) service frameworks.

Semantic caches are instrumental in mitigating latency for familiar and frequently accessed user prompts, concurrently optimizing the overall expenditure associated with cloud-based pre-trained model services.

Vigilant monitoring of cache efficiency and memory utilization is imperative for optimal resource allocation, while the cache's adaptability to dynamic contexts serves as a metric for its ability to accurately respond to evolving conversation dynamics. Furthermore, considerations of cache warm-up times contribute to expediting the availability of cached information. In the realm of vector databases, the performance of queries and indexing speed emerges as pivotal indicators directly influencing the system's efficacy in handling similarity searches.

Key factors such as scalability, accuracy of vector representations, and storage efficiency assume critical roles in proficiently managing expanding datasets. Additionally, the performance metrics related to updates, deletions, and query throughput further impact the overall effectiveness of these systems in delivering real-time and accurate responses in natural language processing and similarity search applications.

Striking an optimal balance across these Key Performance Indicators (KPIs) ensures that both semantic LLM caches and vector databases, like Milvus, achieve peak performance across diverse use cases.

To summarize, the overarching goal of vector databases, exemplified by Milvus, is to address performance-related challenges, enhance operational efficiency, and contribute to a more seamless and responsive experience in various natural language processing applications.

Get started

Setting up full stack observability for your GenAI applications is possible with Traceloop's OpenLLMetry, with OpenTelemetry under the hood, which can seamlessly provide comprehensive end-to-end insights into your production environments.

To set up OpenLLMetry with Dynatrace, see Dynatrace Documentation.

Details

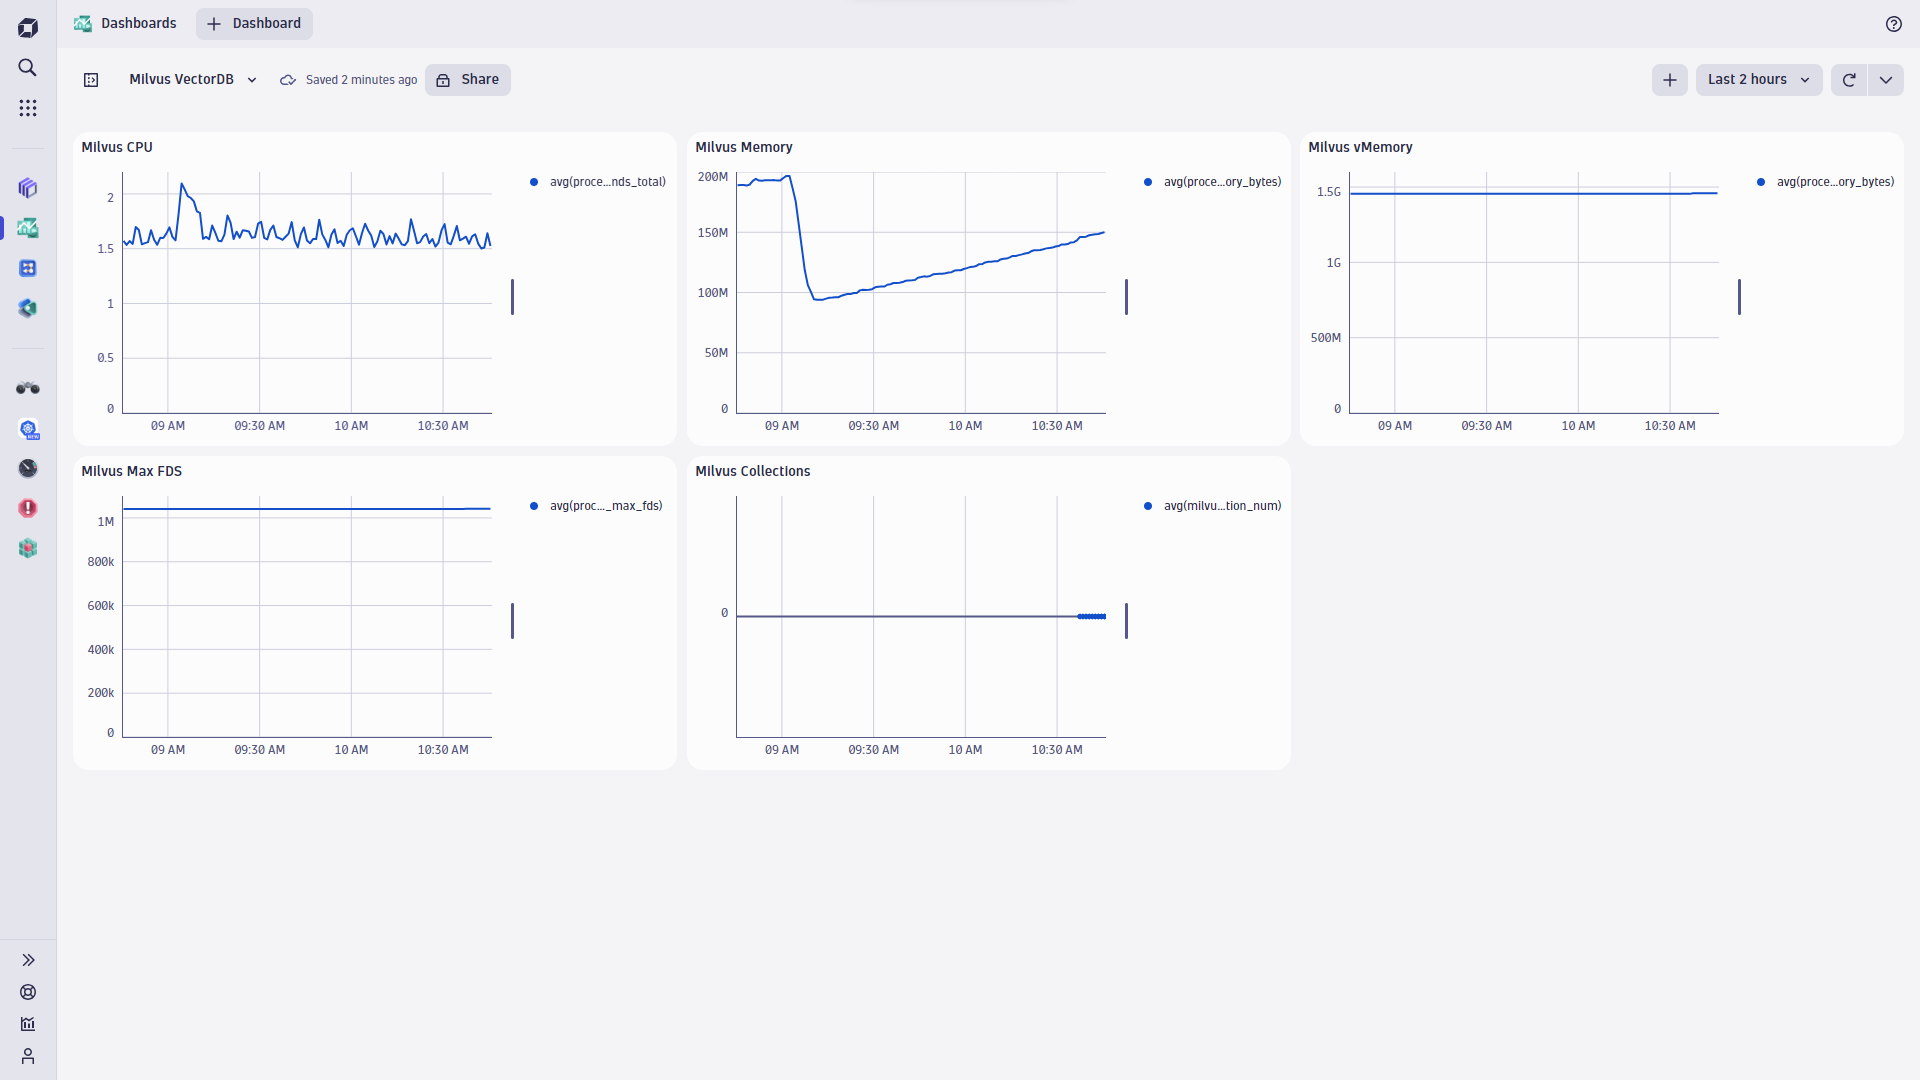
Milvus exposes Prometheus-compatible metrics for monitoring at port 9091 under the path /metrics. A standard Prometheus setup can be used to visualize metrics on various dashboards in your Dynatrace environment.

Milvus metrics are then used to measure request latencies, import speed, time spent on vector vs object storage, memory usage, application usage, and more.

Beside other measurements, Milvus exposes following metrics that allow users to observe the health and performance of their vectorized index.

You can use Dynatrace to display, analyze and alert on many different Milvus telemetry metrics that can be categorized into the following three main areas:

• Milvus Performance Metrics • System Performance Metrics: Metrics relating to CPU/GPU usage, network traffic, and disk read speed. • Hardware Storage Metrics: Metrics relating to data size, data files, and storage capacity.

Milvus Performance Metrics

  • Insert per Second: Number of vectors that are inserted in a second. (Real-time display)
  • Queries per Minute: "Queries Per Minute" (QPM) is a performance metric employed in technical documentation to gauge a system's efficiency in processing search queries within a designated timeframe, typically a minute. This metric is derived by dividing the total number of executed queries by the duration of the observed time period. For example, if a system completes 100 search queries in 5 minutes, the QPM would be calculated as 20 QPM. QPM is instrumental in assessing the responsiveness and effectiveness of systems, particularly in real-time applications where timely query processing is critical. It serves as a key indicator for developers to optimize algorithms and resources, identifying potential bottlenecks and improving overall system performance. Interpretation of QPM is often complemented by considering other metrics like query elapsed time and resource utilization, providing a comprehensive view of a system's efficiency in handling search queries.
  • Query Time per Vector: Average time to query one vector. Divide the query elapsed time by the number of queried vectors.
  • Query Service Level: Query service level = n_queries_completed_within_threshold1 / n_queries. Generally, it is recommended to set 3 time periods - threshold1, threshold2, and threshold3, to track the query service level.
  • Uptime

Milvus System Performance Metrics

-GPU Utilization: GPU utilization ratio (%).

  • GPU Memory Usage: GPU memory (GB) currently consumed by Milvus.
  • CPU Utilization: CPU utilization ratio (%). Divide the time that the server is busy by the total elapsed time.
  • Memory Usage: Memory (GB) currently consumed by Milvus.
  • Cache Utilization: Cache utilization ratio (%).

-Network IO: Network IO read/write speed (GB/s).

  • Disk Read Speed: Disk read speed (GB/s).
  • Disk Write Speed: Disk write speed (GB/s).

Milvus Hardware storage metrics

-Data Size: Total amount (GB) of data stored in Milvus. Total File: Number of data files currently stored in Milvus.

Dynatrace
Documentation
By Dynatrace
Dynatrace support center
Copy to clipboard
Dynatrace Hub
Hub HomeGet data into DynatraceBuild your own app
Dynatrace Intelligence - Agentic Operations SystemThe Dynatrace Agentic AI ecosystem
Log Management and AnalyticsKubernetesAI and LLM ObservabilityInfrastructure ObservabilitySoftware DeliveryApplication ObservabilityApplication SecurityBusiness ObservabilityDigital Experience
Filter
Type
Built and maintained by
Deployment model
SaaS
  • SaaS
  • Managed
Partner FinderBecome a partnerDynatrace Developer

65 Results

Found in 'All'

Databases logo

Databases

Monitor databases, prevent issues, and resolve incidents quickly in real time.

App
  • database
  • db
  • google cloud sql
  • hanadb
  • monitoring
  • mssql
  • MySQL
  • oracle
  • PostgreSQL
  • rds
  • saas
Oracle Database logo

Oracle Database

Observe, analyze and optimize the usage, health and performance of your database.

Extension
  • database
  • logs
  • monitoring
  • oracle
  • sql
Azure SQL Database logo

Azure SQL Database

Managed cloud database provided as part of Microsoft Azure.

Technology
  • cloud
Azure Database for MySQL logo

Azure Database for MySQL

Full observability of MySQL servers and database instances to ensure database health and performance.

Technology
  • cloud
Database Operations Agent logo

Database Operations Agent

Identify application slowdowns by automatically analyzing database performance.

Technology
  • database
  • agentic-operations-system
  • agentic-workflows
  • AI
  • db
  • MCP
  • Model Context Protocol
  • readymade-agent
  • sql
Custom database extension logo

Custom database extension

Execute generic database queries and ingest metrics and logs to Dynatrace.

Technology
  • database
  • Custom
  • extension
Azure Database for Maria DB logo

Azure Database for Maria DB

Full coverage of performance for critical workloads with AI-problem detection, availability, and more.

Technology
  • cloud
Azure Database for PostgreSQL logo

Azure Database for PostgreSQL

Full insight into database performance for critical workloads with AI-problem detection and more.

Technology
  • cloud
AWS Database Migration Service logo

AWS Database Migration Service

Makes it easy to migrate relational databases, and other types of data stores.

Technology
  • cloud
Amazon Quantum Ledger Database (QLDB) logo

Amazon Quantum Ledger Database (QLDB)

Ledger by a central trusted authority that provides an immutable, and cryptographically verifiable transaction log.

Technology
  • cloud
SAP HANA Database (remote monitoring) logo

SAP HANA Database (remote monitoring)

Easily understand the health and performance of your SAP HANA databases.

Extension
  • database
  • extension
  • hanadb
  • sap
  • sql
Amazon Relational Database Service (RDS) logo

Amazon Relational Database Service (RDS)

Instant insights and unified monitoring for optimal Amazon RDS performance.

Technology
  • database
  • log-ingest-integration-cloud:relational:database:service
  • amazon
  • aws
Couchbase logo

Couchbase

Couchbase Capella (SaaS) database monitoring.

Extension
  • database
  • full-stack
  • monitoring
  • noSQL
  • OneAgent
  • performance
IBM DB2 for LUW (remote monitoring) logo

IBM DB2 for LUW (remote monitoring)

Remotely collect monitoring metrics from your DB2 databases.

Extension
  • database
  • db2
  • ibm
  • linux
  • windows
Oracle Base DB and Autonomous DB on OCI logo

Oracle Base DB and Autonomous DB on OCI

Monitor health of the Oracle Base Service and Autonomous Database.

Extension
  • database
  • cloud
  • cloud-and-infrastructure
  • OCI
  • oracle
IBM DB2 logo

IBM DB2

Data management products, including database servers, developed by IBM.

Technology
  • database
  • ibm
  • mainframe
  • z/OS
Connection Pools: JBoss logo

Connection Pools: JBoss

Application server method of pooling and sharing connections to a database.

Extension
  • database
  • connection pool
  • java
  • jboss
  • JMX
  • OneAgent
  • open-source
  • pool
  • red-hat
  • wildfly
Connection Pools: C3P0 logo

Connection Pools: C3P0

Application server method of pooling and sharing connections to a database.

Extension
  • database
  • c3p0
  • connection pool
  • java
  • JMX
  • OneAgent
  • open-source
  • pool
Connection Pools: WebSphere Liberty logo

Connection Pools: WebSphere Liberty

Application server method of pooling and sharing connections to a database.

Extension
  • database
  • connection pool
  • ibm
  • java
  • JMX
  • liberty
  • OneAgent
  • pool
  • websphere
Connection Pools: WebLogic logo

Connection Pools: WebLogic

Application server method of pooling and sharing connections to a database.

Extension
  • database
  • connection pool
  • java
  • JMX
  • OneAgent
  • oracle
  • pool
  • weblogic
Apache CouchDB logo

Apache CouchDB

Intelligently observe and optimize health and performance of your database.

Extension
  • database
Connection Pools: Apache Commons logo

Connection Pools: Apache Commons

Application method of pooling and sharing multiple connections to a database.

Extension
  • database
  • apache
  • apache commons
  • connection pool
  • java
  • JMX
  • OneAgent
  • open-source
  • pool
Memcached logo

Memcached

Distributed caching system used to speed up dynamic database-driven websites.

Extension
  • database
  • cache
  • Memcached
Sybase ASE logo

Sybase ASE

Monitor Sybase ASE database for performance and health, using remote monitoring.

Extension
  • database
  • sap
  • sybase
MariaDB logo

MariaDB

Observe, analyze and optimize the usage, health and performance of your database.

Technology
  • database
  • full-stack
  • monitoring
Amazon Aurora logo

Amazon Aurora

Relational database service developed and offered by Amazon Web Services.

Technology
  • cloud
LanceDB logo

LanceDB

Monitor the performance of your multimodal AI database powered by LanceDB.

Technology

Pinecone logo

Pinecone

Gain insight into your Pinecone vector databases to build knowledgeable AI.

Technology

Milvus logo

Milvus

Gain insights about vector database resource utilization and cache behavior.

Technology

Java JDBC logo

Java JDBC

Application programming interface for the Java, defines access to a database.

Technology
  • java
Amazon DynamoDB logo

Amazon DynamoDB

Fully managed NoSQL database service that supports key-value and data structure.

Technology
  • amazon
  • log-ingest-integration-cloud:aws:dynamodb

Amazon Neptune logo

Amazon Neptune

Fast, reliable, fully managed graph database built for highly connected datasets.

Technology
  • cloud
Chroma logo

Chroma

Gain insights into the health of your vector and embedding databases from Chroma.

Technology

MySQL logo

MySQL

Automatically and intelligently observe, analyze and optimize how your the usage, health and performance of your database.

Technology
  • database
  • full-stack
  • monitoring
  • performance
  • web
Amazon Keyspaces for Apache Cassandra logo

Amazon Keyspaces for Apache Cassandra

Scalable, highly available, and managed Apache Cassandra–compatible database service.

Technology
  • cloud
WordPress logo

WordPress

Content management system written in PHP and paired with a MySQL or MariaDB database.

Technology
  • cms
  • php
  • web
Neo4j logo

Neo4j

Extend observability with PurePath® distributed traces by seamlessly integrating OpenTracing data emitted by the Neo4j graph database.

Technology
  • database
  • java
  • neo4j
  • opentracing
  • PurePath
Azure Synapse Analytics logo

Azure Synapse Analytics

Cloud-based, scale-out, relational database capable of processing massive volumes of data.

Technology
  • cloud
Azure SQL Managed logo

Azure SQL Managed

Full observability into cloud database performance and automated monitoring for Azure SQL Managed.

Technology
  • cloud
Amazon DocumentDB logo

Amazon DocumentDB

Amazon DocumentDB (with MongoDB compatibility) is a fast, reliable, and fully managed database service.

Technology
  • cloud
Azure Cosmos DB logo

Azure Cosmos DB

Fully managed and serverless distributed database supporting open-source PostgreSQL, MongoDB, and Apache Cassandra.

Technology
  • cloud
Snowflake for Workflows logo

Snowflake for Workflows

Access, query, and store Snowflake data to analyze further within Dynatrace.

App
  • database
  • automation
  • connector
  • connectors
  • snowflake
  • workflow
  • workflow action
  • workflow actions
  • workflows
Snowflake logo

Snowflake

Expand visibility to improve health and performance monitoring of your Snowflake.

Extension
  • database
  • logs
  • snowflake
  • sql
Elasticsearch logo

Elasticsearch

Monitor Elasticsearch Clusters, Nodes, Indexes, remotely or locally, via API.

Extension
  • database
  • Elasticsearch
  • search
Redis Enterprise - Prometheus logo

Redis Enterprise - Prometheus

Monitor Redis Enterprise with the official Redis Prometheus exporter.

Extension
  • database
  • cache
  • noSQL
  • Redis
  • redis
  • replication
  • shard
PostgreSQL logo

PostgreSQL

Monitor your Postgres performance via our new EF2.0 extension framework.

Extension
  • database
  • extension
  • logs
  • postgres
  • query
  • sql
Custom Extensions Creator logo

Custom Extensions Creator

Create custom extensions with a few clicks.

App
  • database
  • app
  • custom queries
  • datasource
  • extensions
  • JMX
  • Prometheus
  • queries
  • query
  • snmp
  • snmptraps
  • sql
  • WMI
Oracle GoldenGate logo

Oracle GoldenGate

Monitor Oracle GoldenGate for performance, usage, and availability.

Extension
  • database
  • oracle
  • sql
Oracle Exadata logo

Oracle Exadata

Monitor Oracle Exadata systems for performance, usage and availability.

Extension
  • database
  • exadata
  • oracle
MySQL (remote monitoring) logo

MySQL (remote monitoring)

Remotely monitor your MySQL instances, collect key KPIs and slow queries details.

Extension
  • database
  • MySQL