Skip to technology filters Skip to main content
Dynatrace Hub

Extend the platform,
empower your team.

Popular searches:
Home hero bg
MySQL (remote monitoring)MySQL (remote monitoring)
MySQL (remote monitoring)

MySQL (remote monitoring)

Remotely monitor your MySQL instances, collect key KPIs and slow queries details.

Extension
Free trialDocumentation
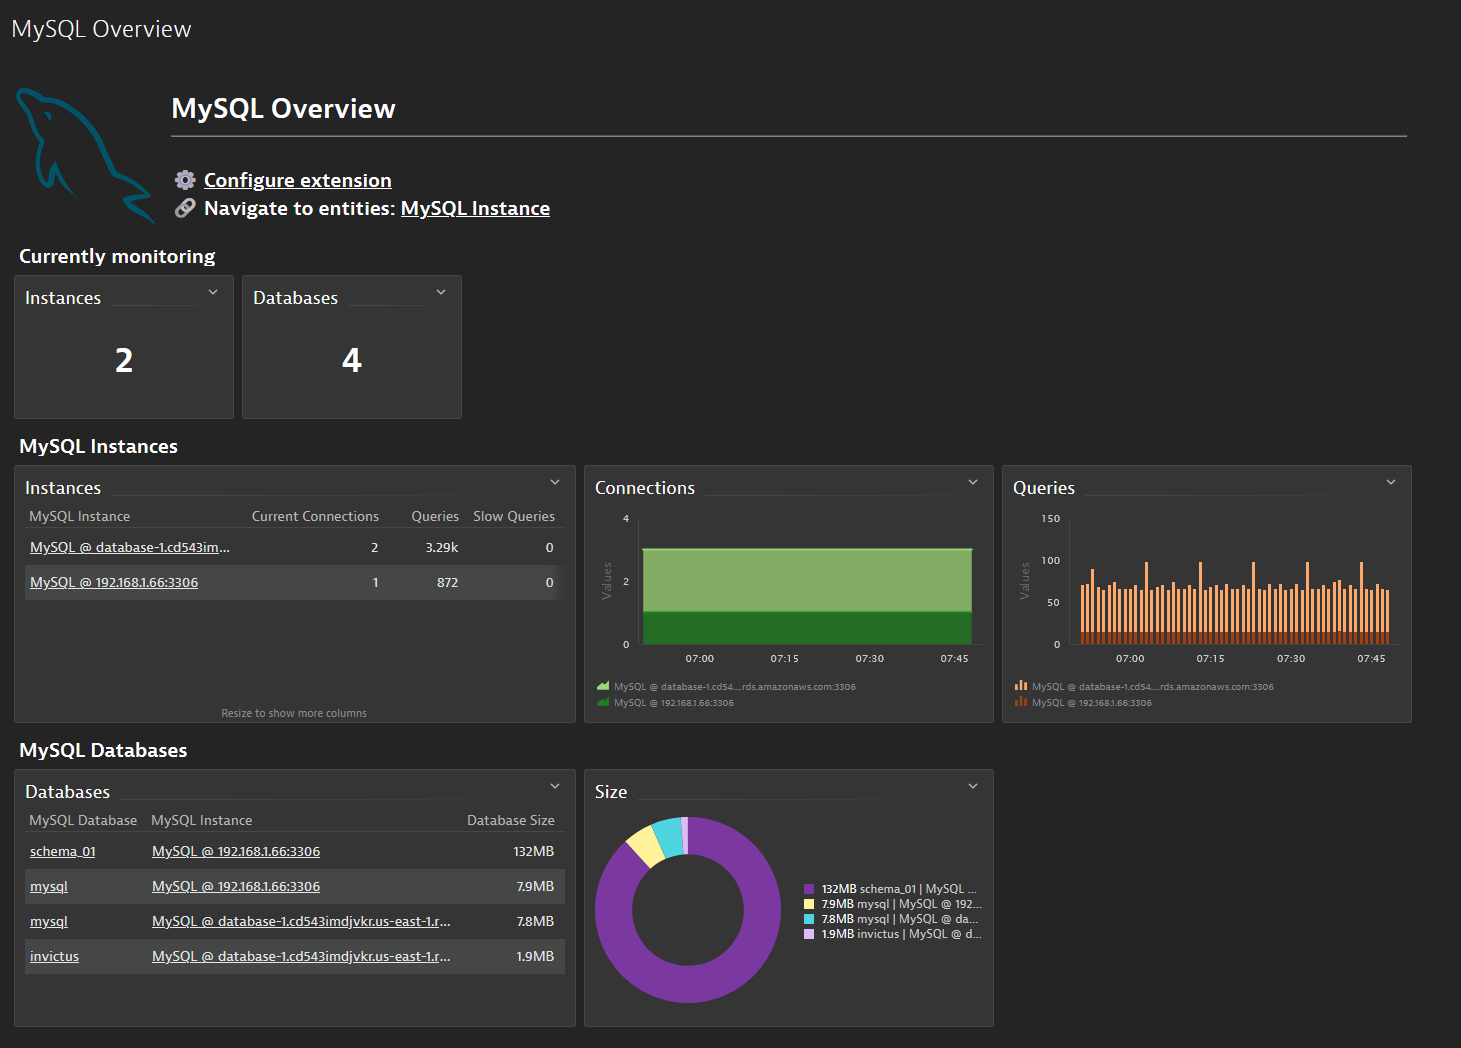
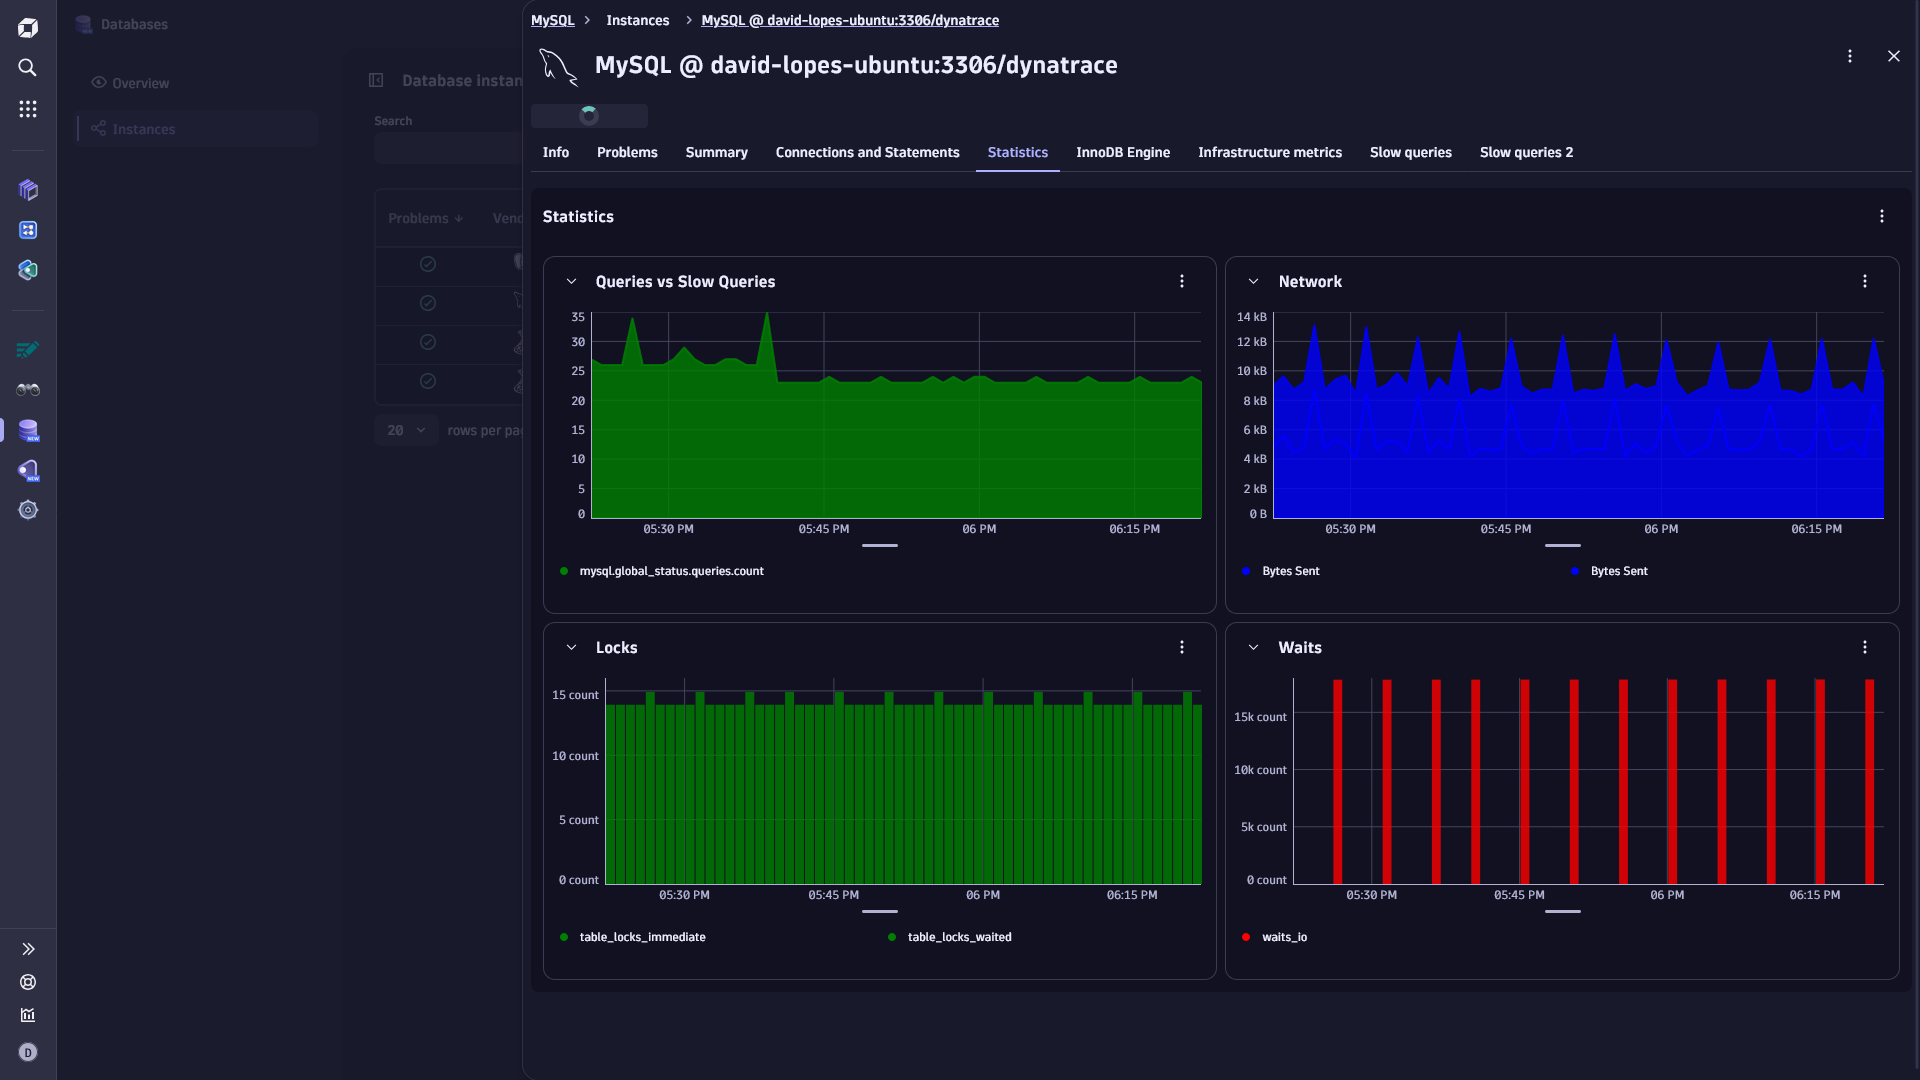
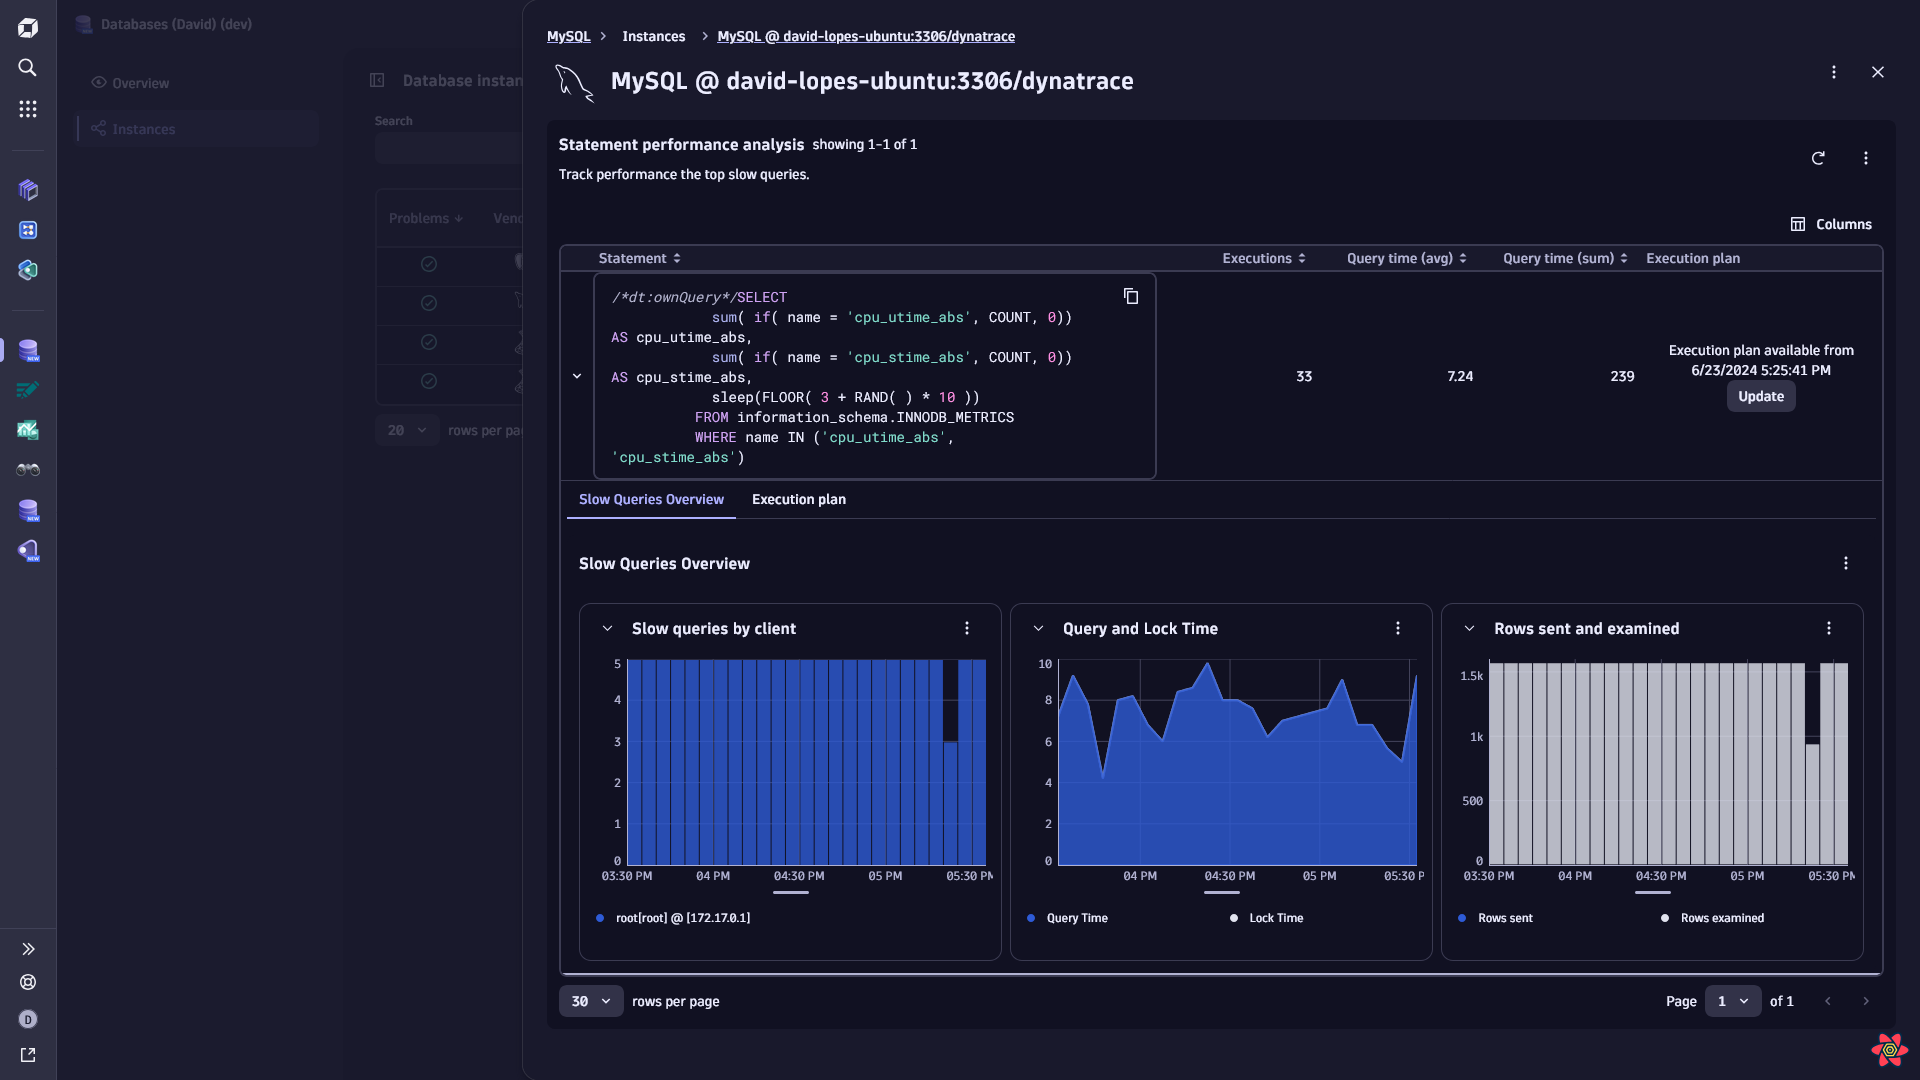
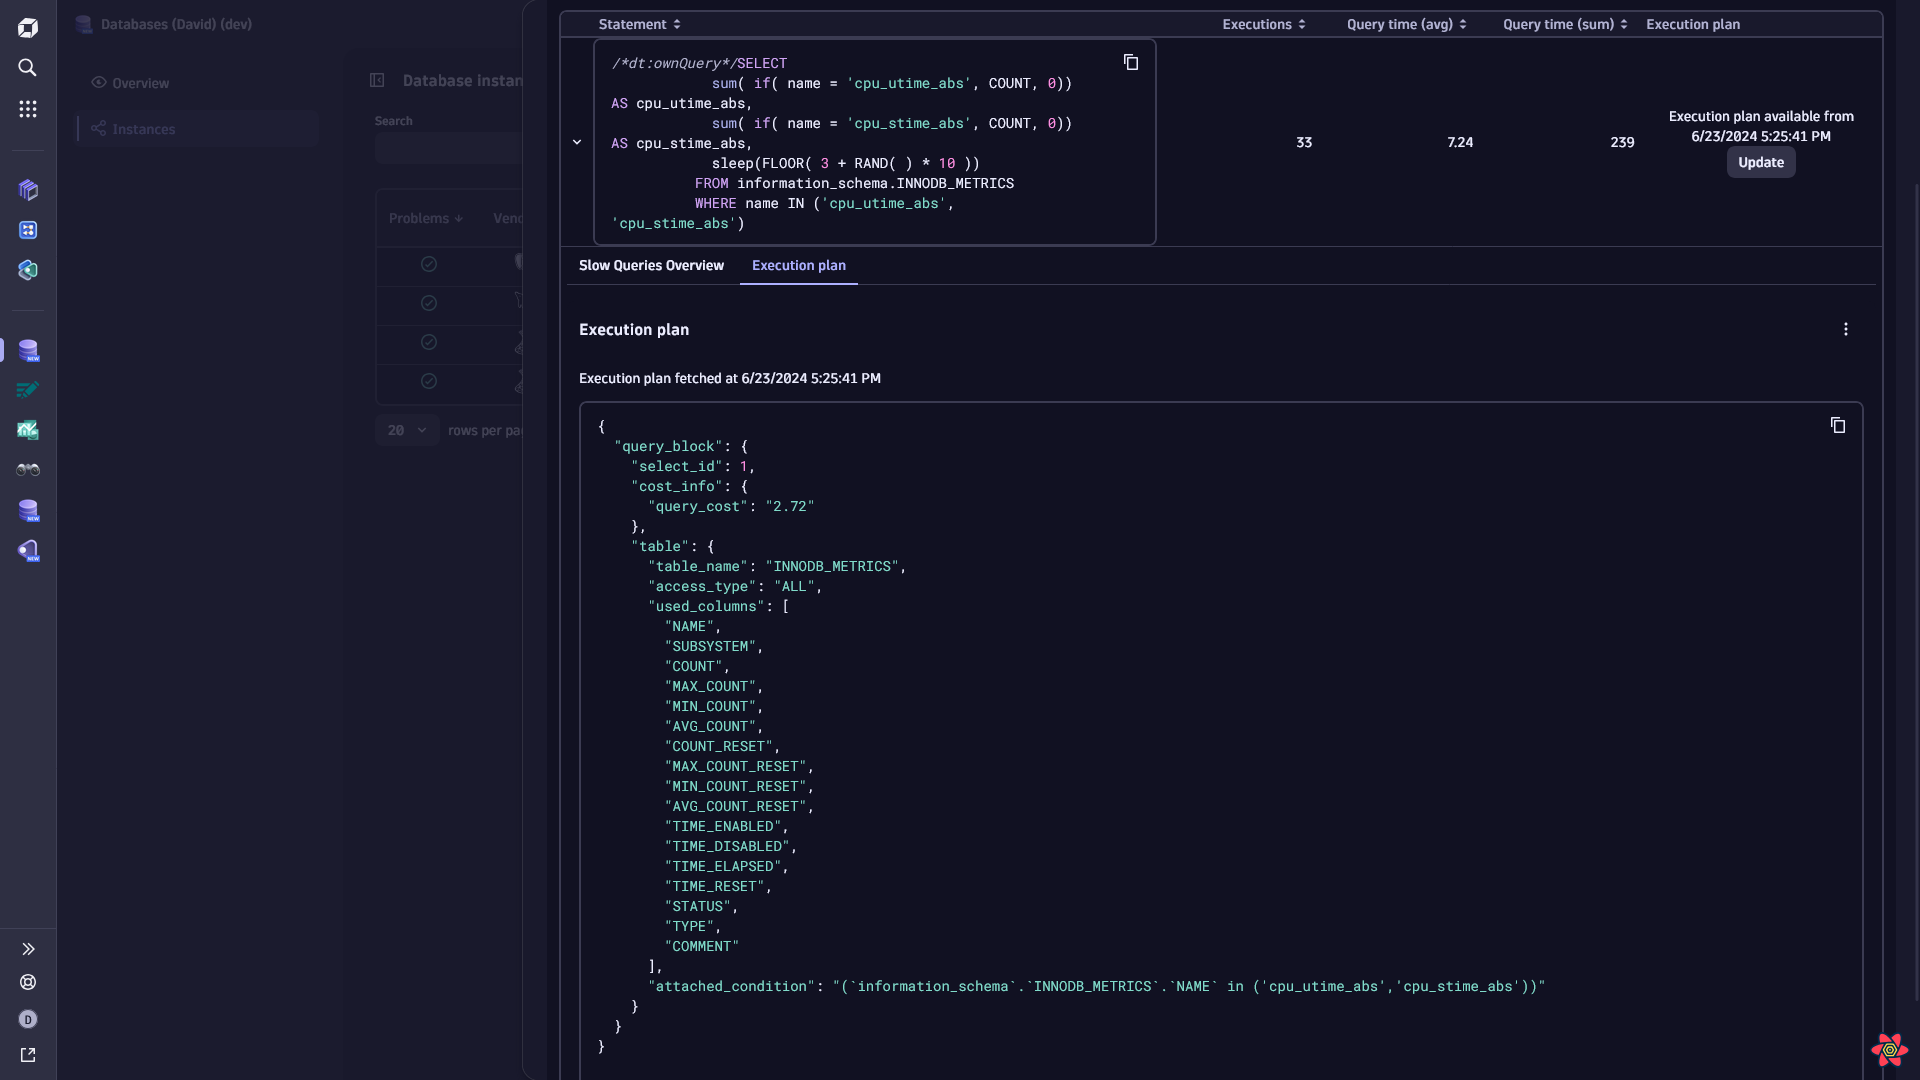
Overview dashboardInstance statistics on the new platformSlow queries viewExecution plan details
  • Product information
  • Release notes

Overview

Remotely monitor MySQL databases where you cannot install an OneAgent.

Get started

For more information on the installation and configuration, please see MySQL (remote monitoring) extension in the Dynatrace Documentation.

Details

Compatibility information

  • MySQL >= 8.0
Dynatrace
Documentation
By Dynatrace
Dynatrace support center
Subscribe to new releases
Copy to clipboard

Feature sets

Below is a complete list of the feature sets provided in this version. To ensure a good fit for your needs, individual feature sets can be activated and deactivated by your administrator during configuration.

Feature setsNumber of metrics included
Metric nameMetric keyDescriptionUnit
CPU Usermysql.infrastructure.cpu.userThe percentage of CPU time spent in user mode.Percent
CPU Systemmysql.infrastructure.cpu.systemThe percentage of CPU time spent in system mode.Percent
Memorymysql.infrastructure.memoryThe amount of memory used per each code area.Byte
Metric nameMetric keyDescriptionUnit
Waits IOmysql.waits.waits_io.countThe number of times that the server has waited for an I/O operation to complete.Count
Waits IO Timemysql.waits.waits_io_time.countThe total time the server has waited for I/O operations to complete.MilliSecond
Waits Syncmysql.waits.waits_sync.countThe number of times that the server has waited for a synchronization operation to complete.Count
Waits Sync Timemysql.waits.waits_sync_time.countThe total time the server has waited for synchronization operations to complete.MilliSecond
Metric nameMetric keyDescriptionUnit
Commitsmysql.statements.commit.countThe number of COMMIT statements executed by this serverCount
Deletesmysql.statements.delete.countThe number of DELETE statements executed by this serverCount
Multi-Table Deletesmysql.statements.delete_multi.countThe number of multi-table DELETE statements executed by this serverCount
Insertsmysql.statements.insert.countThe number of INSERT statements executed by this serverCount
Insert Selectsmysql.statements.insert_select.countThe number of INSERT ... SELECT statements executed by this serverCount
Selectsmysql.statements.select.countThe number of SELECT statements executed by this serverCount
Updatesmysql.statements.update.countThe number of UPDATE statements executed by this serverCount
Executesmysql.statements.execute.countThe number of EXECUTE statements executed by this serverCount
Multi-Table Updatesmysql.statements.update_multi.countThe number of multi-table UPDATE statements executed by this serverCount
Bytes Sentmysql.statements.bytes_sent.countThe number of bytes sent to all clientsByte
Bytes Receivedmysql.statements.bytes_received.countThe number of bytes received from all clientsByte
Rollbacksmysql.statements.rollback.countThe number of ROLLBACK statements executed by this serverCount
Replace Selectsmysql.statements.replace_select.countThe number of REPLACE ... SELECT statements executed by this serverCount
Metric nameMetric keyDescriptionUnit
Database Sizemysql.databases.sizeThe size of the Database.Byte
Database Queriesmysql.databases.queries.countNumber of queries executed for the database.Count
Database Rows Readmysql.databases.rows_read.countNumber of rows examined by queries executed for the database.Count
Database Rows Writtenmysql.databases.rows_written.countNumber of rows affected by queries executed for the database.Count
Metric nameMetric keyDescriptionUnit
Queriesmysql.global_status.queries.countThe total number of queries executed by the server. This includes statements executed within stored procedures, unlike the Questions variable.Count
Slow Queriesmysql.global_status.slow_queries.countThe number of queries that have taken more than long_query_time seconds. This counter increments regardless of whether the slow query log is enabled. For information about that log, see Section 5.4.5, The Slow Query Log.Count
Table Locks Waitedmysql.global_status.table_locks_waited.countThe number of times that a request for a table lock could not be granted immediately and a wait was needed. If this is high and you have performance problems, you should first optimize your queries, and then either split your table or tables or use replication.Count
Table Locks Immediatemysql.global_status.table_locks_immediate.countThe number of times that a request for a table lock could be granted immediately.Count
Current Connectionsmysql.global_status.current_connectionsThe number of currently open connections.Count
Threads Runningmysql.global_status.threads_runningThe number of threads that are not sleeping.Count
Innodb Buffer Pool Pages Datamysql.global_status.innodb_buffer_pool_pages_dataThe number of pages in the InnoDB buffer pool containing data. The number includes both dirty and clean pages. When using compressed tables, the reported Innodb_buffer_pool_pages_data value may be larger than Innodb_buffer_pool_pages_totalCount
Innodb Buffer Pool Pages Dirtymysql.global_status.innodb_buffer_pool_pages_dirtyThe current number of dirty pages in the InnoDB buffer pool.Count
Innodb Buffer Pool Pages Freemysql.global_status.innodb_buffer_pool_pages_freeThe number of free pages in the InnoDB buffer pool.Count
Innodb Buffer Pool Pages Totalmysql.global_status.innodb_buffer_pool_pages_totalThe total size of the InnoDB buffer pool, in pages. When using compressed tables, the reported Innodb_buffer_pool_pages_data value may be larger than Innodb_buffer_pool_pages_totalCount
Innodb Data Readsmysql.global_status.innodb_data_reads.countThe total number of data reads (OS file reads).Count
Innodb Data Writesmysql.global_status.innodb_data_writes.countThe total number of data writes.Count
Innodb Data Readmysql.global_status.innodb_data_read.countThe total amount of data read from files.Byte
Innodb Data Writtenmysql.global_status.innodb_data_written.countThe total amount of data written.Byte
Innodb Buffer Pool Readsmysql.global_status.innodb_buffer_pool_readsThe number of logical reads that InnoDB could not satisfy from the buffer pool, and had to read directly from disk.Count
Innodb Buffer Pool Read Requestsmysql.global_status.innodb_buffer_pool_read_requestsThe number of logical read requests.Count
Availabilitymysql.global_status.availabilityWhether or not a connection can be made to the databasePercent
Statusmysql.global_status.statusA status of AVAILABLE is returned if we can query the databaseState
Uptimemysql.global_status.uptimeThe time in seconds that the MySQL server has been running since it was started.Second
Metric nameMetric keyDescriptionUnit
Table Data Sizemysql.tables.data_sizeFor MyISAM, DATA_LENGTH is the length of the data file, in bytes. For InnoDB, DATA_LENGTH is the approximate amount of space allocated for the clustered index, in bytes. Specifically, it is the clustered index size, in pages, multiplied by the InnoDB page size.Byte
Table Index Sizemysql.tables.index_sizeFor MyISAM, INDEX_LENGTH is the length of the index file, in bytes. For InnoDB, INDEX_LENGTH is the approximate amount of space allocated for non-clustered indexes, in bytes. Specifically, it is the sum of non-clustered index sizes, in pages, multiplied by the InnoDB page size.Byte
Table Total Sizemysql.tables.total_sizeThe total size of the table, in bytes. This is the sum of data and index size.Byte
Table Estimated Rowsmysql.tables.estimated_rowsThe number of rows in the table. For InnoDB, this is an approximation. For MyISAM, this is an exact count.Count
Table Free Spacemysql.tables.free_spaceThe number of allocated but unused bytes.Byte
Table IO Eventsmysql.tables.io_events.countNumber of summarized events and the sum of the x_READ and x_WRITE columns.Count
Table IO Wait Timemysql.tables.io_wait_time.countTotal wait time of the summarized events that are timed.Second
Table IO Readmysql.tables.io_read.countNumber of all read operations, and the sum of the equivalent x_FETCH columns.Count
Table IO Read Wait Timemysql.tables.io_read_wait_time.countTotal wait time of all read operations that are timed.Second
Table IO Writemysql.tables.io_write.countNumber of all write operations, and the sum of the equivalent x_INSERT, x_UPDATE, and x_DELETE columns.Count
Table IO Write Wait Timemysql.tables.io_write_wait_time.countTotal wait time of all write operations that are timed.Second
Table IO Fetchmysql.tables.io_fetch.countNumber of all fetch operations.Count
Table IO Fetch Wait Timemysql.tables.io_fetch_wait_time.countTotal wait time of all fetch operations that are timed.Second
Table IO Insertmysql.tables.io_insert.countNumber of all insert operations.Count
Table IO Insert Wait Timemysql.tables.io_insert_wait_time.countTotal wait time of all insert operations that are timed.Second
Table IO Updatemysql.tables.io_update.countNumber of all update operations.Count
Table IO Update Wait Timemysql.tables.io_update_wait_time.countTotal wait time of all update operations that are timed.Second
Table IO Deletemysql.tables.io_delete.countNumber of all delete operations.Count
Table IO Delete Wait Timemysql.tables.io_delete_wait_time.countTotal wait time of all delete operations that are timed.Second
Index Sizemysql.indexes.index_sizeThe calculated size of the index in bytes. Derived by multiplying the number of 16KB pages by 16384.Byte
Index Scansmysql.indexes.scans.countThe total number of times this specific index was accessed or scanned by queries.Count
Index Rows Readmysql.indexes.rows_read.countThe number of read operations on the index structure itself. High values indicate heavy index traversal.Count
Index Rows Fetchedmysql.indexes.rows_fetched.countThe number of actual table rows retrieved using this index.Count
Index Rows Insertedmysql.indexes.rows_inserted.countThe number of rows inserted using this index.Count
Index Rows Updatedmysql.indexes.rows_updated.countThe number of rows updated using this index.Count
Index Rows Deletedmysql.indexes.rows_deleted.countThe number of rows deleted using this index.Count

Full version history

To have more information on how to install the downloaded package, please follow the instructions on this page.
ReleaseDate

Full version history

Fixed in this version:

  • Query used to collect mysql.tables.* metrics in tables feature set updated to fix issue with empty data being returned

Full version history

Breaking changes:

⚠️ Possible breaking changes and warnings - PLEASE READ before upgrading to this version ⚠️:

  • This version requires a minimum Dynatrace version of 1.338 and a minimum ActiveGate EEC version of 1.337.
  • This version includes a breaking change for 3rd gen environments:
    • With the inclusion of OpenPipeline pipelines, any logs emitted by this extension will be processed by a dedicated OpenPipeline pipeline instead of the classic pipeline. This means that classic rules will no longer be used on logs emitted by the extension. Please be sure to migrate any you still need to OpenPipeline rules.
    • Some field names are handled differently in OpenPipeline, e.g. capitalization. Please double-check any custom dashboards and alerts you have created for this extension.
    • Any dynamic pipelines that were configured to route metrics or logs coming from this extension will no longer be used as data will be statically routed to the extension-shipped pipeline.
    • Finally, you must opt-in to OpenPipeline configuration via Settings API – see documentation.
  • The new tables feature set introduced with this version is disabled by default and may cause high license consumption if enabled.

Features:

  • Smartscape 2.0 topology supporting, instance, database, table and index nodes.
  • New database metrics added:
    • mysql.databases.queries.count
    • mysql.databases.rows_read.count
    • mysql.databases.rows_written.count
  • The mysql.databases.size metric is now reported in bytes.
  • New tables feature set added with table and index-related metrics:
    • Metrics captured: mysql.tables.*, mysql.indexes.*.
    • Data captured every 15 mins by default, can be configured with Table query interval field.
  • The database schema is collected as a log every 24 hours.
  • New locks feature set added to capture blocking statements as logs.
  • Capture active connections info as logs.
  • Capture execution plans for top queries.
  • Add PII masking for active connections and slow queries.

⚠️ This version requires ActiveGate version 1.337.0 or higher.

Full version history

  • Added feature set metadata for recommended metrics

Full version history

  • Update entity links on gen 3 dashboard to link to I&O app
  • Ensure required dimensions exist for entity creation
  • Changed format of queries used to retrieve statement counts, in order to produce more accurate counts for Deletes, Inserts and Updates
  • New metrics added:
    • mysql.statements.insert_select.count
    • mysql.statements.replace_select.count
    • mysql.statements.rollback.count

Full version history

New in this version:

  • Added ALERT_TEMPLATES for anomaly detectors in the Davis Anomaly Detection app.

Full version history

Version 2.1.10

  • Fixed legend in Network DQL chart
  • Internal metadata update

Full version history

Version 2.1.8

  • Replace cpu_utime_abs and cpu_system_abs with cpu_utime_pct and cpu_system_pct to accurately represent the average CPU usage taking in consideration the amount of CPU cores in the machine.

Full version history

Version 2.1.7

  • Add metadata for the "Queries" metric.

Full version history

Breaking changes/action required:

Added new top_queries feature set to collect slow query data via performance schema.
Please see "Collecting Top Slow Queries" section of Hub documentation for instructions to enable monitoring.
Existing feature set slow_queries will be deprecated in a future release.

New in this version:

  • Added 2 new metrics for cache hit ratio: mysql.global_status.innodb_buffer_pool_reads, mysql.global_status.innodb_buffer_pool_read_requests
  • Updated display name of server_version instance attribute to "DB Instance Version"
  • Added Gen3/Platform dashboard "MySQL Overview"
  • Added dt.security_context attribute to entities created by this extension

Full version history

Version 2.1.3

  • Added server_version as metric dimension for global_status metrics, and instance entity attribute

Full version history

Version 2.1.2

  • Add variables for the data collection frequency

Full version history

Version 2.1.1

  • Fix an issue where the wait times metrics were not correctly converted to Milliseconds

Full version history

Changes

  • The bytes sent visualization no longer shows negative values

Full version history

Version 2.0.6

🚀 Features

  • There is a now a SAME_AS relationship between a MySQL instance and its Process Group Instance.

Full version history

Fixed in this version:

  • Sorting SQL statements would produce duplicate results

Full version history

Version 2.0.1

  • Add support for execution plan fetching, please check the hub page for details
  • Add screen definitions for the 3rd gen platform

Note: these features require Activegate 1.293+

Full version history

Version 1.1.3

  • Fix an issue with the configure extension link in the overview dashboard

Full version history

Version 1.1.2

Add metrics:

  • mysql.global_status.availability
  • mysql.global_status.status

Full version history

Version 1.1.1

  • Fix an issue where MySQL entities were created from unrelated logs

Full version history

Version 1.1.0

  • Add CPU metrics
  • Add Memory metrics
  • Add Slow Queries (log events)

Full version history

Version 1.0.0

  • First release, instance and database metrics
Dynatrace Hub
Hub HomeGet data into DynatraceBuild your own app
Dynatrace Intelligence - Agentic Operations SystemThe Dynatrace Agentic AI ecosystem
Log Management and AnalyticsKubernetesAI and LLM ObservabilityInfrastructure ObservabilitySoftware DeliveryApplication ObservabilityApplication SecurityBusiness ObservabilityDigital Experience
Filter
Type
Built and maintained by
Deployment model
SaaS
  • SaaS
  • Managed
Partner FinderBecome a partnerDynatrace Developer

65 Results

Found in 'All'

Databases logo

Databases

Monitor databases, prevent issues, and resolve incidents quickly in real time.

App
  • database
  • db
  • google cloud sql
  • hanadb
  • monitoring
  • mssql
  • MySQL
  • oracle
  • PostgreSQL
  • rds
  • saas
Oracle Database logo

Oracle Database

Observe, analyze and optimize the usage, health and performance of your database.

Extension
  • database
  • logs
  • monitoring
  • oracle
  • sql
Azure SQL Database logo

Azure SQL Database

Managed cloud database provided as part of Microsoft Azure.

Technology
  • cloud
Azure Database for MySQL logo

Azure Database for MySQL

Full observability of MySQL servers and database instances to ensure database health and performance.

Technology
  • cloud
Database Operations Agent logo

Database Operations Agent

Identify application slowdowns by automatically analyzing database performance.

Technology
  • database
  • agentic-operations-system
  • agentic-workflows
  • AI
  • db
  • MCP
  • Model Context Protocol
  • readymade-agent
  • sql
Custom database extension logo

Custom database extension

Execute generic database queries and ingest metrics and logs to Dynatrace.

Technology
  • database
  • Custom
  • extension
Azure Database for Maria DB logo

Azure Database for Maria DB

Full coverage of performance for critical workloads with AI-problem detection, availability, and more.

Technology
  • cloud
Azure Database for PostgreSQL logo

Azure Database for PostgreSQL

Full insight into database performance for critical workloads with AI-problem detection and more.

Technology
  • cloud
AWS Database Migration Service logo

AWS Database Migration Service

Makes it easy to migrate relational databases, and other types of data stores.

Technology
  • cloud
Amazon Quantum Ledger Database (QLDB) logo

Amazon Quantum Ledger Database (QLDB)

Ledger by a central trusted authority that provides an immutable, and cryptographically verifiable transaction log.

Technology
  • cloud
SAP HANA Database (remote monitoring) logo

SAP HANA Database (remote monitoring)

Easily understand the health and performance of your SAP HANA databases.

Extension
  • database
  • extension
  • hanadb
  • sap
  • sql
Amazon Relational Database Service (RDS) logo

Amazon Relational Database Service (RDS)

Instant insights and unified monitoring for optimal Amazon RDS performance.

Technology
  • database
  • log-ingest-integration-cloud:relational:database:service
  • amazon
  • aws
Couchbase logo

Couchbase

Couchbase Capella (SaaS) database monitoring.

Extension
  • database
  • full-stack
  • monitoring
  • noSQL
  • OneAgent
  • performance
IBM DB2 for LUW (remote monitoring) logo

IBM DB2 for LUW (remote monitoring)

Remotely collect monitoring metrics from your DB2 databases.

Extension
  • database
  • db2
  • ibm
  • linux
  • windows
Oracle Base DB and Autonomous DB on OCI logo

Oracle Base DB and Autonomous DB on OCI

Monitor health of the Oracle Base Service and Autonomous Database.

Extension
  • database
  • cloud
  • cloud-and-infrastructure
  • OCI
  • oracle
IBM DB2 logo

IBM DB2

Data management products, including database servers, developed by IBM.

Technology
  • database
  • ibm
  • mainframe
  • z/OS
Connection Pools: JBoss logo

Connection Pools: JBoss

Application server method of pooling and sharing connections to a database.

Extension
  • database
  • connection pool
  • java
  • jboss
  • JMX
  • OneAgent
  • open-source
  • pool
  • red-hat
  • wildfly
Connection Pools: C3P0 logo

Connection Pools: C3P0

Application server method of pooling and sharing connections to a database.

Extension
  • database
  • c3p0
  • connection pool
  • java
  • JMX
  • OneAgent
  • open-source
  • pool
Connection Pools: WebSphere Liberty logo

Connection Pools: WebSphere Liberty

Application server method of pooling and sharing connections to a database.

Extension
  • database
  • connection pool
  • ibm
  • java
  • JMX
  • liberty
  • OneAgent
  • pool
  • websphere
Connection Pools: WebLogic logo

Connection Pools: WebLogic

Application server method of pooling and sharing connections to a database.

Extension
  • database
  • connection pool
  • java
  • JMX
  • OneAgent
  • oracle
  • pool
  • weblogic
Apache CouchDB logo

Apache CouchDB

Intelligently observe and optimize health and performance of your database.

Extension
  • database
Connection Pools: Apache Commons logo

Connection Pools: Apache Commons

Application method of pooling and sharing multiple connections to a database.

Extension
  • database
  • apache
  • apache commons
  • connection pool
  • java
  • JMX
  • OneAgent
  • open-source
  • pool
Memcached logo

Memcached

Distributed caching system used to speed up dynamic database-driven websites.

Extension
  • database
  • cache
  • Memcached
Sybase ASE logo

Sybase ASE

Monitor Sybase ASE database for performance and health, using remote monitoring.

Extension
  • database
  • sap
  • sybase
MariaDB logo

MariaDB

Observe, analyze and optimize the usage, health and performance of your database.

Technology
  • database
  • full-stack
  • monitoring
Amazon Aurora logo

Amazon Aurora

Relational database service developed and offered by Amazon Web Services.

Technology
  • cloud
LanceDB logo

LanceDB

Monitor the performance of your multimodal AI database powered by LanceDB.

Technology

Pinecone logo

Pinecone

Gain insight into your Pinecone vector databases to build knowledgeable AI.

Technology

Milvus logo

Milvus

Gain insights about vector database resource utilization and cache behavior.

Technology

Java JDBC logo

Java JDBC

Application programming interface for the Java, defines access to a database.

Technology
  • java
Amazon DynamoDB logo

Amazon DynamoDB

Fully managed NoSQL database service that supports key-value and data structure.

Technology
  • amazon
  • log-ingest-integration-cloud:aws:dynamodb

Amazon Neptune logo

Amazon Neptune

Fast, reliable, fully managed graph database built for highly connected datasets.

Technology
  • cloud
Chroma logo

Chroma

Gain insights into the health of your vector and embedding databases from Chroma.

Technology

MySQL logo

MySQL

Automatically and intelligently observe, analyze and optimize how your the usage, health and performance of your database.

Technology
  • database
  • full-stack
  • monitoring
  • performance
  • web
Amazon Keyspaces for Apache Cassandra logo

Amazon Keyspaces for Apache Cassandra

Scalable, highly available, and managed Apache Cassandra–compatible database service.

Technology
  • cloud
WordPress logo

WordPress

Content management system written in PHP and paired with a MySQL or MariaDB database.

Technology
  • cms
  • php
  • web
Neo4j logo

Neo4j

Extend observability with PurePath® distributed traces by seamlessly integrating OpenTracing data emitted by the Neo4j graph database.

Technology
  • database
  • java
  • neo4j
  • opentracing
  • PurePath
Azure Synapse Analytics logo

Azure Synapse Analytics

Cloud-based, scale-out, relational database capable of processing massive volumes of data.

Technology
  • cloud
Azure SQL Managed logo

Azure SQL Managed

Full observability into cloud database performance and automated monitoring for Azure SQL Managed.

Technology
  • cloud
Amazon DocumentDB logo

Amazon DocumentDB

Amazon DocumentDB (with MongoDB compatibility) is a fast, reliable, and fully managed database service.

Technology
  • cloud
Azure Cosmos DB logo

Azure Cosmos DB

Fully managed and serverless distributed database supporting open-source PostgreSQL, MongoDB, and Apache Cassandra.

Technology
  • cloud
Snowflake for Workflows logo

Snowflake for Workflows

Access, query, and store Snowflake data to analyze further within Dynatrace.

App
  • database
  • automation
  • connector
  • connectors
  • snowflake
  • workflow
  • workflow action
  • workflow actions
  • workflows
Snowflake logo

Snowflake

Expand visibility to improve health and performance monitoring of your Snowflake.

Extension
  • database
  • logs
  • snowflake
  • sql
Elasticsearch logo

Elasticsearch

Monitor Elasticsearch Clusters, Nodes, Indexes, remotely or locally, via API.

Extension
  • database
  • Elasticsearch
  • search
Redis Enterprise - Prometheus logo

Redis Enterprise - Prometheus

Monitor Redis Enterprise with the official Redis Prometheus exporter.

Extension
  • database
  • cache
  • noSQL
  • Redis
  • redis
  • replication
  • shard
PostgreSQL logo

PostgreSQL

Monitor your Postgres performance via our new EF2.0 extension framework.

Extension
  • database
  • extension
  • logs
  • postgres
  • query
  • sql
Custom Extensions Creator logo

Custom Extensions Creator

Create custom extensions with a few clicks.

App
  • database
  • app
  • custom queries
  • datasource
  • extensions
  • JMX
  • Prometheus
  • queries
  • query
  • snmp
  • snmptraps
  • sql
  • WMI
Oracle GoldenGate logo

Oracle GoldenGate

Monitor Oracle GoldenGate for performance, usage, and availability.

Extension
  • database
  • oracle
  • sql
Oracle Exadata logo

Oracle Exadata

Monitor Oracle Exadata systems for performance, usage and availability.

Extension
  • database
  • exadata
  • oracle
MySQL (remote monitoring) logo

MySQL (remote monitoring)

Remotely monitor your MySQL instances, collect key KPIs and slow queries details.

Extension
  • database
  • MySQL