































































Skip to technology filters Skip to main content
Dynatrace Hub

Extend the platform,
empower your team.

Popular searches:
Home hero bg
Nutanix ClustersNutanix Clusters
Nutanix Clusters

Nutanix Clusters

Monitor Nutanix clusters' performance, usage and availability, with Nutanix API.

Extension
Free trialDocumentation
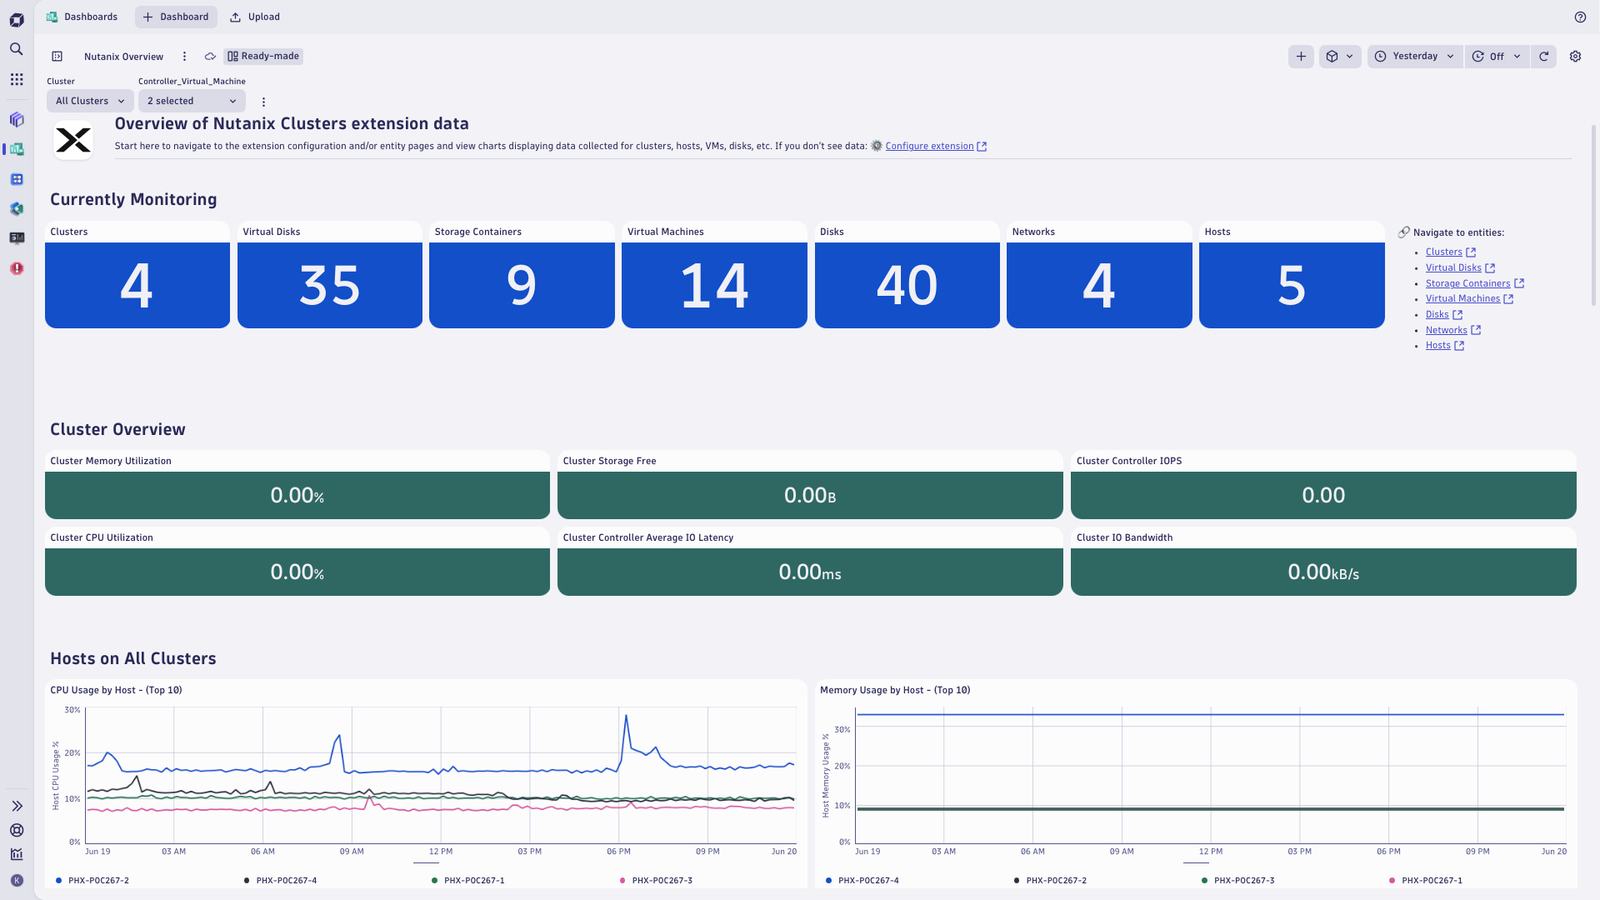
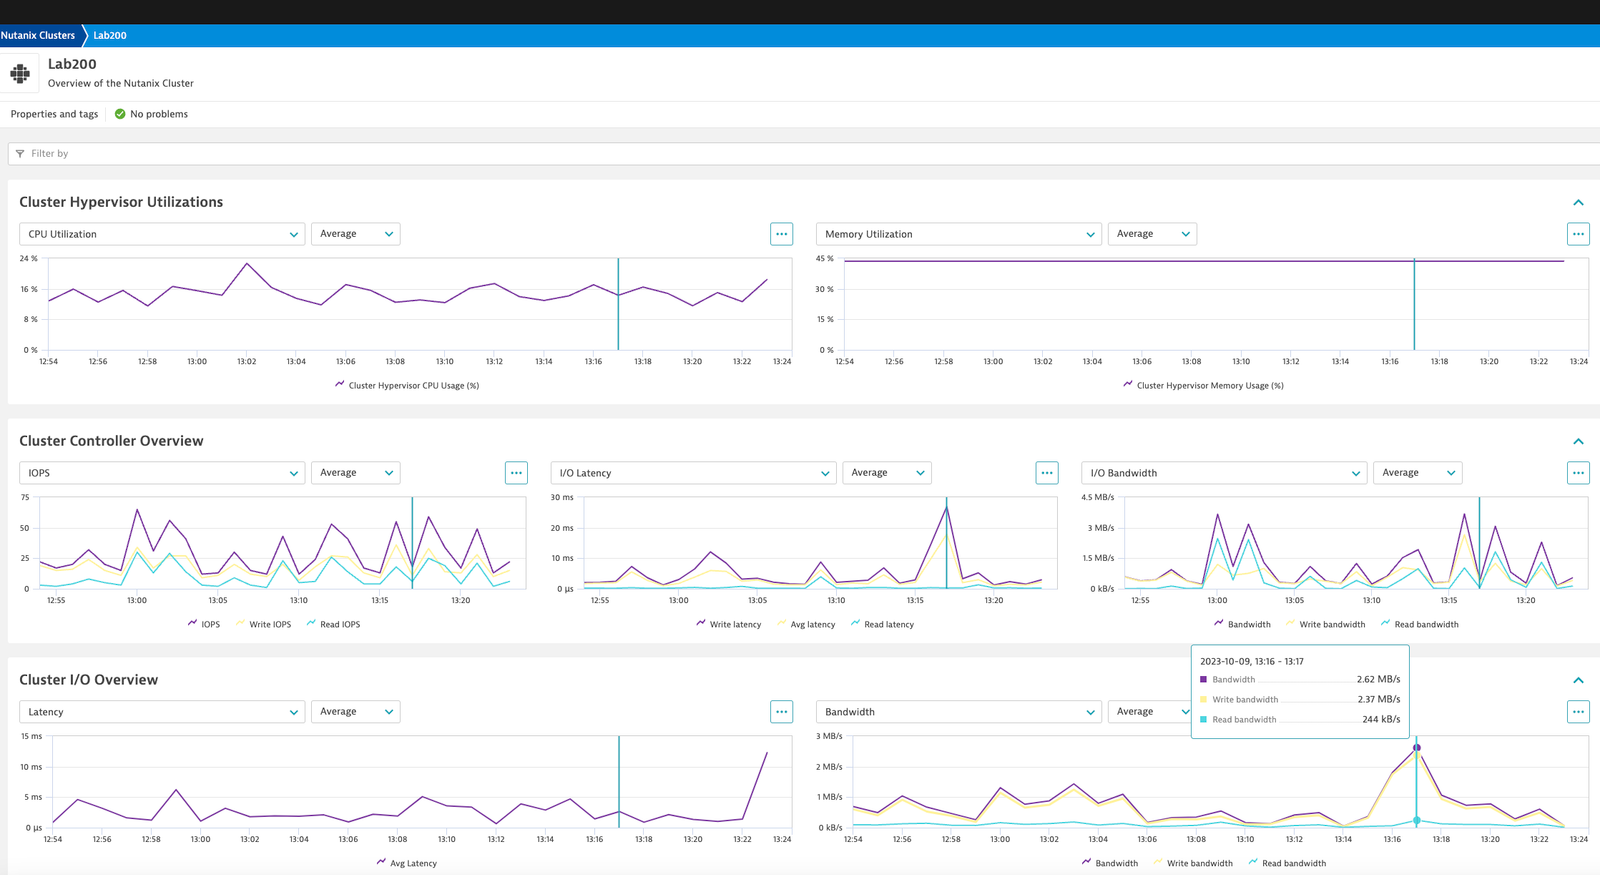
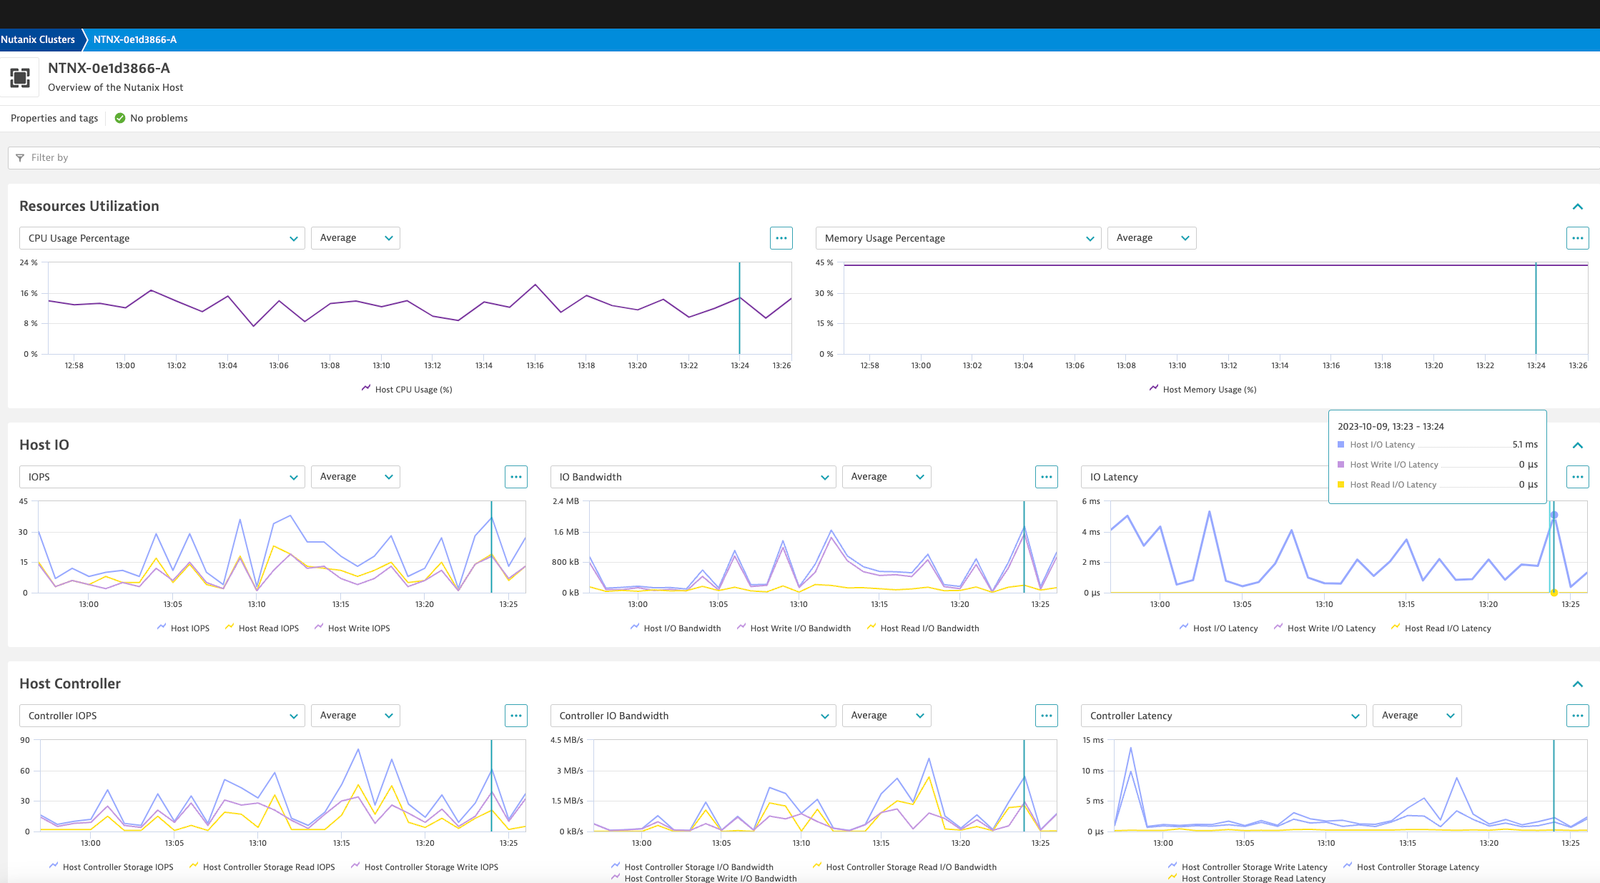
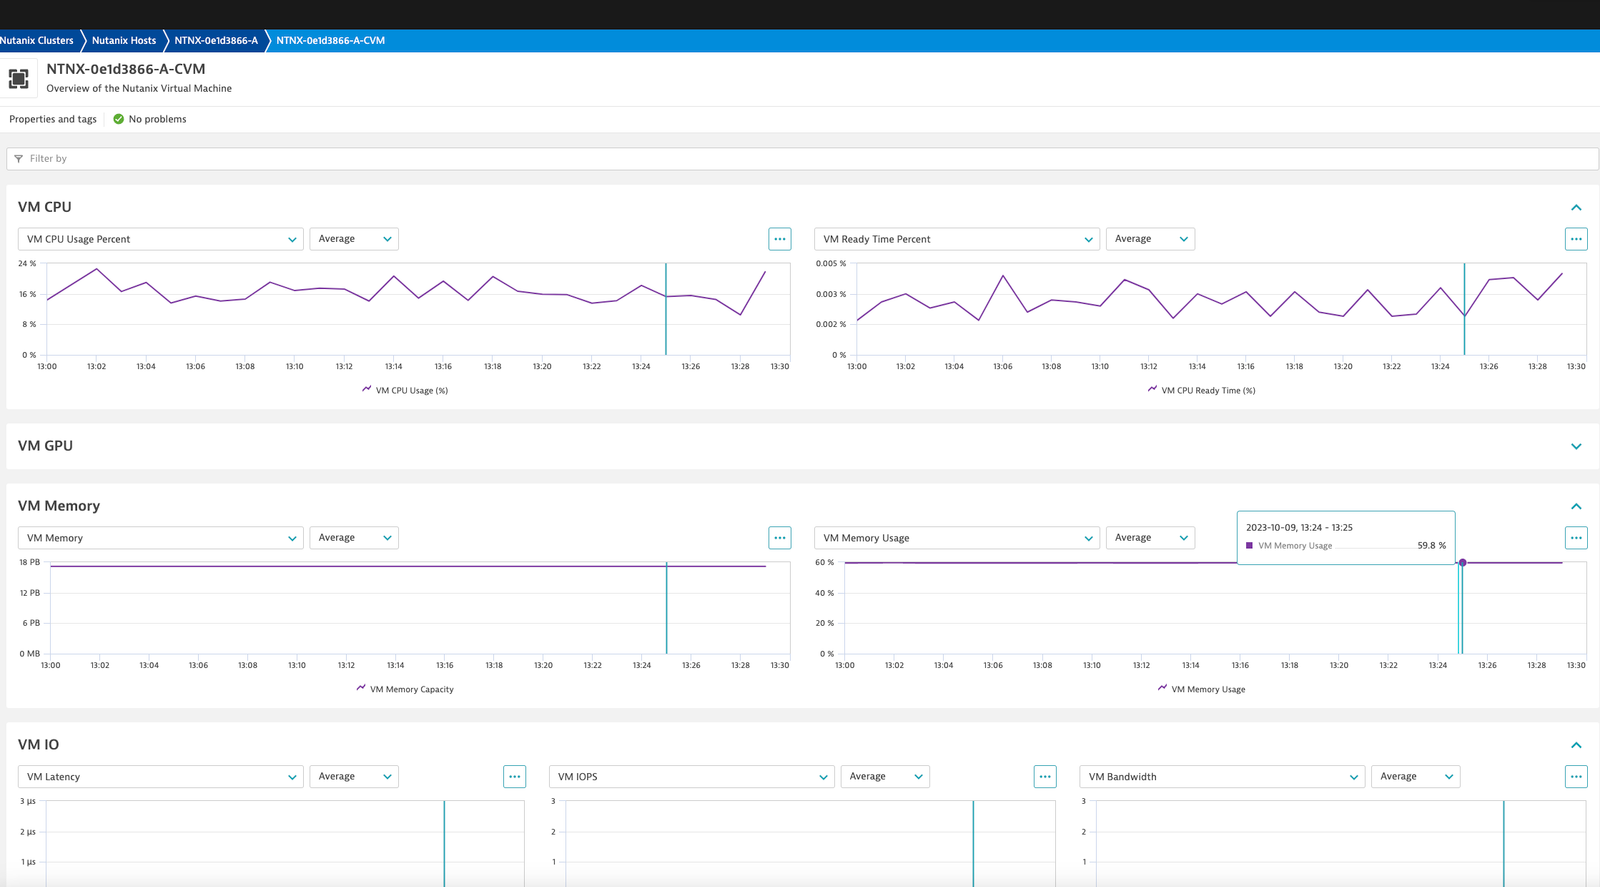
Nutanix overview dashboardNutanix cluster viewNutanix host performanceNutanix virtual machine
  • Product information
  • Release notes

Overview

Simplify monitoring of your Nutanix infrastructure. Focus on essential insights into your Nutanix clusters while retaining the context of the workloads and apps that the clusters enable. Leverage topological model that reflects the Nutanix platform composition to understand dependencies between Nutanix component operations and the performance of workloads that run on Nutanix. Automatically monitor dozens of Nutanix performance metrics, from hosts, through virtual machines and storage containers, down to disks and the network.

This extension is intended for users, who:

  • Run their workloads on Nutanix
  • Use Dynatrace to monitor workloads with Dynatrace OneAgent deployed on a virtual machine’s OS
  • Want to extend Dynatrace insights into the infrastructure on which VMs run and pinpoint the root causes of issues in their virtualization and application layers

This extension enables you to:

  • Monitor your Nutanix clusters using a Nutanix-specific entity model and comprehensive unified analysis views
  • Receive alerts on performance and availability issues detected in your Nutanix infrastructure
  • Take proactive actions based on anomalies detected in Nutanix infrastructure before they affect your applications

Note a breaking change with release 3.0 of this extension. Release 3.0 of this extension standardizes on Nutanix v4 API; Nutanix monitoring is now entirely based on Prism Central API. Previous releases used APIs v1 and v2, but these have been deprecated by Nutanix and soon won't be supported anymore (which means that monitoring via Prism Element API is not going to be available anymore). V4 API simplifies monitoring configuration and runtime, but also removes several metrics. Therefore, please revisit any metric alerts and dashboards you've created using metrics provided by the previously used extensions. You may need to replace previously used metrics with the new ones, or remove some visuals, as some metrics might have their IDs changed or they may have been removed entirely.

Use cases

  • Operational monitoring of your Nutanix clusters using Prism API in Dynatrace, integrated with related insights into the infrastructure and apps that your Nutanix clusters host.
  • Monitor resource utilization, latency, and bandwidth of clusters, hosts, virtual machines, and storage containers and receive alerts for detected anomalies.
  • Root cause analysis of Nutanix cluster performance bottlenecks, leveraging a dependency model that connects all the entities that comprise Nutanix clusters, all the way down to the OS instances that run the workflows monitored with Dynatrace OneAgent.

Get started

For more information on the installation and configuration, please see Nutanix Clusters extension in the Dynatrace Documentation.

Details

Compatibility information

  • A Nutanix cluster offering v4 API, reachable from an ActiveGate set up in your Dynatrace environment.
  • Nutanix v4 API connection details: Prism URL, user name, and password for authentication with the Prism v4 API.
  • A user account is required with granted the following roles (or equivalent), to view all resources:
    • Cluster Viewer
    • Storage Viewer
    • Virtual Machine Viewer
    • Network Infra Admin
    • Monitoring Viewer (required only if Alerts and Events need to be imported)

Supported Nutanix Versions:

The following Nutanix versions have been tested to work with the extension. Other versions of Nutanix not listed may be compatible with the extension.

  • AOS Versions: 7.x
  • Prism version: 2023.4 and newer
Dynatrace
DocumentationMore Information
By Dynatrace
Dynatrace support center
Subscribe to new releases
Copy to clipboard

Feature sets

Below is a complete list of the feature sets provided in this version. To ensure a good fit for your needs, individual feature sets can be activated and deactivated by your administrator during configuration.

Feature setsNumber of metrics included
Metric nameMetric keyDescriptionUnit
Host CPU Usage %nutanix_host_cpu_usage_percentCPU usage of the HostPercent
Host Memory Usage %nutanix_host_hypervisor_memory_usage_percentMemory usage of the HostPercent
Host Health Check Scorenutanix_host_health_check_scoreNCC check score indicating the health of the host. The value to health mapping is as follows. Good=100, Info=98, Warning=74, Critical=24, Error=13, Unknown=-1Count
Host Alertlog.nutanix_host_alertAlert on a Nutanix HostCount
Host Eventlog.nutanix_host_eventEvent on a Nutanix HostCount
Metric nameMetric keyDescriptionUnit
Disk IOPSnutanix_disk_io_iopsIOPS Count of the DiskCount
Disk Read IOPSnutanix_disk_io_read_iopsRead IOPS Count of the DiskCount
Disk Write IOPSnutanix_disk_io_write_iopsWrite IOPS Count of the DiskCount
Disk Latencynutanix_disk_io_latencyLatency of the DiskMicroSecond
Disk I/O Bandwidthnutanix_disk_io_bandwidthDisk I/O BandwidthKiloBytePerSecond
Disk I/O Read Bandwidthnutanix_disk_io_read_bandwidthDisk I/O Read BandwidthKiloBytePerSecond
Disk I/O Write Bandwidthnutanix_disk_io_write_bandwidthDisk I/O Write BandwidthKiloBytePerSecond
Disk Read I/O %nutanix_disk_read_io_percentPercentage of read I/O for a diskPercentage
Disk Write I/O %nutanix_disk_write_io_percentPercentage of write I/O for a diskPercentage
Metric nameMetric keyDescriptionUnit
Storage Container Free Space (Physical)nutanix_pool_storage_free_space_physicalPhysical free spaceByte
Storage Container Total Space (Physical)nutanix_pool_storage_total_space_physicalPhysical total spaceByte
Storage Container Physical Usagenutanix_pool_storage_physical_usagePhysical usage in bytesByte
Metric nameMetric keyDescriptionUnit
Cluster Hypervisor CPU Usage %nutanix_cluster_cpu_hypervisor_usage_percentHypervisor CPU usage in cluster as a percentagePercent
Cluster Hypervisor Memory Usage %nutanix_cluster_memory_hypervisor_usage_percentHypervisor memory usage in cluster as a percentagePercent
Cluster Health Check Scorenutanix_cluster_health_check_scoreNCC check score indicating the health of the cluster. The value to health mapping is as follows. Good=100, Info=98, Warning=74, Critical=24, Error=13, Unknown=-1Count
Cluster Alertlog.nutanix_cluster_alertAlert on a Nutanix ClusterCount
Cluster Eventlog.nutanix_cluster_eventEvent on a Nutanix ClusterCount
Metric nameMetric keyDescriptionUnit
Host Storage Logical Usage Bytesnutanix_host_storage_logical_usage_bytesStorage Logical Usage for the HostByte
Host Storage Capacity Bytesnutanix_host_storage_capacity_bytesStorage Capacity for the HostByte
Host Storage Usage Bytesnutanix_host_storage_usage_bytesStorage Usage for the HostByte
Host Storage Free Bytesnutanix_host_storage_free_bytesStorage free Space for the HostByte
Metric nameMetric keyDescriptionUnit
Cluster Controller IOPSnutanix_cluster_controller_iopsNumber of IOPS of the ControllerCount
Cluster Controller Read IOPSnutanix_cluster_controller_read_iopsNumber of Read IOPS of the ControllerCount
Cluster Controller Write IOPSnutanix_cluster_controller_write_iopsNumber of Write IOPS of the controllerCount
Cluster Controller AVG I/O Latencynutanix_cluster_controller_avg_io_latencyAverage I/O Latency of the ControllerMicroSecond
Cluster Controller AVG Read I/O Latencynutanix_cluster_controller_avg_read_io_latencyAverage Read I/O Latency of the ControllerMicroSecond
Cluster Controller AVG Write I/O Latencynutanix_cluster_controller_avg_write_io_latencyAverage Write I/O Latency of the ControllerMicroSecond
Cluster Controller Read I/O Bandwidthnutanix_cluster_controller_read_io_bandwidthI/O Read Bandwidth of the ControllerKiloBytePerSecond
Cluster Controller Write I/O Bandwidthnutanix_cluster_controller_write_io_bandwidthI/O Write Bandwidth of the ControllerKiloBytePerSecond
Metric nameMetric keyDescriptionUnit
Storage Container Controller IOPSnutanix_pool_io_controller_iopsController IOPS CountCount
Storage Container Controller Read IOPSnutanix_pool_io_controller_read_iopsController Read IOPS CountCount
Storage Container Controller Write IOPSnutanix_pool_io_controller_write_iopsController Write IOPS CountCount
Storage Container Controller Latencynutanix_pool_io_controller_latencyController LatencyMicrosecond
Storage Container Controller Read Latencynutanix_pool_io_controller_read_latencyController Read LatencyMicrosecond
Storage Container Controller Write Latencynutanix_pool_io_controller_write_latencyController Write LatencyMicrosecond
Storage Container Controller I/O Bandwidthnutanix_pool_io_controller_bandwidthController I/O BandwidthKiloBytePerSecond
Storage Container Controller Read I/O Bandwidthnutanix_pool_io_controller_read_bandwidthController Read I/O BandwidthKiloBytePerSecond
Storage Container Controller Write I/O Bandwidthnutanix_pool_io_controller_write_bandwidthController Write I/O BandwidthKiloBytePerSecond
Metric nameMetric keyDescriptionUnit
Cluster Storage Capacitynutanix_cluster_storage_capacityTotal storage capacity in bytes of the clusterByte
Cluster Storage Freenutanix_cluster_storage_freeTotal free storage in bytes for the clusterByte
Cluster Storage Logical Usagenutanix_cluster_storage_logical_usageTotal storage logical usage in bytes for the clusterByte
Cluster Storage Usagenutanix_cluster_storage_usageTotal storage usage in bytes of the clusterByte
Metric nameMetric keyDescriptionUnit
Virtual Disk Usagenutanix_virtual_disk_usageUsage of the virtual disk in bytesByte
Virtual Disk Capacitynutanix_virtual_disk_capacityCapacity of the virtual disk in bytesByte
Metric nameMetric keyDescriptionUnit
Disk Alertlog.nutanix_disk_alertAlert on a Nutanix DiskCount
Disk Eventlog.nutanix_disk_eventEvent on a Nutanix DiskCount
Metric nameMetric keyDescriptionUnit
Storage Container Alertlog.nutanix_pool_alertAlert on a Nutanix Storage ContainerCount
Storage Container Eventlog.nutanix_pool_eventEvent on a Nutanix Storage ContainerCount
Metric nameMetric keyDescriptionUnit
VM CPU Usage %nutanix_vm_cpu_usage_percentPercentage of CPU usage for Virtual MachinePercent
VM Memory Capacitynutanix_vm_memory_capacity_bytesMemory capacity in bytes given to Virtual MachineByte
VM Memory Usagenutanix_vm_memory_usage_percentVirtual Machine memory utilizationPercent
VM Alertlog.nutanix_vm_alertCount of alerts generated by VMCount
VM Eventlog.nutanix_vm_eventCount of events generated by VMCount
Metric nameMetric keyDescriptionUnit
VM Controller Storage IOPSnutanix_vm_controller_storage_iopsController Storage IOPS by Virtual MachineCount
VM Controller Storage Read IOPSnutanix_vm_controller_storage_read_iopsController Storage Read IOPS by Virtual MachineCount
VM Controller Storage Write IOPSnutanix_vm_controller_storage_write_iopsController Storage Write IOPS by Virtual MachineCount
VM Controller Storage Latencynutanix_vm_controller_storage_latencyController Storage Latency by Virtual MachineMicroSecond
VM Controller Storage Read Latencynutanix_vm_controller_storage_read_latencyController Storage Read Latency by Virtual MachineMicroSecond
VM Controller Storage Write Latencynutanix_vm_controller_storage_write_latencyController Storage Write Latency by Virtual MachineMicroSecond
VM Controller Storage I/O Bandwidthnutanix_vm_controller_storage_io_bandwidthController Storage Bandwidth by Virtual MachineKiloBytePerSecond
VM Controller Storage Read Bandwidthnutanix_vm_controller_storage_read_bandwidthController Storage Read Bandwidth by Virtual MachineKiloBytePerSecond
VM Controller Storage Write Bandwidthnutanix_vm_controller_storage_write_bandwidthController Storage Write Bandwidth by Virtual MachineKiloBytePerSecond
Metric nameMetric keyDescriptionUnit
Cluster I/O Bandwidthnutanix_cluster_io_bandwidthController I/O bandwidth in cluster in kilobytes per secondKiloBytePerSecond
Metric nameMetric keyDescriptionUnit
Network Free IPsnutanix_network_free_ipsNumber of free IPs in the networkCount
Network Assigned IPsnutanix_network_assigned_ipsNumber of assigned IPs in the networkCount
Network MAC Countnutanix_network_num_macsNumber of MAC addresses in the networkCount
Metric nameMetric keyDescriptionUnit
Host Controller Storage IOPSnutanix_host_controller_storage_iopsController Storage IOPS Count for the HostCount
Host Controller Storage Read IOPSnutanix_host_controller_storage_read_iopsController Storage Read IOPS Count for the HostCount
Host Controller Storage Write IOPSnutanix_host_controller_storage_write_iopsController Storage Write IOPS Count for the hostCount
Host Controller Storage Latencynutanix_host_controller_storage_latencyController Storage Latency for the HostMicroSecond
Host Controller Storage Read Latencynutanix_host_controller_storage_read_latencyController Storage Read Latency for the HostMicroSecond
Host Controller Storage Write Latencynutanix_host_controller_storage_write_latencyController Storage Write Latency for the HostMicroSecond
Host Controller Storage Read I/O Bandwidthnutanix_host_controller_storage_read_io_bandwidthStorage controller Read Bandwiidth for the HostKiloBytePerSecond
Host Controller Storage Write I/O Bandwidthnutanix_host_controller_storage_write_io_bandwidthStorage controller Write Bandwiidth for the HostKiloBytePerSecond
Metric nameMetric keyDescriptionUnit
Disk Storage Capacitynutanix_disk_storage_capacityStorage capacity of the DiskByte
Disk Storage freenutanix_disk_storage_freeFree Storage of the DiskByte
Disk Storage Usagenutanix_disk_storage_usageUsed Storage of the DiskByte
Metric nameMetric keyDescriptionUnit
VM Hypervisor I/O Latencynutanix_vm_hypervisor_io_latencyHypervisor I/O Latency for Virtual MachineMicroSecond
VM Hypervisor CPU Ready Time %nutanix_vm_hypervisor_cpu_ready_time_percentPercentage of Hypervisor CPU Ready TimePercent
VM Hypervisor CPU Usage %nutanix_vm_hypervisor_cpu_usage_percentPercentage of Hypervisor CPU UsagePercent
Metric nameMetric keyDescriptionUnit
Host I/O Bandwidthnutanix_host_io_bandwidth_kBpsAverage I/O bandwidth of all disks on host in kBpsKiloByte

Related to Nutanix Clusters

OneAgent logo

OneAgent

The simplest way to capture all observation signals automatically and in context.

Citrix DaaS & Virtual Apps and Desktops logo

Citrix DaaS & Virtual Apps and Desktops

Gain insight into your Citrix DaaS & Virtual Apps and Desktops environments.

Microsoft Hyper-V Infrastructure logo

Microsoft Hyper-V Infrastructure

Monitor health and performance of the Hyper-V clusters, hosts and VMs.

Pure Storage FlashArray logo

Pure Storage FlashArray

Monitor your Pure Storage FlashArray alerts, capacity, & performance metrics.

VMware (remote monitoring) logo

VMware (remote monitoring)

Monitor the health and performance of your VMware vSphere infrastructure!.

Full version history

To have more information on how to install the downloaded package, please follow the instructions on this page.
ReleaseDate

Full version history

Improved in this version

  • Added support for API key authentication.
  • Fixed multiple y-axis values for Classic Dashboard

Full version history

⚠️ Note: if you are upgrading straight from 3.x release, please have a look the version 4.0 release notes. Significant changes have been introduced in version 4.0.

Improved in this version

  • Resolved a problem causing no VMs to show up under Hosts in the Infastructure & Operations app.

Full version history

⚠️ WARNING ⚠️️: Possible breaking changes and warnings - PLEASE READ before upgrading:

  • This version requires a minimum Dynatrace version of 1.338.0 and a minimum EEC version of 1.333.0.
  • This version includes a potentially breaking change for Dynatrace on Grail.
    • With the inclusion of OpenPipeline processing rules, any metrics ingested from the extension will be processed by a dedicated OpenPipeline pipeline instead of the default pipeline.
    • This means that any created custom dynamic rules will no longer be used on metrics ingested from the extension. If you want to keep enforcing them, please create pipeline groups.
    • Additionally, some field names are handled differently in OpenPipeline, e.g. capitalization. Please double-check any custom dashboards and alerts you have created for this extension.
    • You must opt-in to OpenPipeline configuration via Settings API – see the documentation.

New in this version:

  • Smartscape on Grail. This extension will populate new Smartscape nodes and edges via OpenPipeline extraction.
  • Added feature set metadata for recommended metrics.
  • Added the option to use custom CA certificates for SSL validation.
  • Added a new relationship between Disks and Storage Containers.

Full version history

Improved in this version

  • Changed self monitoring metric key to sfm.nutanix_api_rate_limit_hit.
  • Resolved an issue that caused VM metrics to be rejected if the related Nutanix project name or description is longer than 255 characters.
  • Resolved an issue causing metrics to be rejected if their dimensions contained non-Unicode characters.
  • Resolved an issue causing Disk metrics to be rejected due to an invalid dimension length.
  • Resolved an issue causing Disk metrics not to be imported if all Cluster feature sets were disabled.
  • Resolved an issue causing relationships among entities not to be correctly generated.

Full version history

Improved in this version

  • Resolved an issue with dashboard links not opening on pure Gen3 tenants.
  • Added support for python 3.14

⚠️ Important Change

  • Monitoring endpoint TLS certificate verification is now ON by default. Extension upgrade also sets this option to ON even if it was OFF before the upgrade.
  • This means that if you had TLS certification disabled, your monitoring configuration may not work after the upgrade. If this is the case - please revisit every monitoring configuration and disable TLS certificate verification.
  • You can also disable TLS certificate verification when defining new monitoring configurations, if it is required in your environment.

Full version history

New in this version

  • Added an option to disable SSL verification in monitoring configuration.

Improved in this version

  • Resolved issue with dashboard links not opening on pure Gen3 tenants.

⚠️ Important Change

  • Monitoring endpoint TLS certificate verification is now ON by default. Extension upgrade also sets this option to ON even if it was OFF before the upgrade.
  • This means that if you had TLS certification disabled, your monitoring configuration may not work after the upgrade. If this is the case - please revisit every monitoring configuration and disable TLS certificate verification.
  • You can also disable TLS certificate verification when defining new monitoring configurations, if it is required in your environment.

Full version history

Improved in this version

  • Resolved issue with Hosts collection being halted if the IPMI address was missing from the API response.

Full version history

⚠️ Important Change

  • This release requires a Minimum Dynatrace Version version of 1.318.0 or higher.

New in this version

  • Added ALERT_TEMPLATES for anomaly detectors in the Davis Anomaly Detection app (latest Dynatrace only).

Improved in this version

  • Resolved issue with CPU attributes not being extracted correctly for VMs.
  • Resolved issue with VMs not being listed under their cluster in I&O App.

Full version history

Patch level changes

  • Resolved an issue causing a misalignment on the VM CPU Usage scale between Nutanix and Dynatrace.
  • Added error codes and EndpointStatuses reporting for better supportability.

Full version history

New features:

  • Nutanix audit logs import is now possible. Audit logs will show up as any other logs in Dynatrace, next to Nutanix Alerts and Events already imported.

Full version history

3.5.9

Published Thu Nov 13 2025

Patch level changes

  • Improved dashboard performance.
  • Improved monitoring configuration's form validation.
  • Added a self monitoring metric reporting the number of API rate limit hits, if any.

Past release notes

3.5.3

Published Tue Sep 23 2025

Patch level changes

  • Improved metric collection performances for Disks, VMs and Virtual Disks. Meaning: expect less metric collection timeouts or data gaps in large environments.

3.2.7

Published Mon Aug 04 2025

⚠️IMPORTANT CHANGE: This extension release requires Dynatrace cluster version 1.313 or later.

New features

  • The dt.security_context attribute is now propagated to all entities created by the extension. When enabling entity access control based on dt.security_context ensure you set the Grail security context destination property to dt.security_context
  • Enabled the extension to present the Dynatrace Platform (a.k.a. Gen3) entity details screens in the future platform apps that will expect these screens

Patch level changes

  • Fixed a bug which caused the most recent Nutanix Alert to be reported multiple times to Dynatrace
  • Added Memory Capacity as a dimension for Host metrics
  • Added Cores per CPU and Threads per Core as dimensions for VM metrics
  • Fixed an infrequent issue of metric data loss when Nutanix API calls returned large data sets that require pagination.

3.2.0

Published Tue Jul 22 2025

New features

  • Nutanix Projects are now imported as Dynatrace entities
  • Patch level changes
  • Improved handling of the Nutanix API calls to avoid hitting the call rate limits as much as possible
  • Fixed a bug affecting the Network metrics reporting

3.1.1

Published Fri Jul 11 2025

New features

  • Import Categories from Prism and report them as tags on Nutanix entities maintained by the extension

Patch level changes

  • Improved Alerts and Events ingest by fixing timestamp conversion issues and optimizing the process
  • Fixed issues with configuration fastcheck failing under certain conditions

3.0.9

Published Mon Jun 23 2025

New features

  • Added option to set a custom collection frequency for all entities

Patch level changes

  • Fixed a bug in Alerts and Events, showing up when some parameters were not present in the API response
  • Improved reliability of the way how Prism Central cluster is detected in the API response.

3.0.4

Published Wed Jun 11 2025

⚠️IMPORTANT CHANGE: This extension release requires Dynatrace cluster version 1.310 or later.

New features

  • Added the Dynatrace Platform (a.k.a. Gen3) dashboard

Patch level changes

  • Corrected VM IP address reporting
  • Added Volume Group UUID as dimension for Virtual Disks
  • Added checks on creation time and last updated time for Alerts and Events

3.0.1

Published Tue May 27 2025

New features

  • Release 3 of this extension standardizes on Nutanix v4 API.
  • For the record: monitoring is now entirely based on Prism Central API. Monitoring via Prism Element API (i.e API v1) is not available in this release, as it is being deprecated by Nutanix.

Note a breaking change:

  • Monitoring configurations need to be recreated after activating this new extension release.
  • Please revisit any metric alerts and dashboards you've created using metrics provided by the previously used extensions, as v4 API simplifies monitoring configuration and runtime, but also removes several metrics.
  • You may need to replace previously used metrics with the new ones, or remove some visuals, as some metrics might have their IDs changed or they may have been removed entirely.

2.1.25

Published Wed Sep 24 2025

Patch level changes

  • Added validity check of the Prism Element IPs returned by the Prism Central, in order to avoid querying endpoints that don't have API enabled

2.1.20

Published Thu Apr 17 2025

Patch level changes

  • Fix conditions on the HOST screen so relationships are populated correctly

2.1.18

Published Wed Apr 02 2025

New features

  • Added alert on VM migration
  • Added Dynatrace Platform (Gen3) dashboard to the extension

Patch level changes

  • Host screen for hosts monitored with OneAgent received a card that details the underlying Nutanix VM on which this host runs

2.1.16

Published Sat Mar 08 2025

Patch level changes

  • Fixed issue with reading local configuration file.

2.1.14

Published Fri Jan 10 2025

Patch level changes

  • Fixed topology relationships handling, to enable VM-to-monitored-host drill-through on analysis screens

2.1.11

Published Tue Oct 22 2024

Patch level changes

  • Trim dimension values if they are longer than allowed
  • Added defaults for entity type in alerts/events
  • Added optional logging to streamline future bug fixes
  • Fixed an issue that was occurring when some dimension of the Virtual Disk were null

2.1.5

Published Tue Aug 13 2024

Patch level changes

  • Fix regex filters in monitoring configuration, so that an entity is included if ANY regex matches
  • Fix issues with fast-check failing on some Prism Element endpoints

2.0.0

Published Wed Jul 03 2024

New features

  • Added support for Prism Central API. Refer to the hub tile text for details on the Prism Central configuration requirements.

1.2.40

New features

  • Additional properties added to events and alerts derived from logs
  • Credentials vault support

Patch level changes

  • Support both LQL and DQL in log-based metrics extraction

1.2.32

Published Fri Apr 05 2024

New features

  • Changed the way how extension ingests Alerts and Events import from Nutanix. Now Alerts and Events are ingested as log lines and not as metric points. This change enables high scalability and resiliency in case of increased alert/event volume from Nutanix, and it lets you analyze and react on alerts/events, including their text, using powerful log query language. Alert/event counters are still available as metrics.
  • Analysis screens have been updated to follow this change how alerts/events are handled.
  • Added SAME_AS relationship between discovered VMs and OneAgent-monitored instances of the guest OS, using IP address as the join property (in addition to already existing relationship for Nutanix hosts). This relationship enables:
  • Davis AI analytics to look together at metrics obtained by this extension and from OneAgent, to completely characterize monitored guest OS instances performance
  • Discovery and Coverage app to suggest which discovered VMs should be instrumented with OneAgent for full visibility into performance

Note: Breaking change. We had to force re-creation of the topology entities maintained by this extension, in order to efficiently enable OneAgent-discovered entity integration. If you created dashboards or alerts with entity selectors referencing Nutanix entities, these may need to be refreshed.

Note: Prism Central API is not yet supported by this extension. Point it to Prism Element API for successful activation. We work on Prism Central support and will update the extension at a later date.

1.2.18

Published Thu Nov 09 2023

No release notes

Full version history

Patch level changes:

  • Added validity check of the Prism Element IPs returned by the Prism Central, in order to avoid querying endpoints that don't have API enabled
Dynatrace Hub
Hub HomeGet data into DynatraceBuild your own app
Dynatrace Intelligence - Agentic Operations SystemThe Dynatrace Agentic AI ecosystem
All (914)Log Management and AnalyticsKubernetesAI and LLM ObservabilitySoftware DeliveryApplication ObservabilityApplication SecurityBusiness ObservabilityDigital Experience
Filter
Type
Built and maintained by
Deployment model
SaaS
  • SaaS
  • Managed
Partner FinderBecome a partnerDynatrace Developer

Infrastructure Observability

Get automatic and intelligent observability across cloud and hybrid environments with continuous auto-discovery of any type of infrastructure, all in context and with precise, AI-powered answers.

Essentials

Get automatic and intelligent infrastructure monitoring and observability across hybrid and cloud environments.

OneAgent logo

OneAgent

The simplest way to capture all observation signals automatically and in context.

Discovery & Coverage logo

Discovery & Coverage

Ensure enterprise-wide visibility. Discover and remediate coverage gaps.

Infrastructure & Operations logo

Infrastructure & Operations

Detailed hosts, process, and network insights across the entire environment.

Databases logo

Databases

Monitor databases, prevent issues, and resolve incidents quickly in real time.

Clouds logo

Clouds

Gain full visibility and proactive monitoring across your cloud infrastructure.

Hybrid cloud

AWS logo

AWS

Reliable, scalable, and inexpensive cloud computing services.

Microsoft Azure logo

Microsoft Azure

Cloud computing service for building, testing, deploying, and managing services.

Google Cloud logo

Google Cloud

Meet your business challenges head on with cloud computing services from Google.

VMware logo

VMware

Monitor health and performance of VMware virtual machines.

Nutanix Clusters logo

Nutanix Clusters

Monitor Nutanix clusters' performance, usage and availability, with Nutanix API.

Microsoft Hyper-V Infrastructure logo

Microsoft Hyper-V Infrastructure

Monitor health and performance of the Hyper-V clusters, hosts and VMs.

Technology coverage

F5 BIG-IP logo

F5 BIG-IP

Gain insights into the performance of your F5 BIG-IP LTM and DNS solutions.

Oracle Database logo

Oracle Database

Observe, analyze and optimize the usage, health and performance of your database.

Microsoft SQL Server logo

Microsoft SQL Server

Improve the health and performance monitoring of your Microsoft SQL Servers.

Also popular

See more (5)
Juniper Networks (SNMP) logo

Juniper Networks (SNMP)

Gain insights into the performance of your Juniper networking solutions.

SNMP Traps logo

SNMP Traps

Supplement network monitoring with event-based data reported via SNMP Traps.

Generic Cisco Device logo

Generic Cisco Device

Monitor Cisco devices using SNMP to feed Dynatrace with metrics and alerts.

Palo Alto firewalls logo

Palo Alto firewalls

Palo Alto extension for problems detection.

Remote Windows Host Monitoring logo

Remote Windows Host Monitoring

Monitor health and performance of Windows Hosts without installing an agent.

AWS Lambda logo

AWS Lambda

Automatic and intelligent end-to-end observability of AWS Lambda traces and logs.

More resources

Amazon API Gateway logo

Amazon API Gateway

Service for developers to create, publish, maintain, monitor, and secure APIs.

Amazon AppStream 2.0 logo

Amazon AppStream 2.0

Fully managed application streaming service that provides users with instant access to their desktop applications from anywhere.

Amazon Athena logo

Amazon Athena

Interactive query service that makes it easy to analyze data directly in Amazon S3 using standard SQL.

Amazon Aurora logo

Amazon Aurora

Relational database service developed and offered by Amazon Web Services.

Amazon CloudFront logo

Amazon CloudFront

Content delivery network offered by Amazon Web Services.

Amazon CloudSearch logo

Amazon CloudSearch

Set up, manage, and scale a search solution for your website or application using CloudSearch.

Amazon CloudWatch Logs logo

Amazon CloudWatch Logs

Monitor, store, and access your log files from instances, AWS CloudTrail, Route 53, and other sources.

Amazon Cognito logo

Amazon Cognito

Add user sign-up, sign-in, and access control to your web and mobile apps quickly and easily.

Amazon Connect logo

Amazon Connect

Easy to use omnichannel cloud contact center that helps you to provide superior customer service at a lower cost.

Amazon DocumentDB logo

Amazon DocumentDB

Amazon DocumentDB (with MongoDB compatibility) is a fast, reliable, and fully managed database service.

Amazon DynamoDB Accelerator (DAX) logo

Amazon DynamoDB Accelerator (DAX)

Fully managed, highly available, in-memory cache for your Amazon DynamoDB.

Amazon EC2 Auto Scaling logo

Amazon EC2 Auto Scaling

Amazon EC2 Auto Scaling helps you ensure that you have the correct number of Amazon EC2 instances available.

Amazon EC2 Spot Fleet logo

Amazon EC2 Spot Fleet

Spot Instances and On-Demand Instances to meet the target capacity that you specified.

Amazon Elastic Container Service (ECS) logo

Amazon Elastic Container Service (ECS)

Fully managed container orchestration service.

Amazon Elastic File Service (EFS) logo

Amazon Elastic File Service (EFS)

Cloud storage service provided by Amazon Web Services.

Amazon Elastic Transcoder logo

Amazon Elastic Transcoder

Convert and transcode media files stored in Amazon S3.

Amazon ElastiCache logo

Amazon ElastiCache

Fully managed, Redis- and Memcached-compatible service delivering real-time performance for modern applications by Amazon Web Services.

Amazon Elasticsearch Service logo

Amazon Elasticsearch Service

Fully managed service to deploy, secure, and run Elasticsearch cost effectively at scale, without the operational overhead.

Amazon EMR logo

Amazon EMR

Cloud big data platform for processing vast amounts of data using open source tools.

Amazon EventBridge logo

Amazon EventBridge

Serverless event bus to connect applications together using data from your own applications, integrated SaaS applications, and AWS services.

Amazon FSx for Lustre logo

Amazon FSx for Lustre

Makes it easy and cost-effective to launch and run the popular, high-performance Lustre file system.

Amazon FSx for Windows File Server logo

Amazon FSx for Windows File Server

Provides a managed Microsoft Windows file servers, backed by a native Windows file system.

Amazon GameLift logo

Amazon GameLift

Enables developers to deploy, operate, and scale dedicated, low-cost servers in the cloud for session-based, multiplayer games.

Amazon Inspector logo

Amazon Inspector

Tests the network accessibility of your EC2 instances and the security state of your applications that run on those instances.

AWS IoT logo

AWS IoT

Run local compute, messaging, data caching, and machine learning inference capabilities.

Amazon Keyspaces for Apache Cassandra logo

Amazon Keyspaces for Apache Cassandra

Scalable, highly available, and managed Apache Cassandra–compatible database service.

Amazon Kinesis Data Analytics logo

Amazon Kinesis Data Analytics

Transform and analyze streaming data in real time with open source framework and engine for processing data streams (Apache Flink).

Amazon Kinesis Data Firehose logo

Amazon Kinesis Data Firehose

Fully managed service for delivering real-time streaming data.

Amazon Kinesis Data Streams logo

Amazon Kinesis Data Streams

Collect log and event data from sources such as servers, desktops, and mobile devices.

Amazon Kinesis Video Streams logo

Amazon Kinesis Video Streams

Provides you SDKs to install on your devices to make it easy to stream media.

Amazon Lex logo

Amazon Lex

Service for building conversational interfaces for applications using voice and text.

Amazon MQ logo

Amazon MQ

Managed message broker service for Apache ActiveMQ that makes it easy to migrate to a message broker in the cloud.

Amazon MSK logo

Amazon MSK

Fully managed service that enables you to build and run applications that use Apache Kafka to process streaming data.

Amazon Neptune logo

Amazon Neptune

Fast, reliable, fully managed graph database built for highly connected datasets.

Amazon Polly logo

Amazon Polly

Cloud service that converts text into lifelike speech.

Amazon Quantum Ledger Database (QLDB) logo

Amazon Quantum Ledger Database (QLDB)

Ledger by a central trusted authority that provides an immutable, and cryptographically verifiable transaction log.

Amazon Redshift logo

Amazon Redshift

Data warehouse product which forms part of the larger cloud-computing platform AWS.

Amazon Rekognition logo

Amazon Rekognition

Amazon Rekognition makes it easy to add image and video analysis to your applications.

Amazon Route 53 logo

Amazon Route 53

Effectively connects user requests to infrastructure running in AWS.

Amazon Simple Email Service (SES) logo

Amazon Simple Email Service (SES)

Cloud-based service that helps developers send marketing, notification, and transactional emails.

Amazon Simple Notification Service (SNS) logo

Amazon Simple Notification Service (SNS)

Provides a simple web services interface that can be used to create topics you want to notify apps.

Amazon Simple Queue Service (SQS) logo

Amazon Simple Queue Service (SQS)

Programmatic sending of messages via web service applications.

Amazon Simple Workflow Service (SWF) logo

Amazon Simple Workflow Service (SWF)

Makes it easy to build applications that coordinate work across distributed components.

Amazon Textract logo

Amazon Textract

Makes it easy to add document text detection and analysis to your applications.

Amazon Transfer Family logo

Amazon Transfer Family

Provides fully managed support for file transfers directly into and out of Amazon S3 using SFTP, FTPS, and FTP.

Amazon Translate logo

Amazon Translate

Text translation service using machine learning to provide high-quality translation on demand.

Amazon VPC (NAT Gateway) logo

Amazon VPC (NAT Gateway)

Connect to the Internet from instances within a private subnet in an AWS Virtual Private Cloud.

Amazon WorkMail logo

Amazon WorkMail

Secure, managed business email and calendaring service with support for existing desktop and mobile email clients.

Are you looking for something different?

We have hundreds of apps, extensions, and other technologies to customize your environment

Extend your knowledge

Learn the Dynatrace Query Language

Learn the Dynatrace Query Language

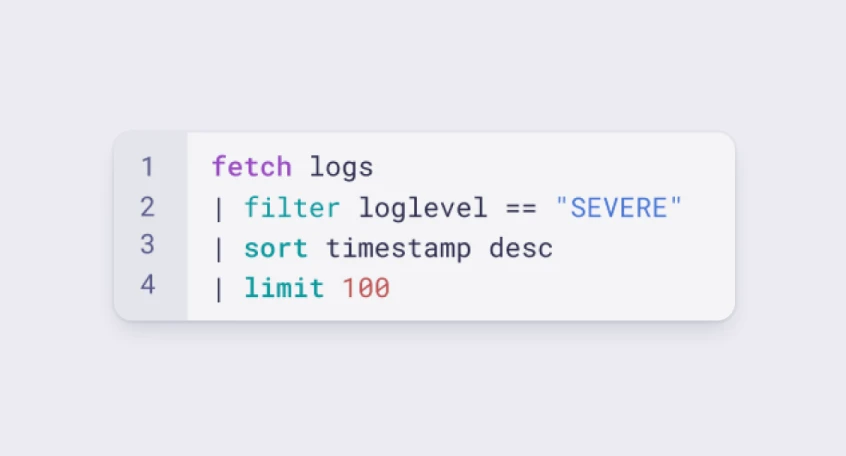
Explore data, discover patterns, anomalies and outliers, and create statistical modeling with DQL, our powerful query language..
Learn DQL

Get certified and advance your career

Get certified and advance your career

Go to Dynatrace University for practical, on-demand courses and learning paths -- from platform basics to key certifications.
Build skills