Skip to technology filters Skip to main content
Dynatrace Hub

Extend the platform,
empower your team.

Popular searches:
Home hero bg
OpenAIOpenAI
OpenAI

OpenAI

Monitoring your OpenAI & Azure OpenAI services such as GPT, o1, DALL-E, ChatGPT.

Technology
Free trialDocumentation
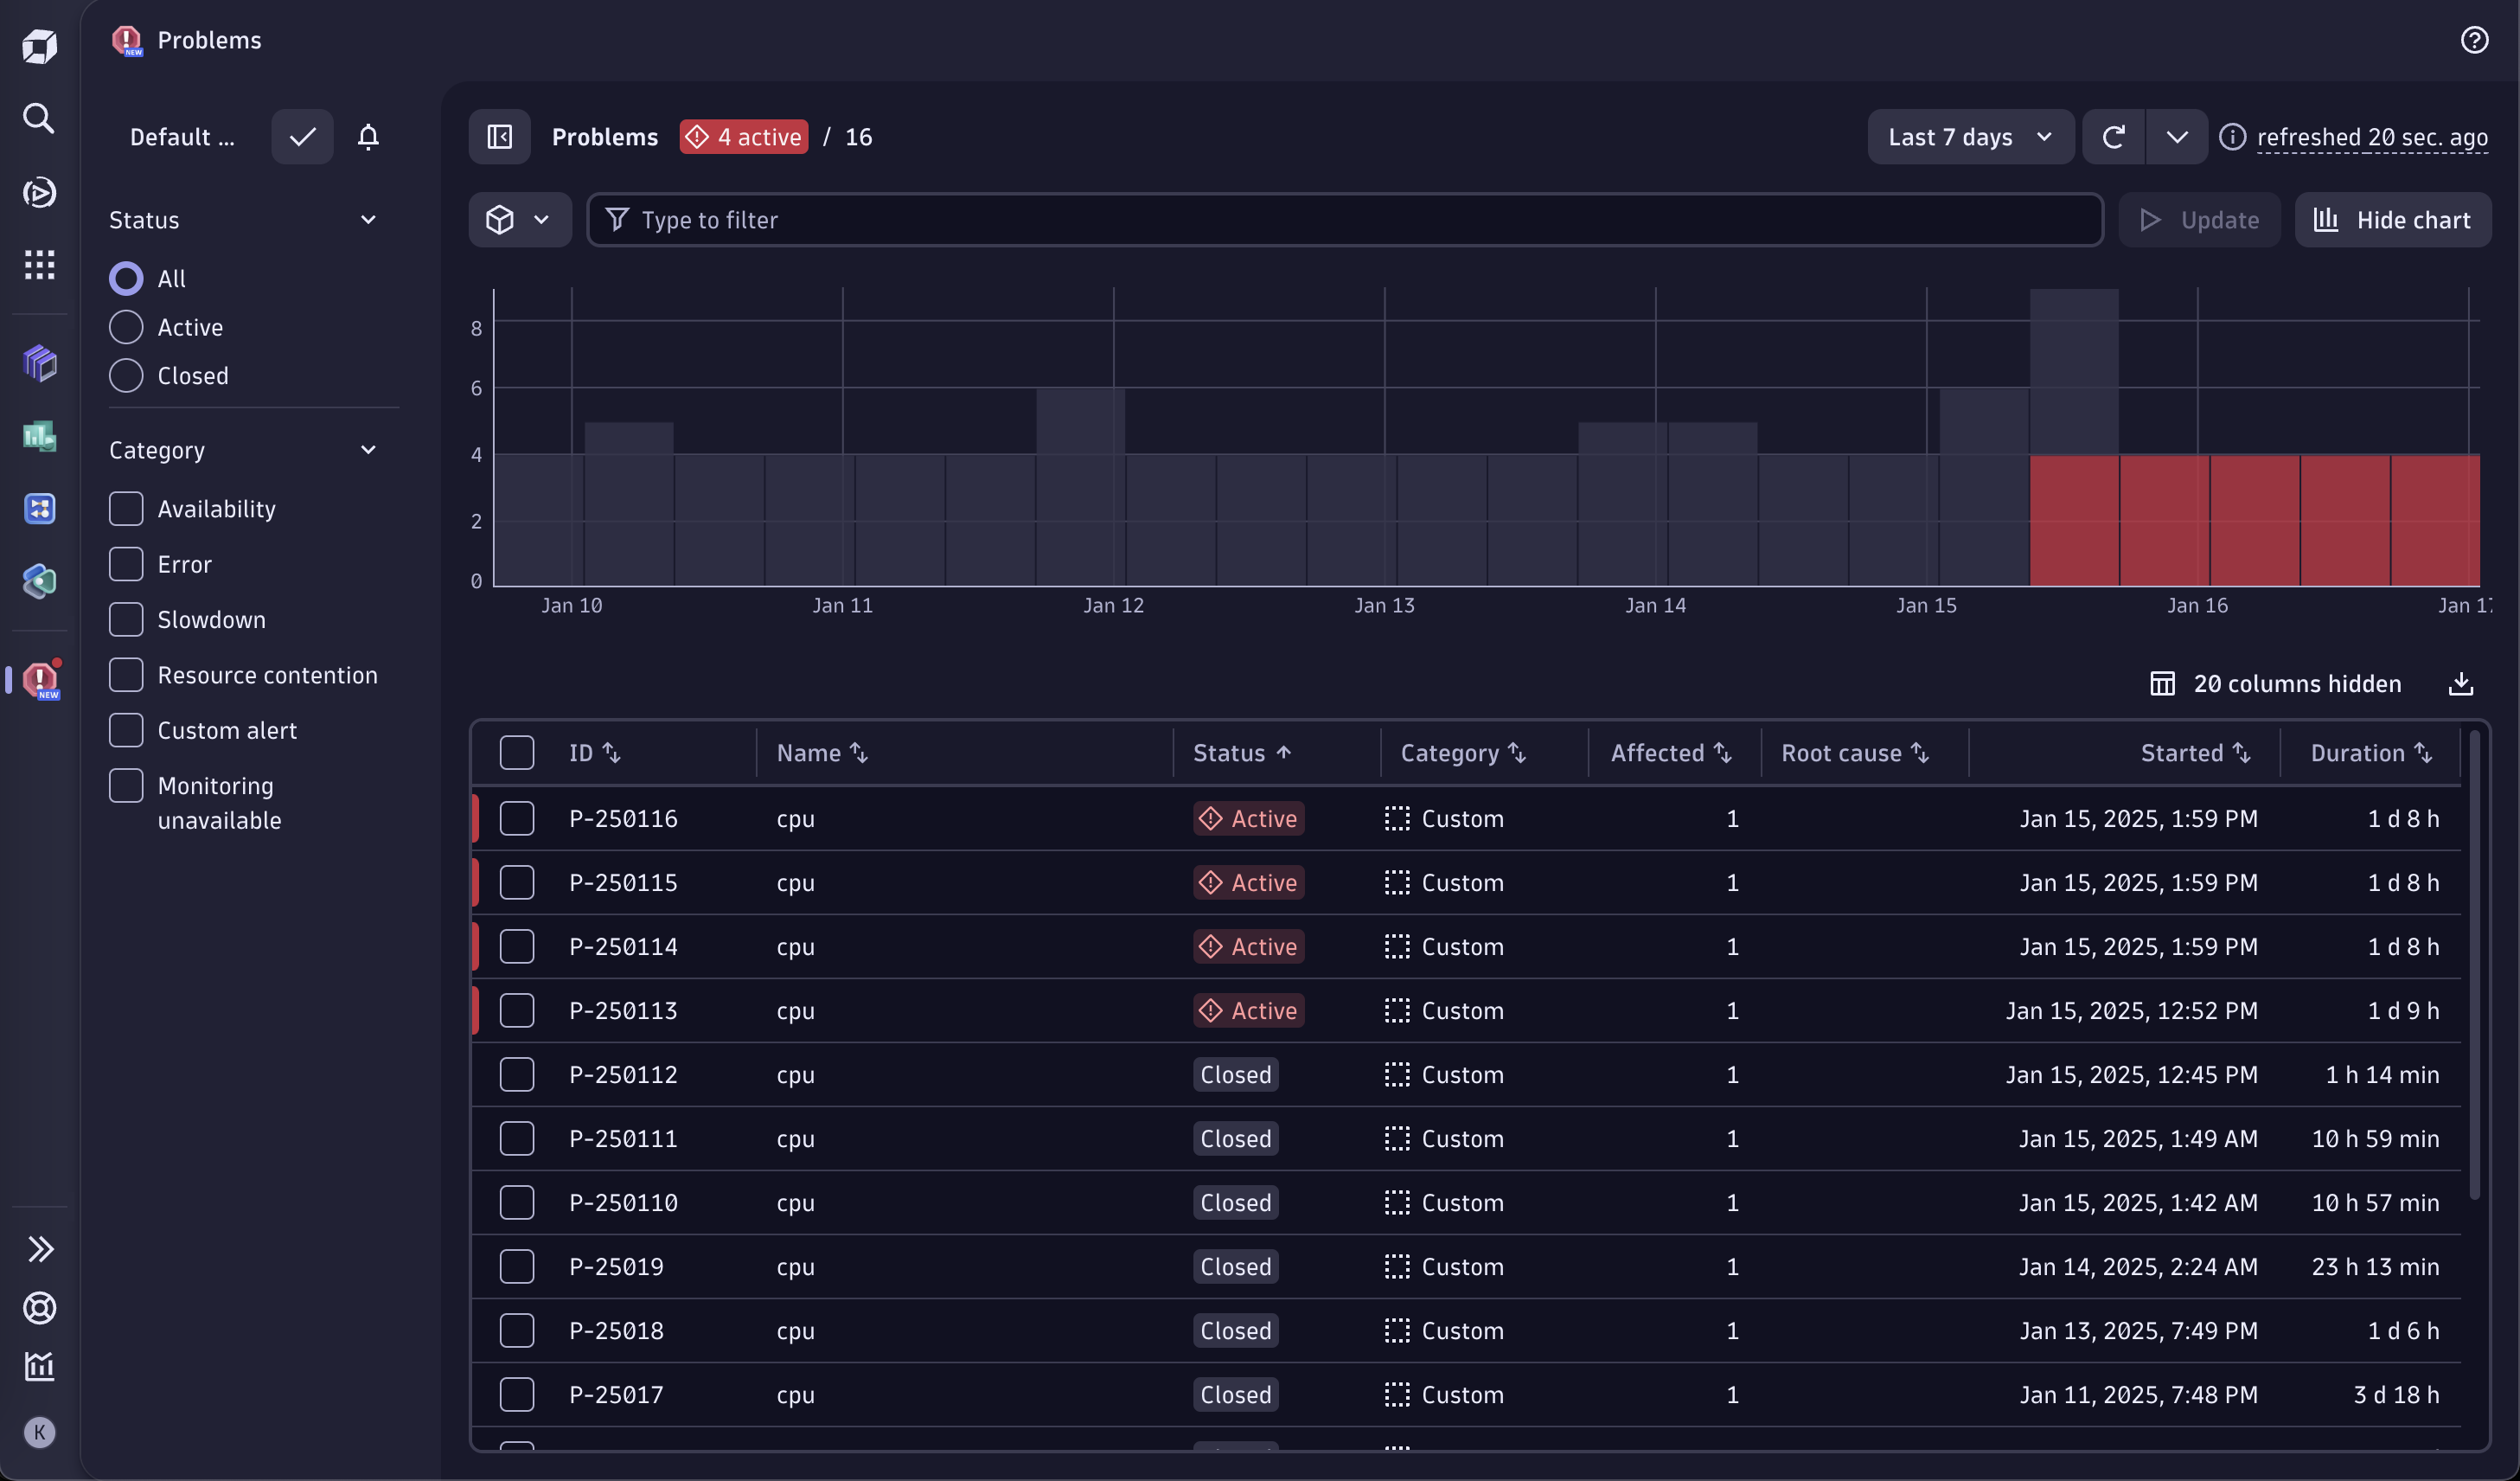
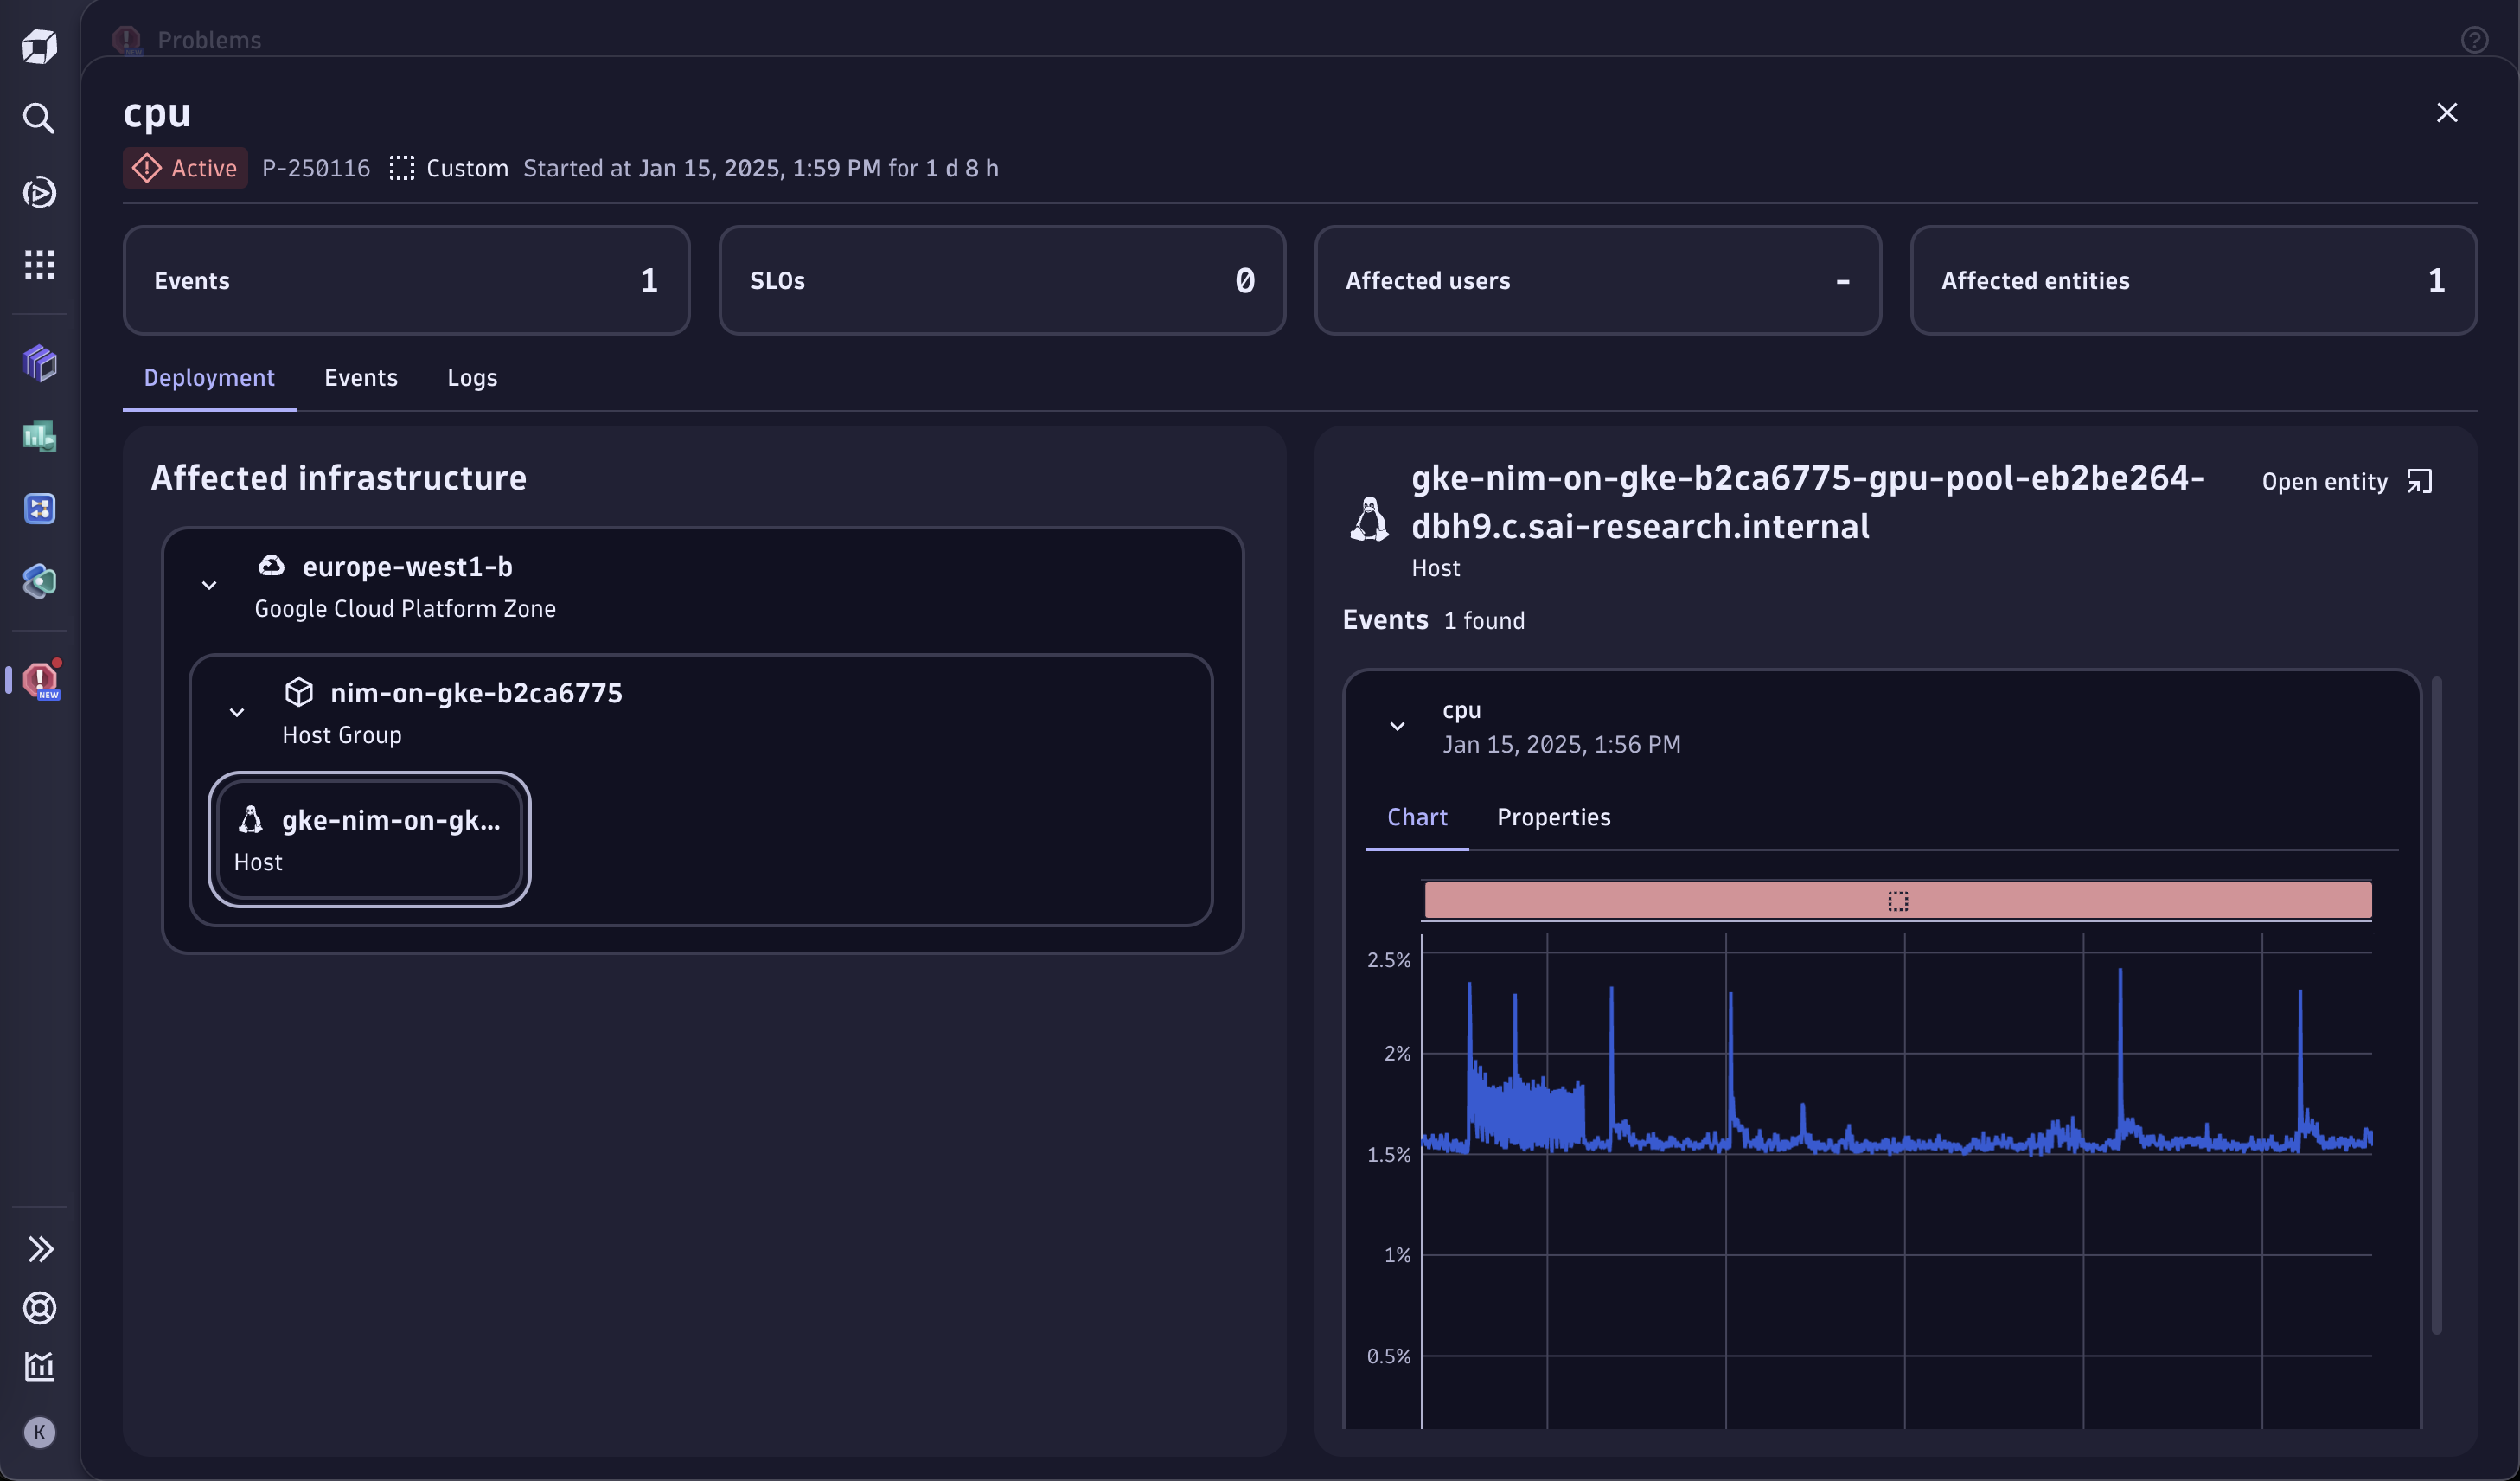
With all those latency, reliability, and cost measurements in place, your operations team can now define their own OpenAI dashboards and SLOs.Dynatrace Intelligence problem feed showing a slowdown caused by OpenAI generative service.Dynatrace Intelligence reported and analyzed a large scale service slowdown that was caused by the OpenAI generative service.
  • Product information

Overview

Businesses are adopting generative AI to drive innovation, leveraging client-side processing and semantic searches over domain-specific knowledge bases. Various tools use large language models (LLMs) like GPT-4 to create AI agents that perform complex queries and integrate with third-party services, where efficient cost tracking and management are key success factors for businesses.

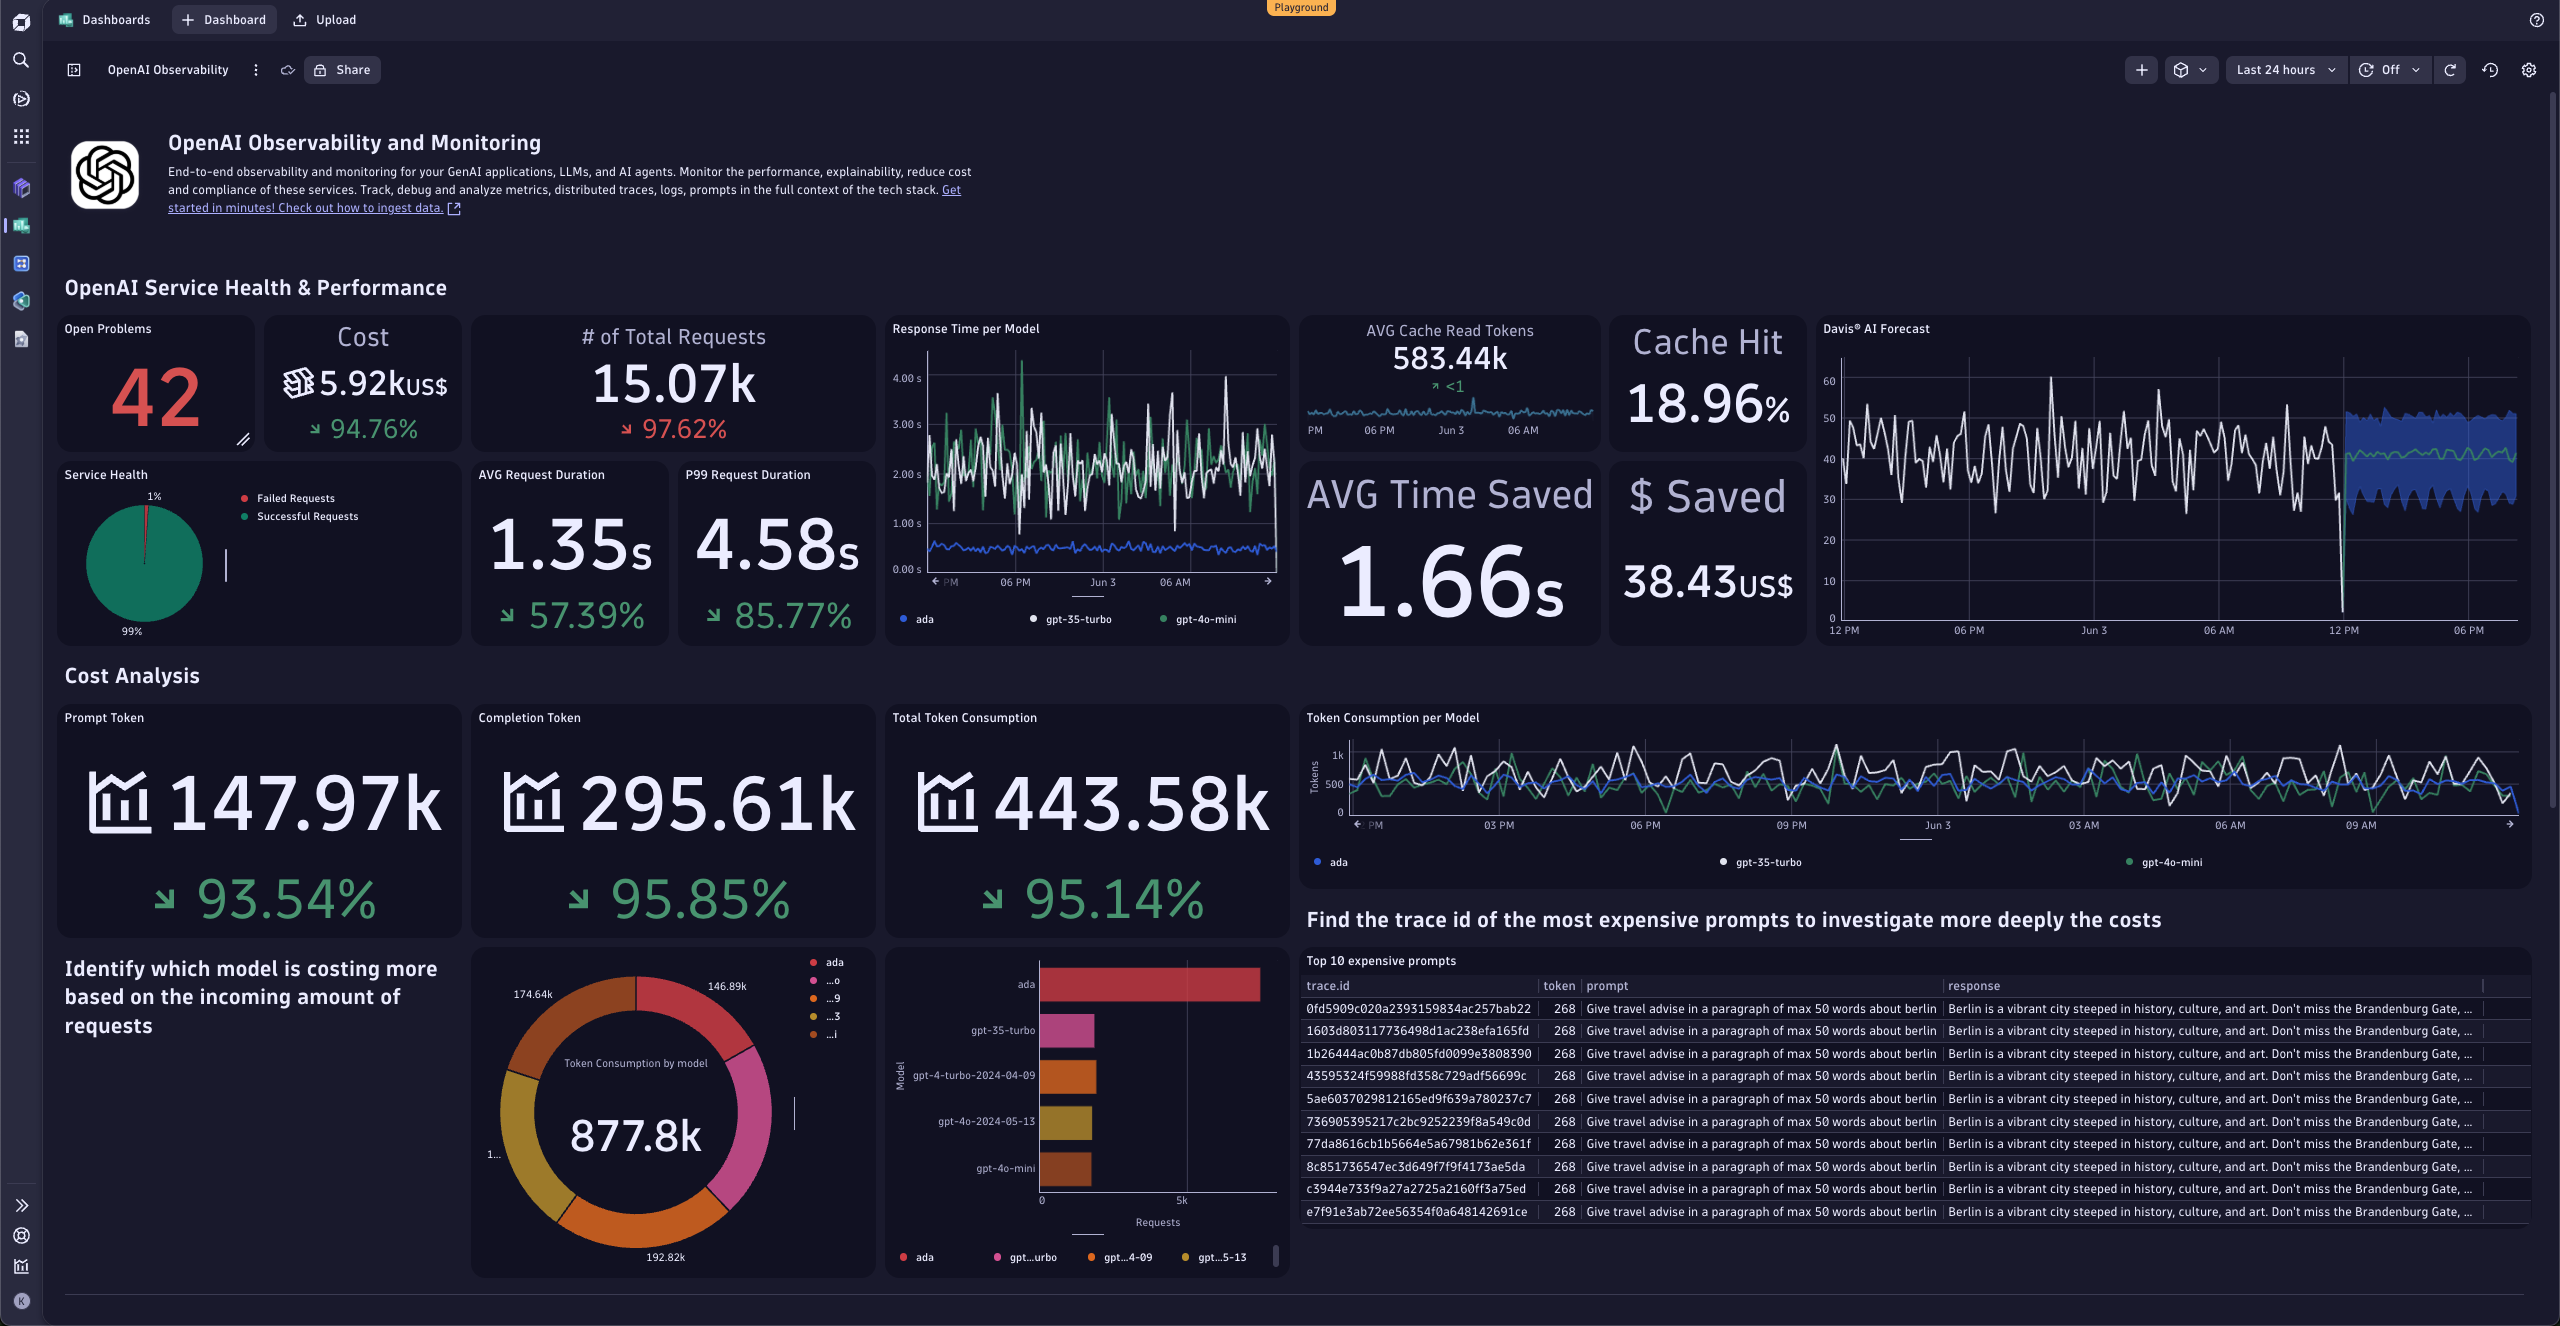
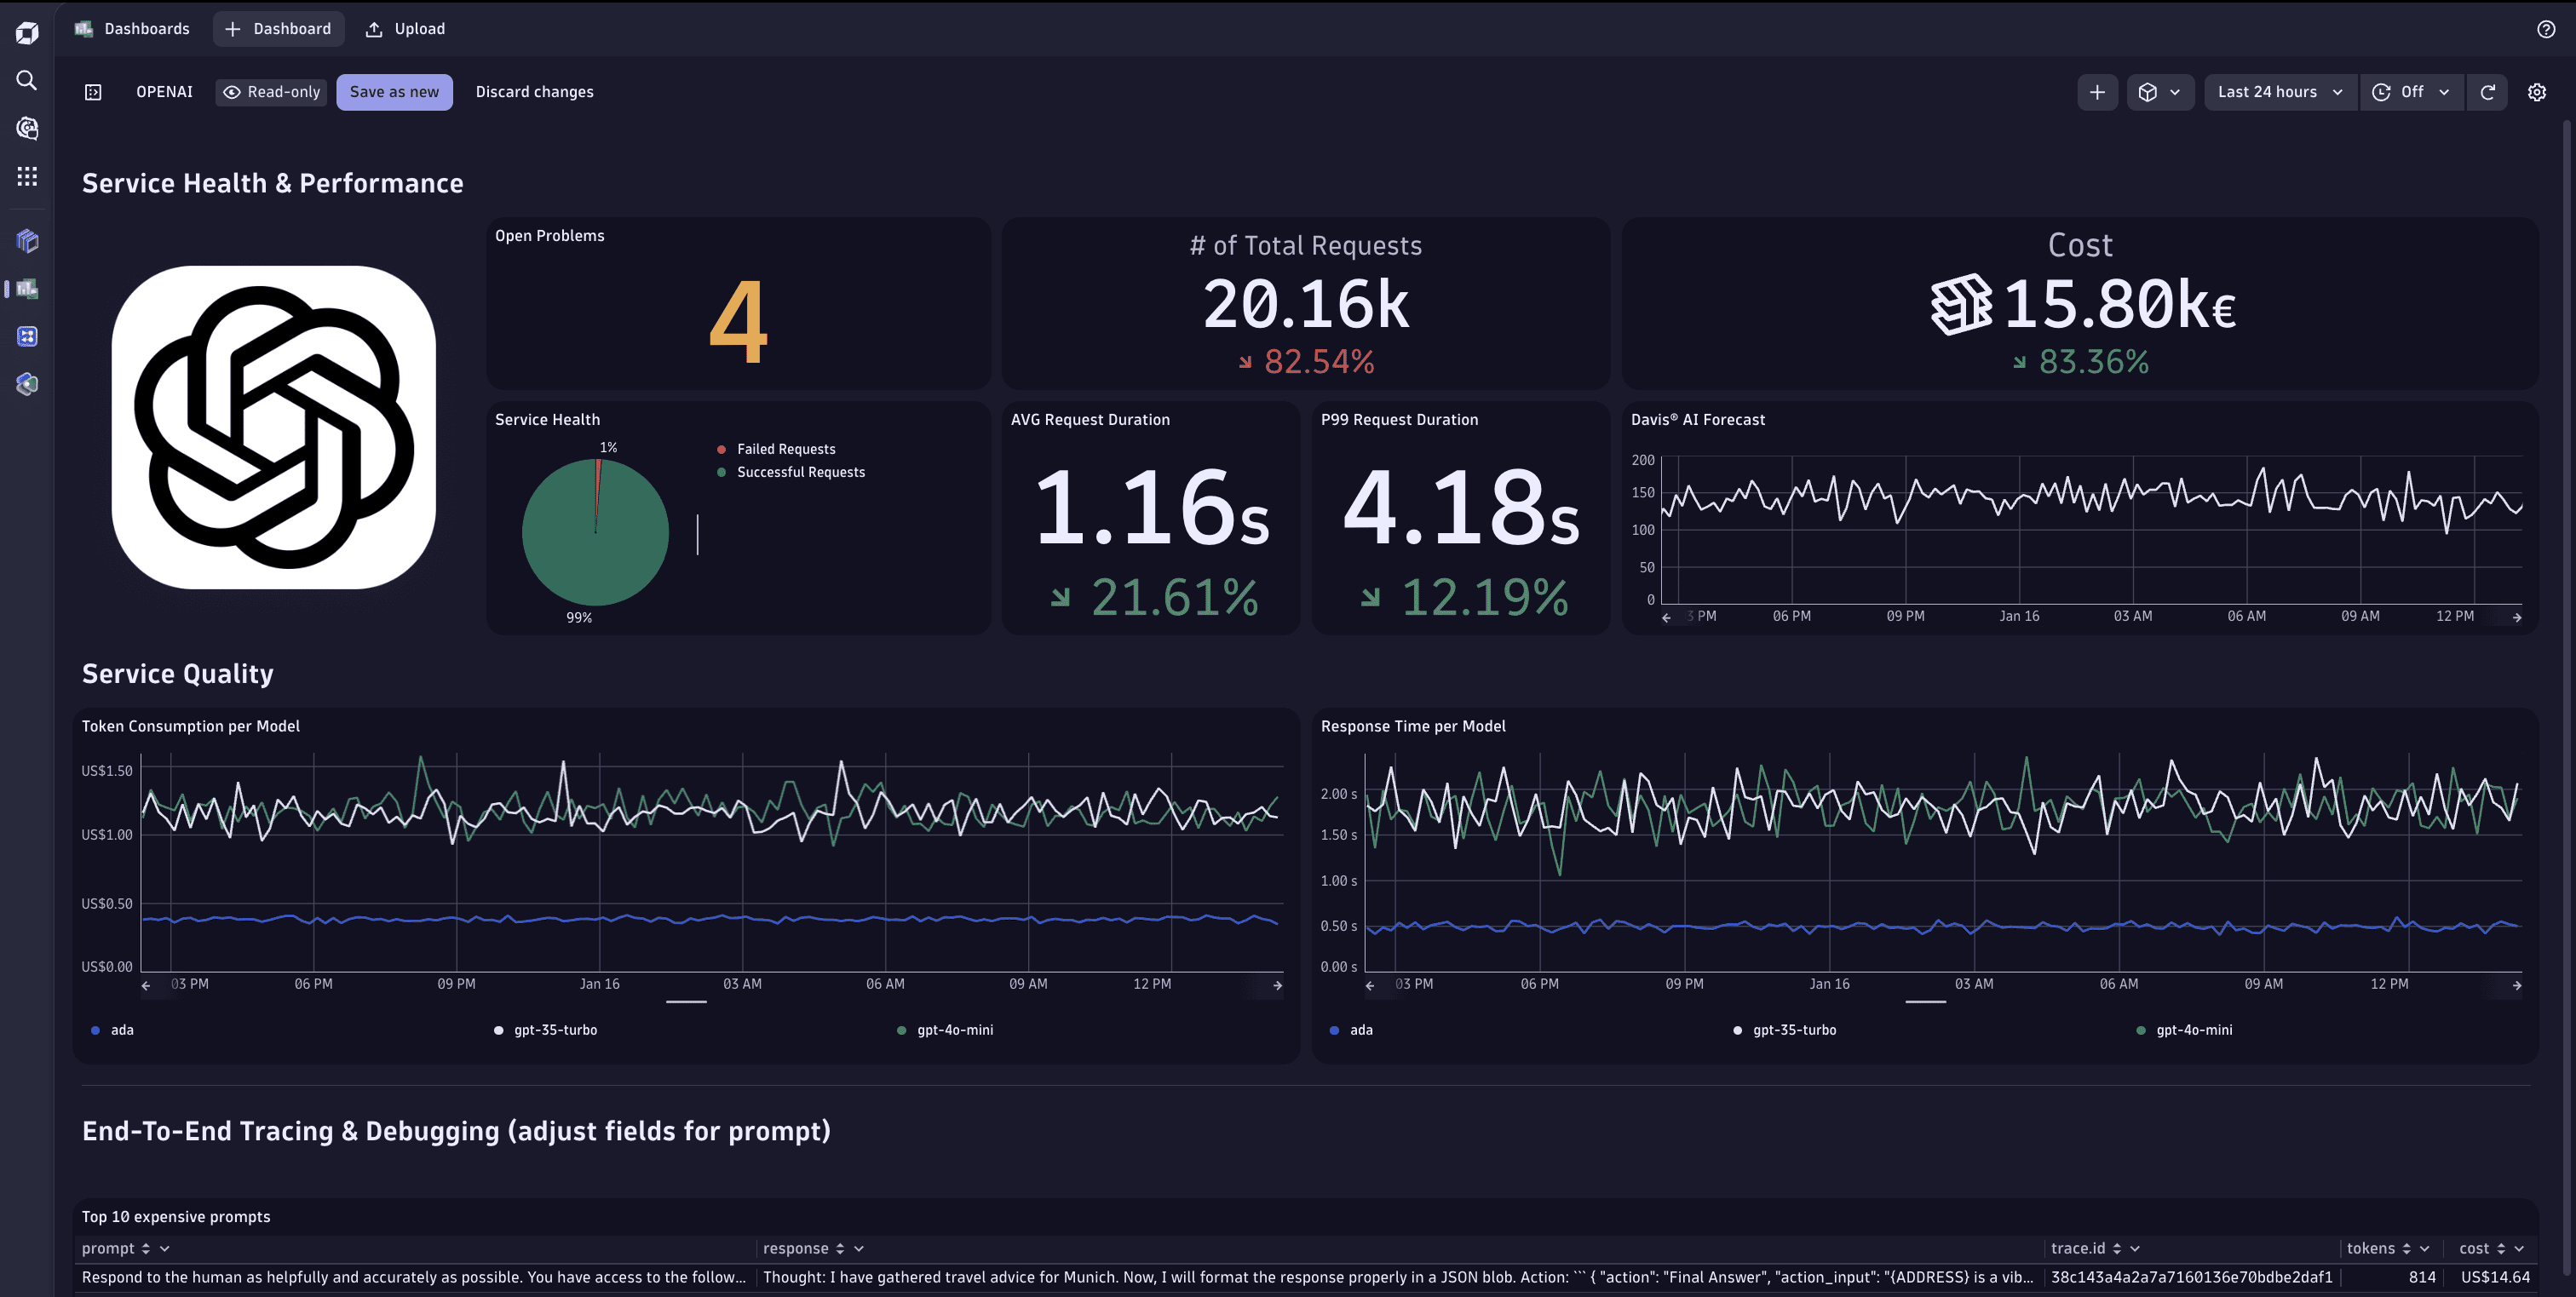
Dynatrace provides a solution for tracking and revealing the full context of used technologies and service interaction topology, analyzing security vulnerabilities, and observing metrics, traces, logs, and business events in real-time – all automatically and applicable to both OpenAI and Azure OpenAI services. A dashboard can show consumption, latency, availability, response time, error count, and request quantity for these AI services.


Use cases

  • proactive cost and capacity control: track token consumption and cost trends for OpenAI calls; forecast and alert on anomalies before budgets are impacted.
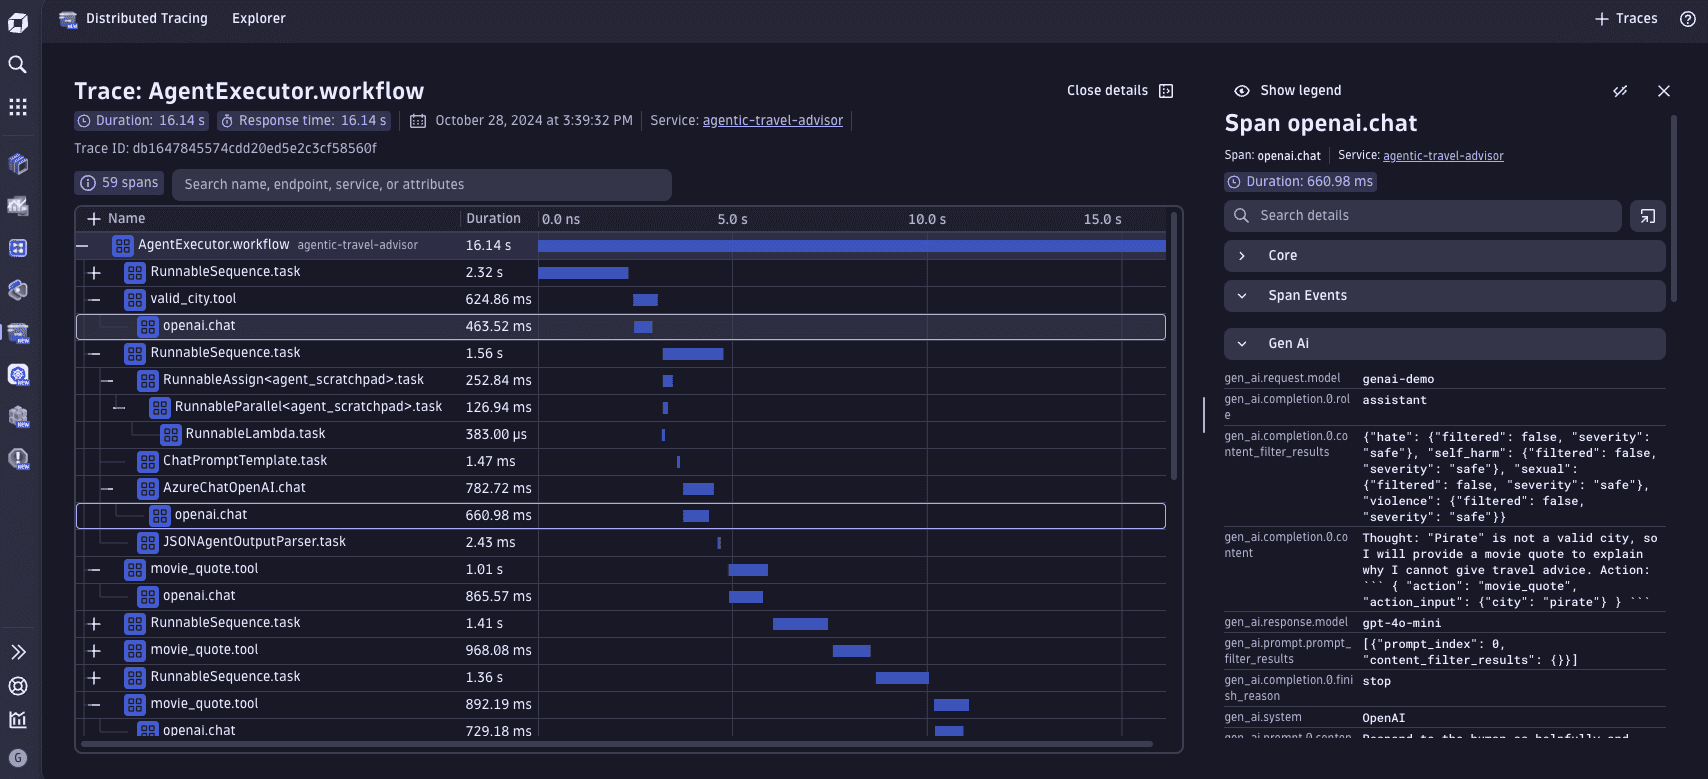
  • troubleshoot model and pipeline issues faster: trace prompts through orchestration and tool calls to pinpoint where latency, errors, or timeouts originate.
  • operationalize governance signals: monitor safety/guardrail outcomes reported by providers alongside service SLOs to spot risky patterns over time.

Get started

For more information about monitoring your OpenAI requests via Dynatrace, please see OpenAI observability in the Dynatrace documentation.

Details

  • cost, usage, and performance tracking for OpenAI API calls, including tokens, request/response latency, error rates, and throughput.
  • prompt‑level observability and tracing to follow interactions end‑to‑end across orchestration layers, tools, and dependencies.
  • anomaly detection and alerting on OpenAI usage patterns (for example sudden latency spikes or cost surges) with Davis® AI insights.

  • governance and guardrail visibility by centralizing provider‑reported outcomes (for example toxicity flags, denied topics) alongside operational metrics.

  • orrelated context across the full stack (services, pipelines, infra, GPUs/K8s) to speed up root‑cause analysis when OpenAI usage affects app behavior.
Dynatrace
DocumentationMore Information
By Dynatrace
Dynatrace support center
Copy to clipboard

More resources

Blog: Enhanced AI model observability with Dynatrace and Traceloop OpenLLMetry

Blog: Enhanced AI model observability with Dynatrace and Traceloop OpenLLMetry

Understand how combining the Dynatrace full stack observability platform and Traceloop's OpenLLMetry OpenTelemetry SDK can seamlessly provide comprehensive insights into Large Language Models (LLMs) in production environments.
Read more
Blog: Dynatrace automatically monitors OpenAI ChatGPT for companies that deliver reliable, cost-effective services powered by generative AI

Blog: Dynatrace automatically monitors OpenAI ChatGPT for companies that deliver reliable, cost-effective services powered by generative AI

Learn how Dynatrace automatically collects OpenAI/GPT model requests and charts them within Dynatrace, and how abnormal service behavior can be used to identify slowdowns in OpenAI/GPT requests as the root cause of large-scale issues.
Read more
Dynatrace Hub
Hub HomeGet data into DynatraceBuild your own app
Dynatrace Intelligence - Agentic Operations SystemThe Dynatrace Agentic AI ecosystem
All (914)Log Management and AnalyticsKubernetesAI and LLM ObservabilityInfrastructure ObservabilityApplication ObservabilityApplication SecurityBusiness ObservabilityDigital Experience
Filter
Type
Built and maintained by
Deployment model
SaaS
  • SaaS
  • Managed
Partner FinderBecome a partnerDynatrace Developer

Software Delivery

Empower DevOps platform engineers, SREs, and development teams to deliver higher quality software, faster, and more securely.

Popular integrations

See more (1)
GitHub logo

GitHub

Automate GitHub issues, pull requests, and workflows from Dynatrace.

Jira logo

Jira

Open, update, and close Jira tickets automatically from Dynatrace Workflows.

Jenkins logo

Jenkins

Trigger Jenkins builds and monitor job status from Dynatrace Workflows.

GitLab logo

GitLab

Amend files in GitLab repositories, trigger pipelines, and manage issues.

Slack logo

Slack

Automate Slack messaging for security incidents, attacks, remediation, and more.

ServiceNow logo

ServiceNow

Create and manage ServiceNow incidents from Dynatrace Workflows.

More options

Workflows logo

Workflows

Automate tasks in your IT landscape and move towards autonomous operations.

Keptn logo

Keptn

Event-based control plane for continuous delivery and automated operations.

Configuration as Code logo

Configuration as Code

Manage observability and security configurations as code via Terraform or Monaco.

Site Reliability Guardian logo

Site Reliability Guardian

SRG: Automated change impact analysis for your deployment and release processes.

Service-Level Objectives logo

Service-Level Objectives

Manage SLOs and error budgets to ensure service performance and reliability SLAs.

More resources

AWS Connector logo

AWS Connector

Automate your AWS infrastructure with actions across EC2, S3, Lambda, and more.

Claude Connector for Workflows logo

Claude Connector for Workflows

Connect with Claude and send prompts for further analysis using Workflows.

CI/CD Observability logo

CI/CD Observability

Monitor CI/CD pipelines such as Azure Devops, Gitlab, Github and more.

Observability for Developers on Cursor logo

Observability for Developers on Cursor

Get Real time Code-Level data directly to your Cursor IDE.

Email logo

Email

Send out-of-the-box targeted Emails with workflows.

Gemini Connector for Workflows logo

Gemini Connector for Workflows

Connect with Gemini and send prompts for further analysis using Workflows.

GitHub Copilot Coding Agent logo

GitHub Copilot Coding Agent

Automate vulnerability remediation and boost developer productivity.

GitHub Copilot Custom Agent logo

GitHub Copilot Custom Agent

Automate your development workflows with specialized agent definitions.

Observability for Developer on JetBrains logo

Observability for Developer on JetBrains

Get real-time code-level data directly to your Jetbrains IDE.

Kubernetes Connector logo

Kubernetes Connector

Automate your Kubernetes clusters: Delete failed pods and restart deployments.

Microsoft 365 logo

Microsoft 365

Send targeted emails from workflows using your Microsoft 365 account.

OpenAI Connector for Workflows logo

OpenAI Connector for Workflows

Connect with OpenAI and send prompts for further analysis using Workflows.

Ownership logo

Ownership

Enables the import of and access to ownership information of entities.

Pagerduty for Dynatrace Workflows logo

Pagerduty for Dynatrace Workflows

Streamline incident management with automated Pageruty workflows.

Red Hat Ansible logo

Red Hat Ansible

Integrate with Red Hat Ansible (EDA, AAC, AWX) to trigger job templates.

Snowflake for Workflows logo

Snowflake for Workflows

Access, query, and store Snowflake data to analyze further within Dynatrace.

Observability for Developers on VSCode logo

Observability for Developers on VSCode

Get Real time Code-Level data directly to your VSCode IDE.

Cursor IDE logo

Cursor IDE

Boost developer productivity and get real-time, code-level insights into Cursor.

Observability for Developers on Windsurf logo

Observability for Developers on Windsurf

Get real-time code-level data directly to your Windsurf IDE.

Are you looking for something different?

We have hundreds of apps, extensions, and other technologies to customize your environment

Extend your knowledge

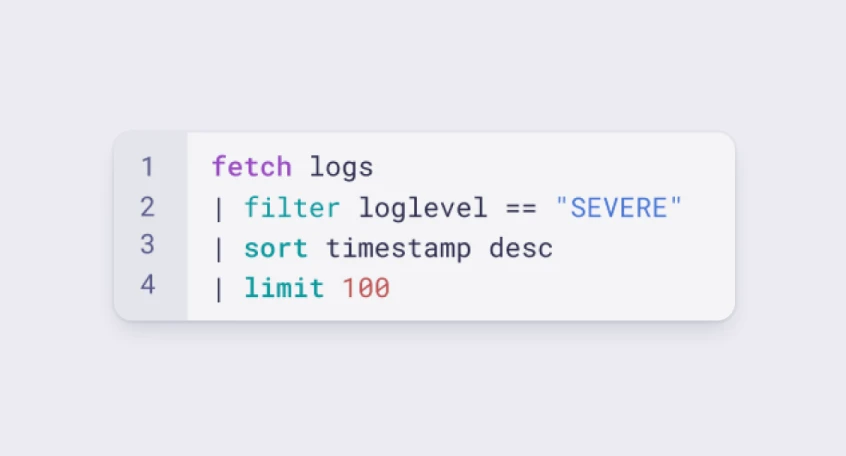
Learn the Dynatrace Query Language

Learn the Dynatrace Query Language

Explore data, discover patterns, anomalies and outliers, and create statistical modeling with DQL, our powerful query language.
Learn DQL
Solve problems with custom apps

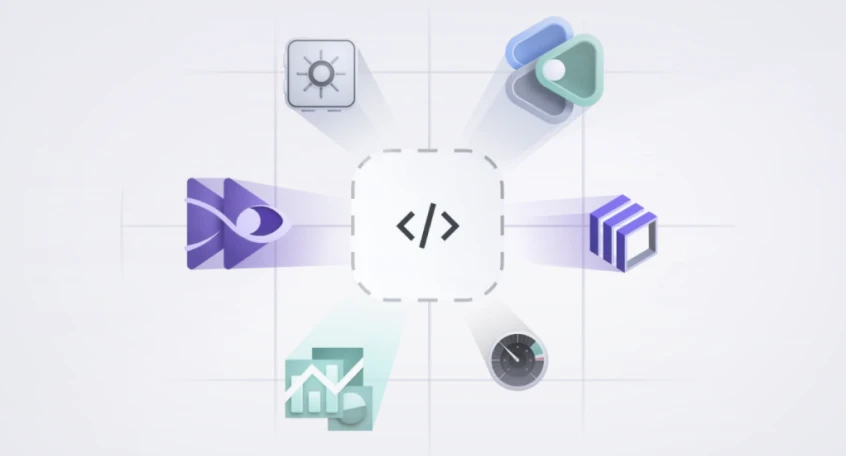
Solve problems with custom apps

Dynatrace Developer makes it easy to create custom apps for your organisation. Start with one of our templates or use your own code.
Build apps