















Skip to technology filters Skip to main content
Dynatrace Hub

Extend the platform,
empower your team.

Popular searches:
Home hero bg
OpenInferenceOpenInference
OpenInference

OpenInference

Instrument your AI agents, services and apps with OpenInference.

Technology
Free trialDocumentation
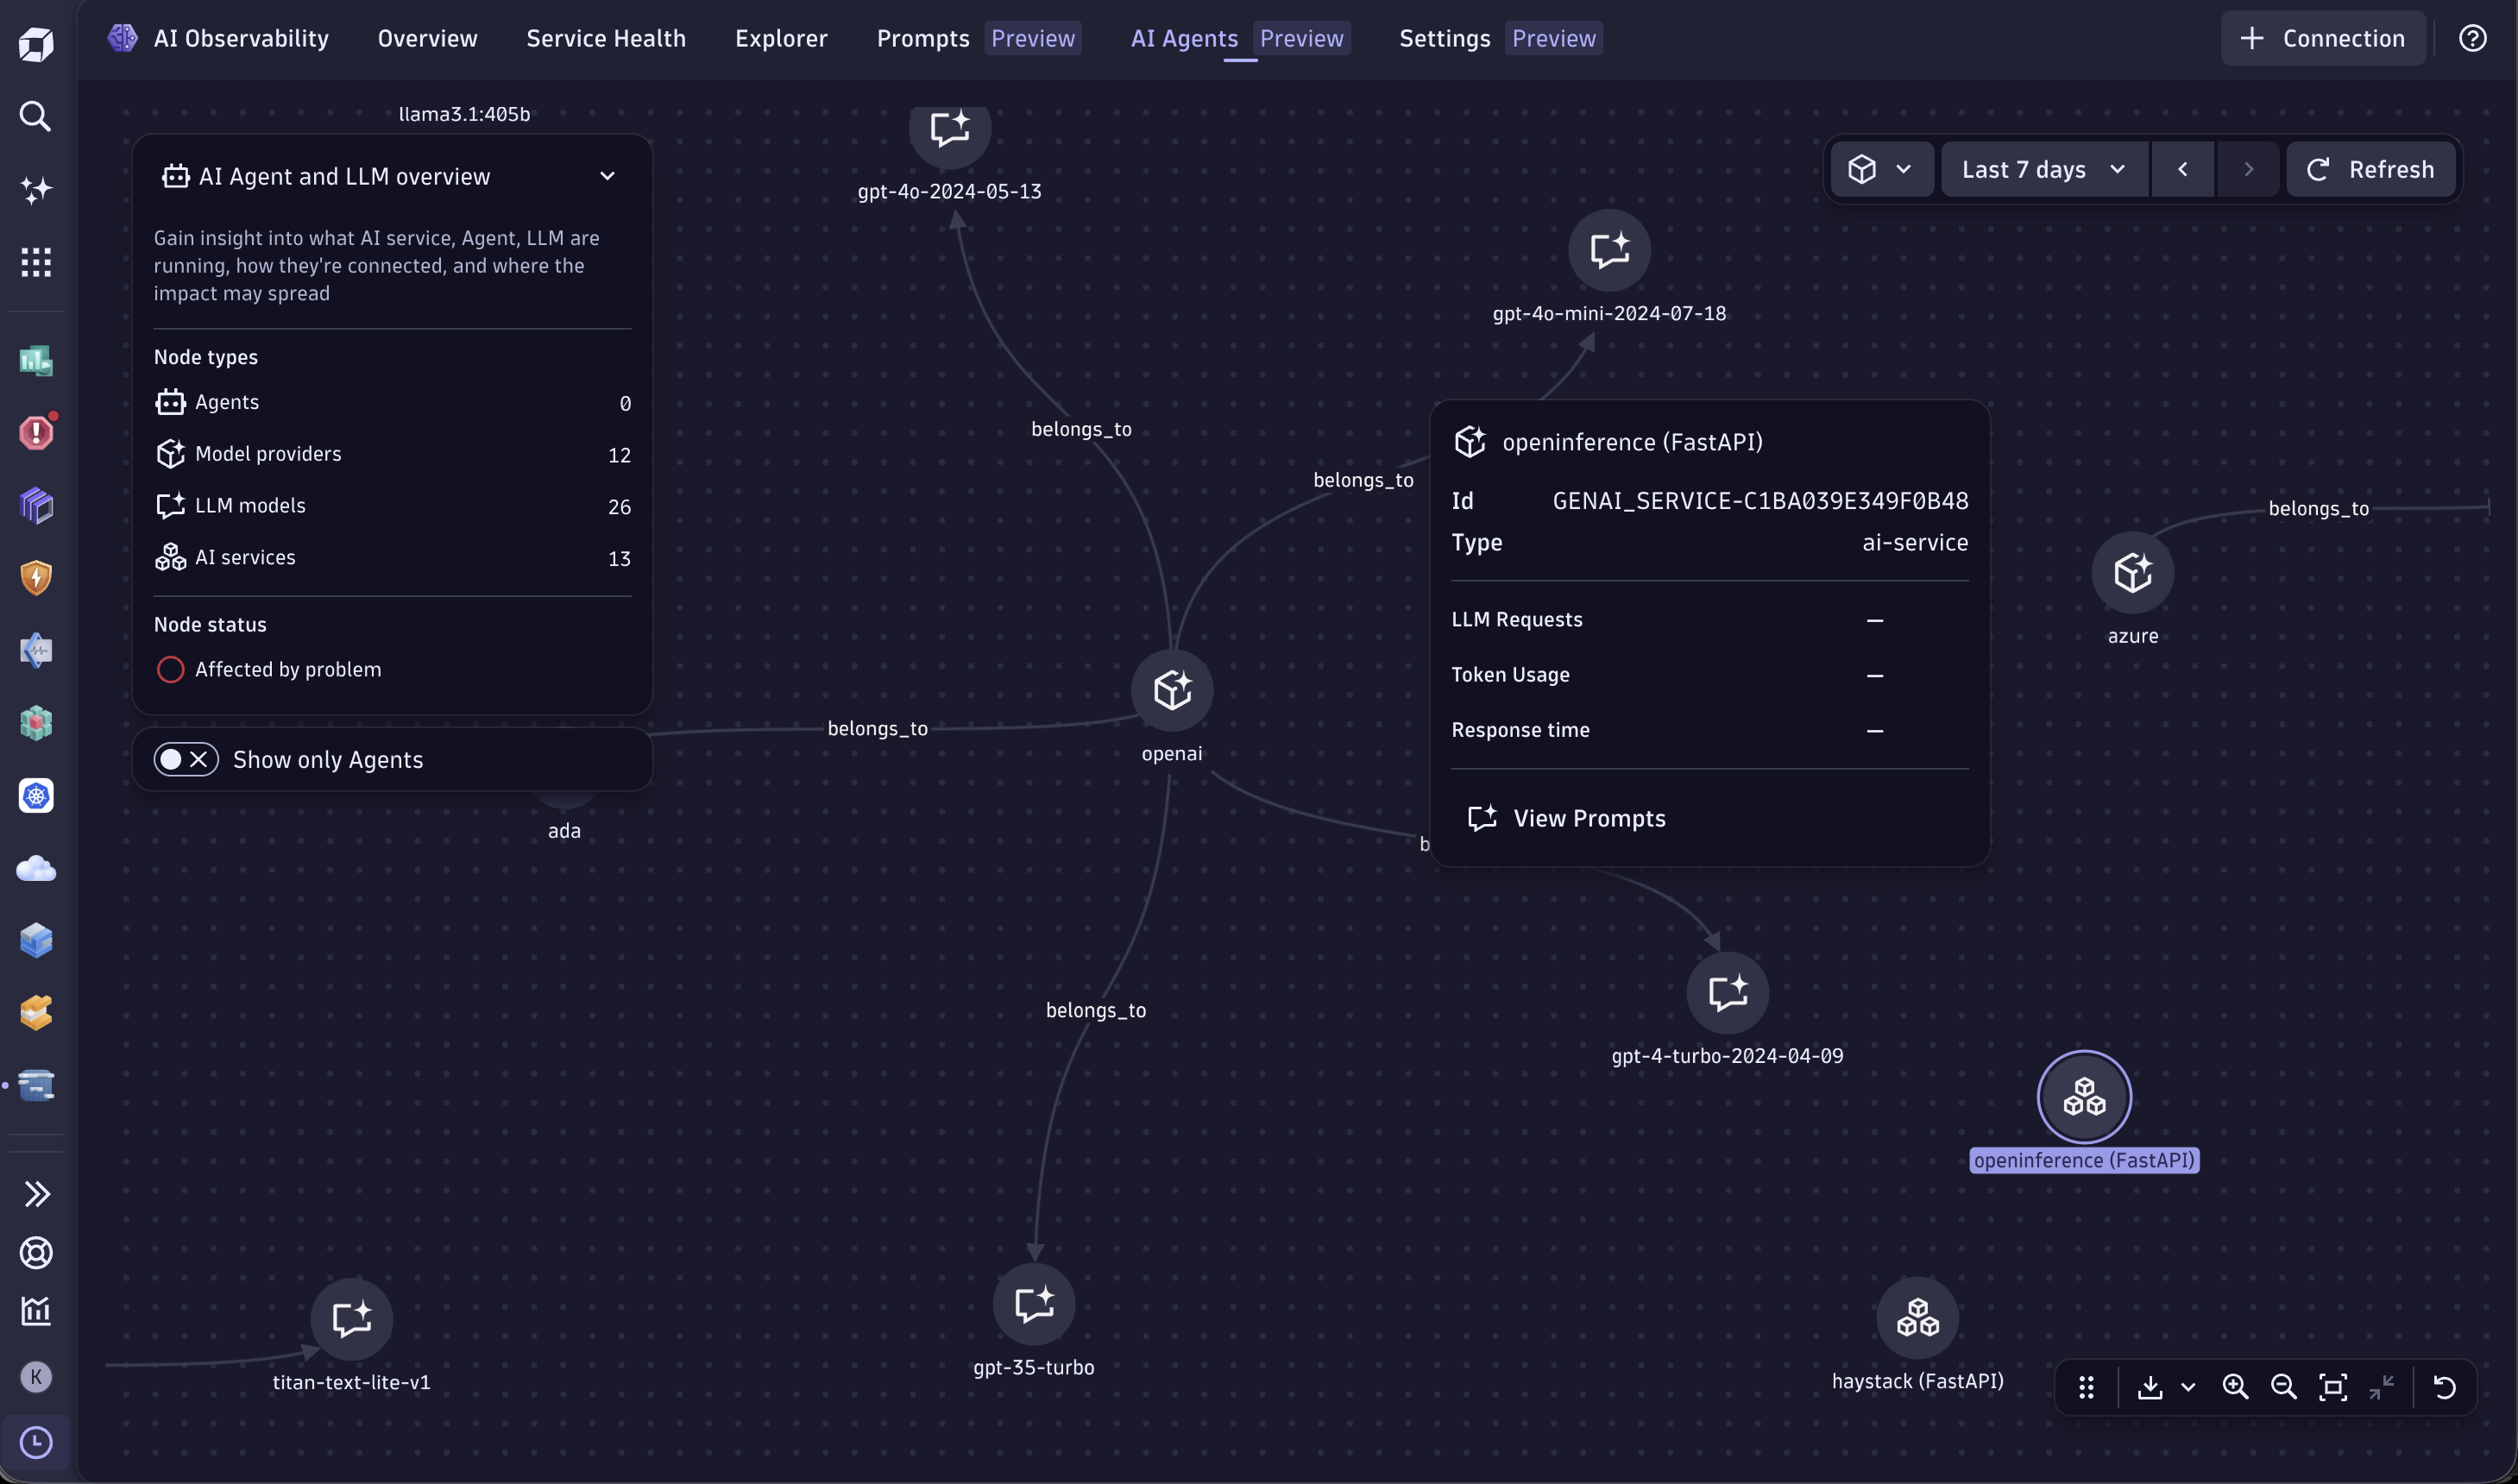
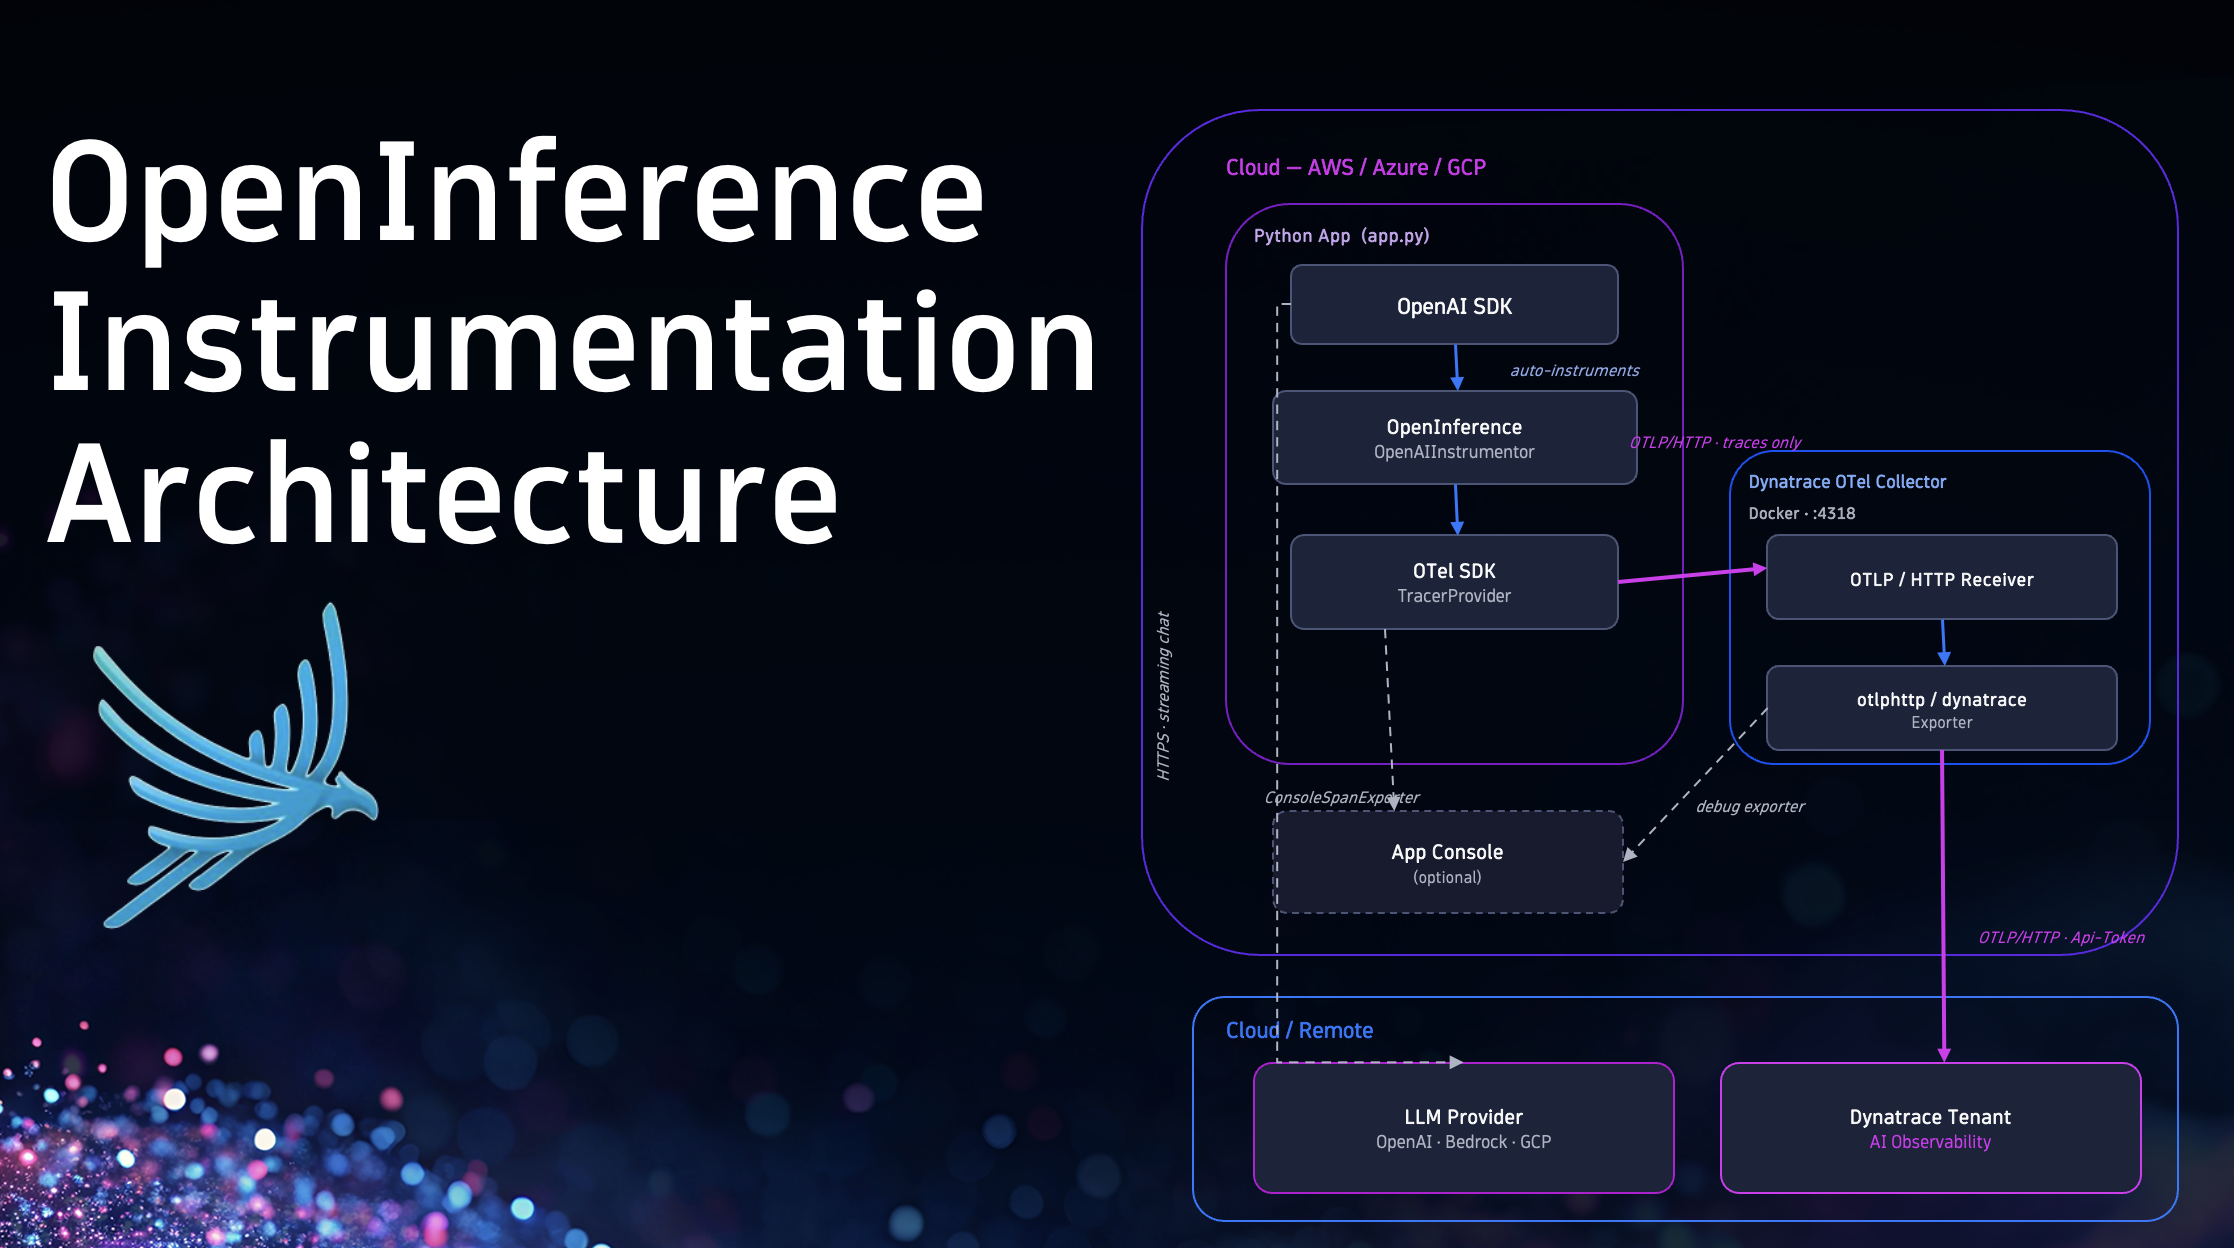
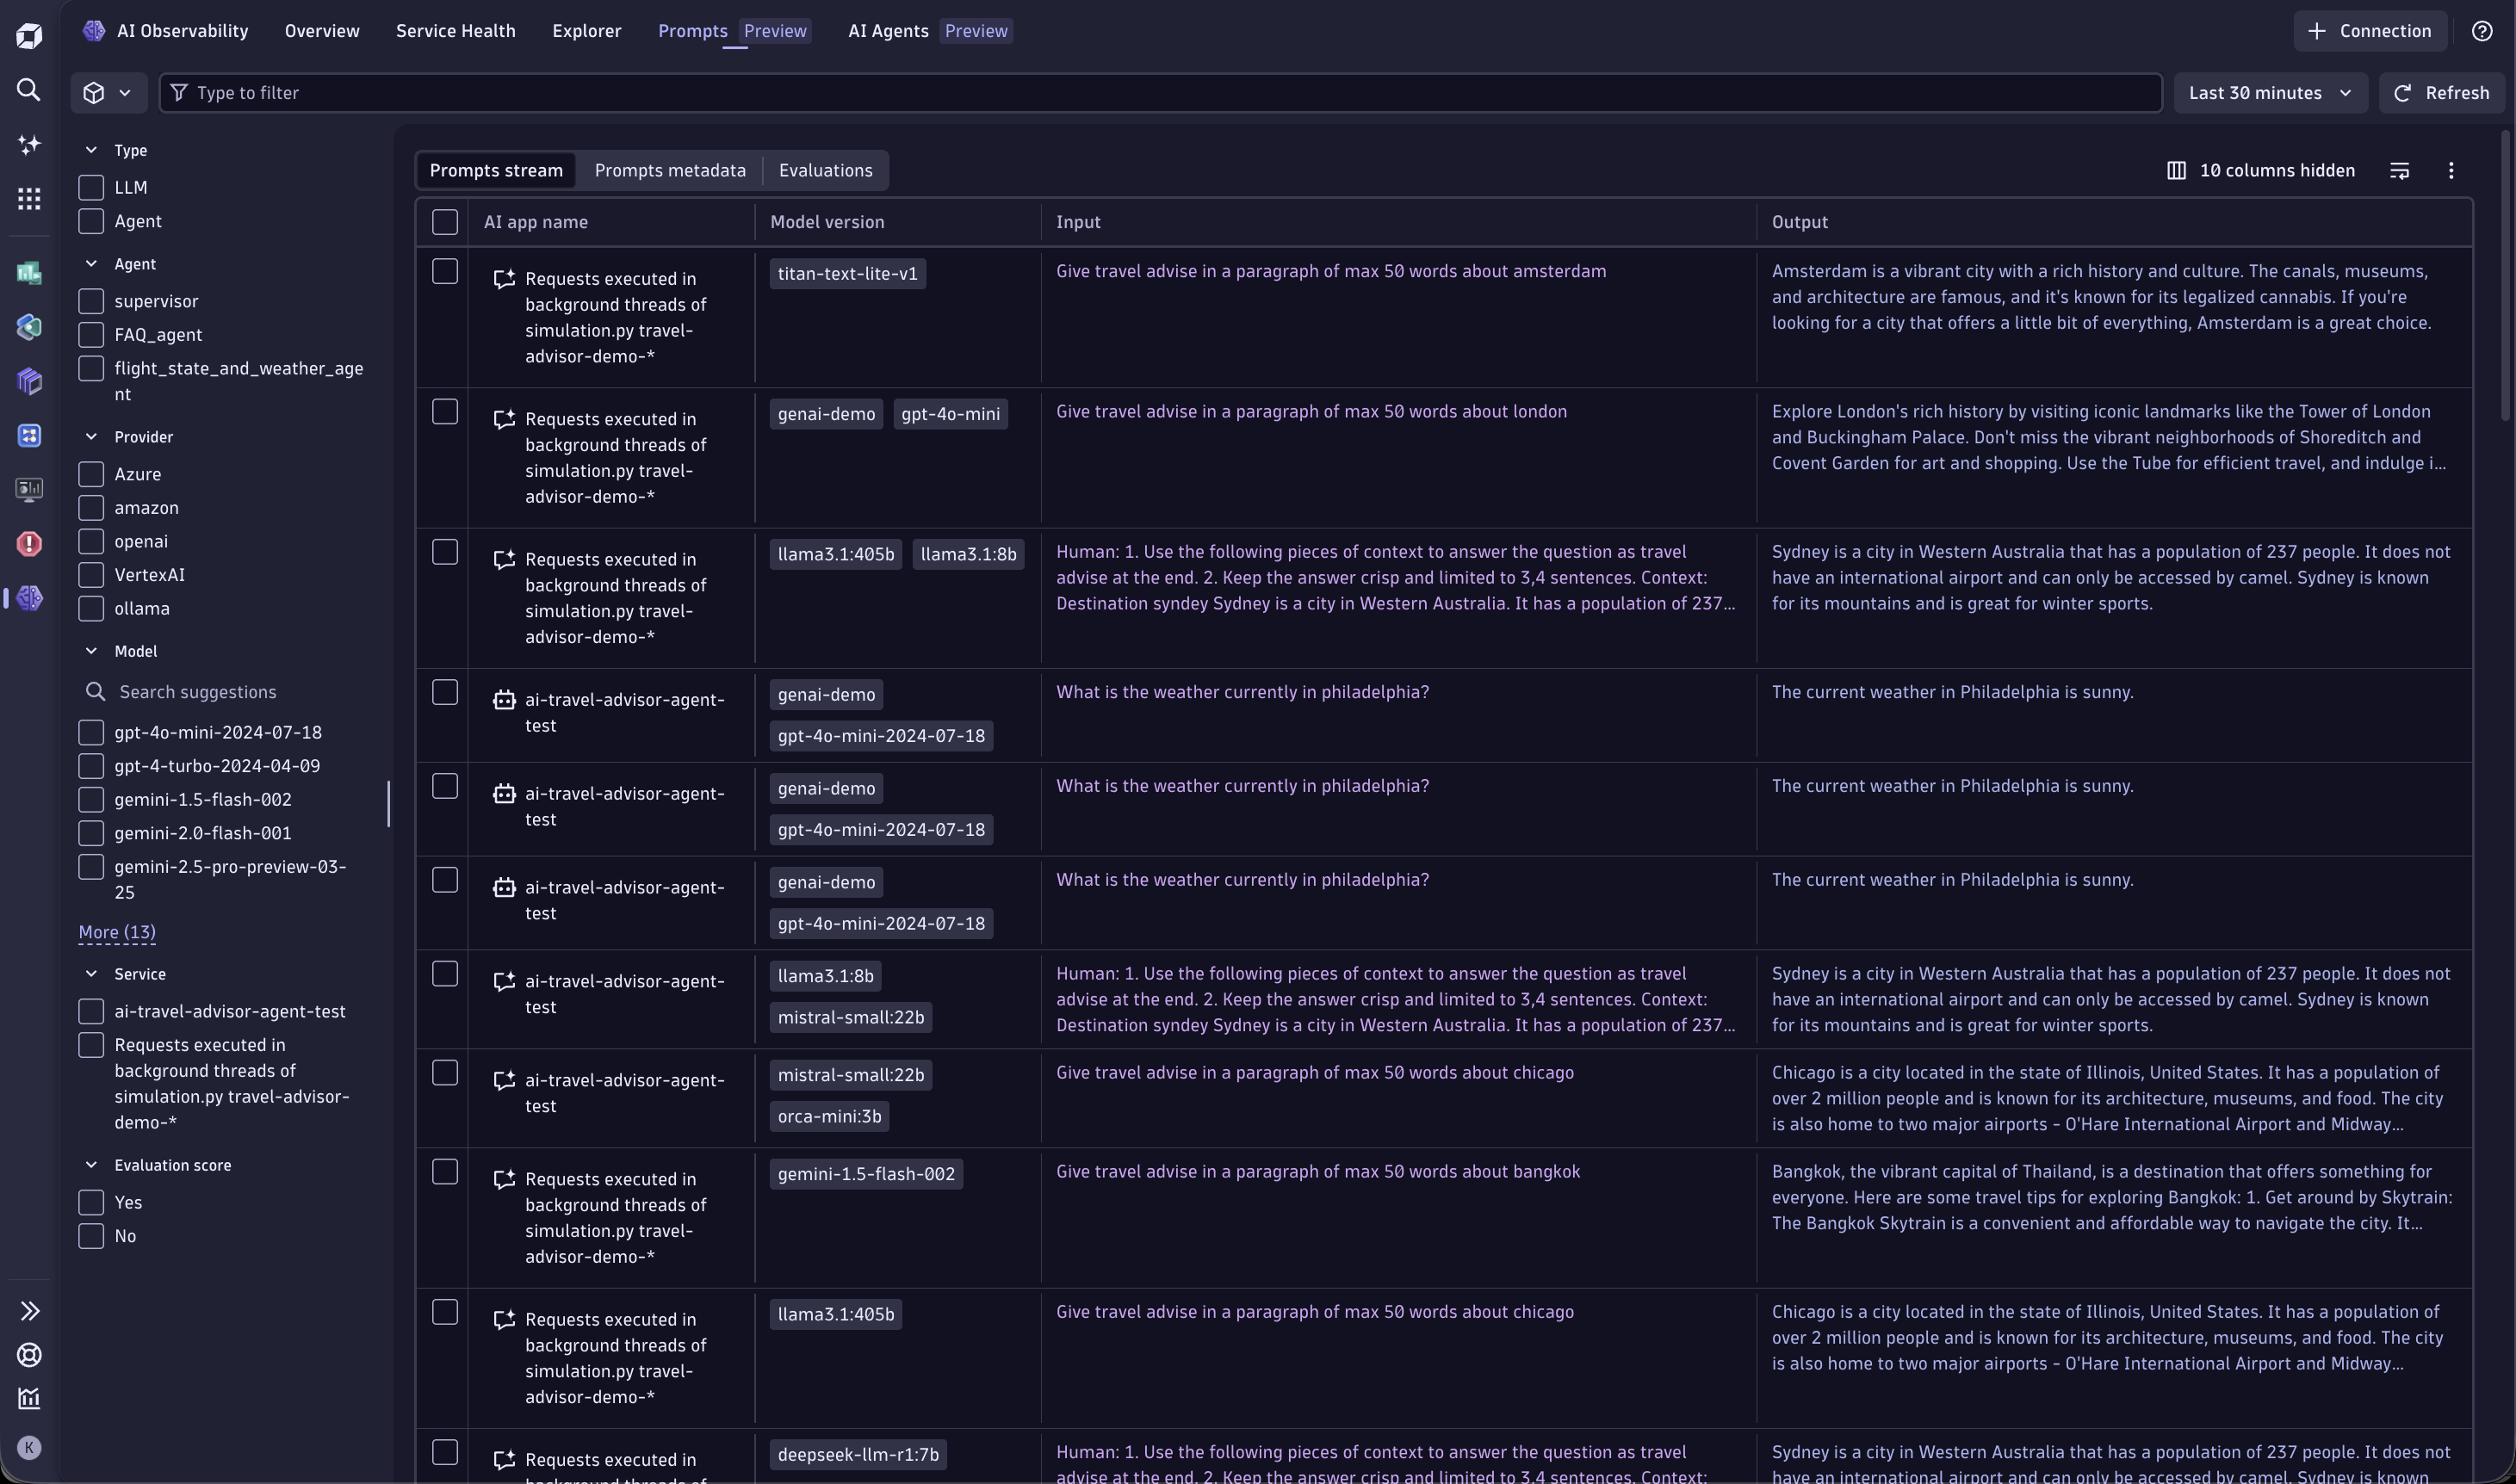
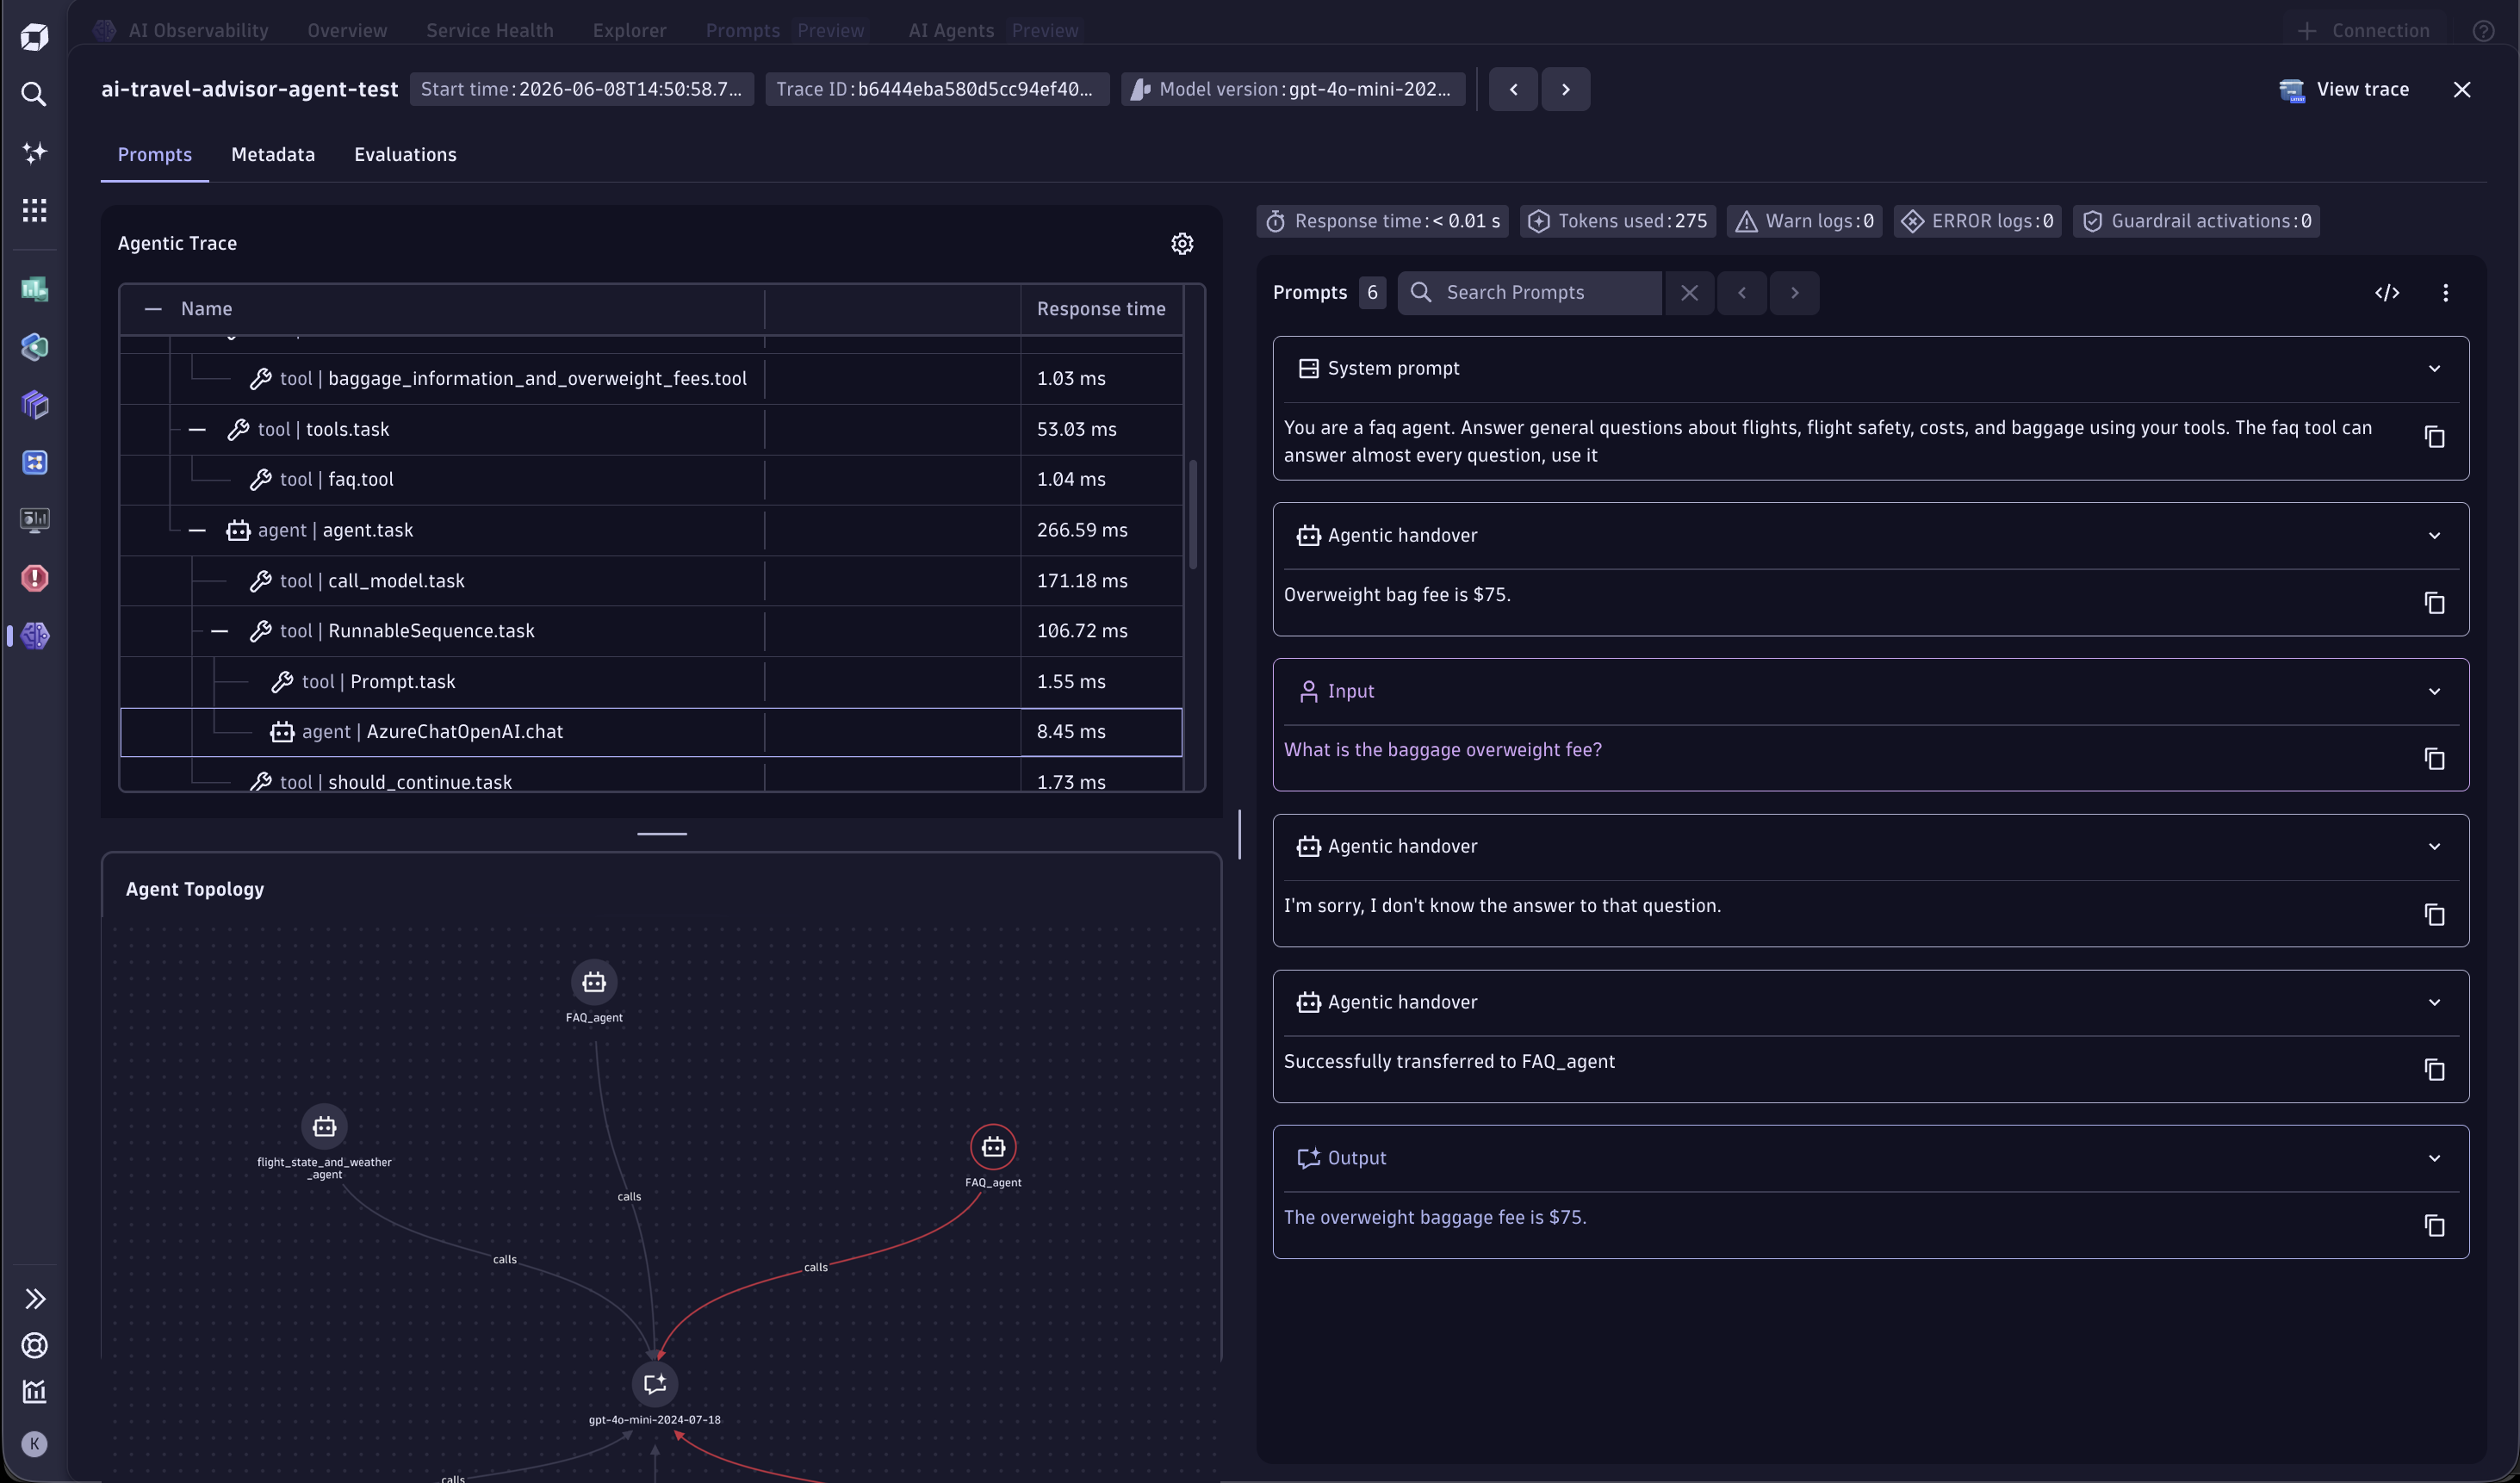
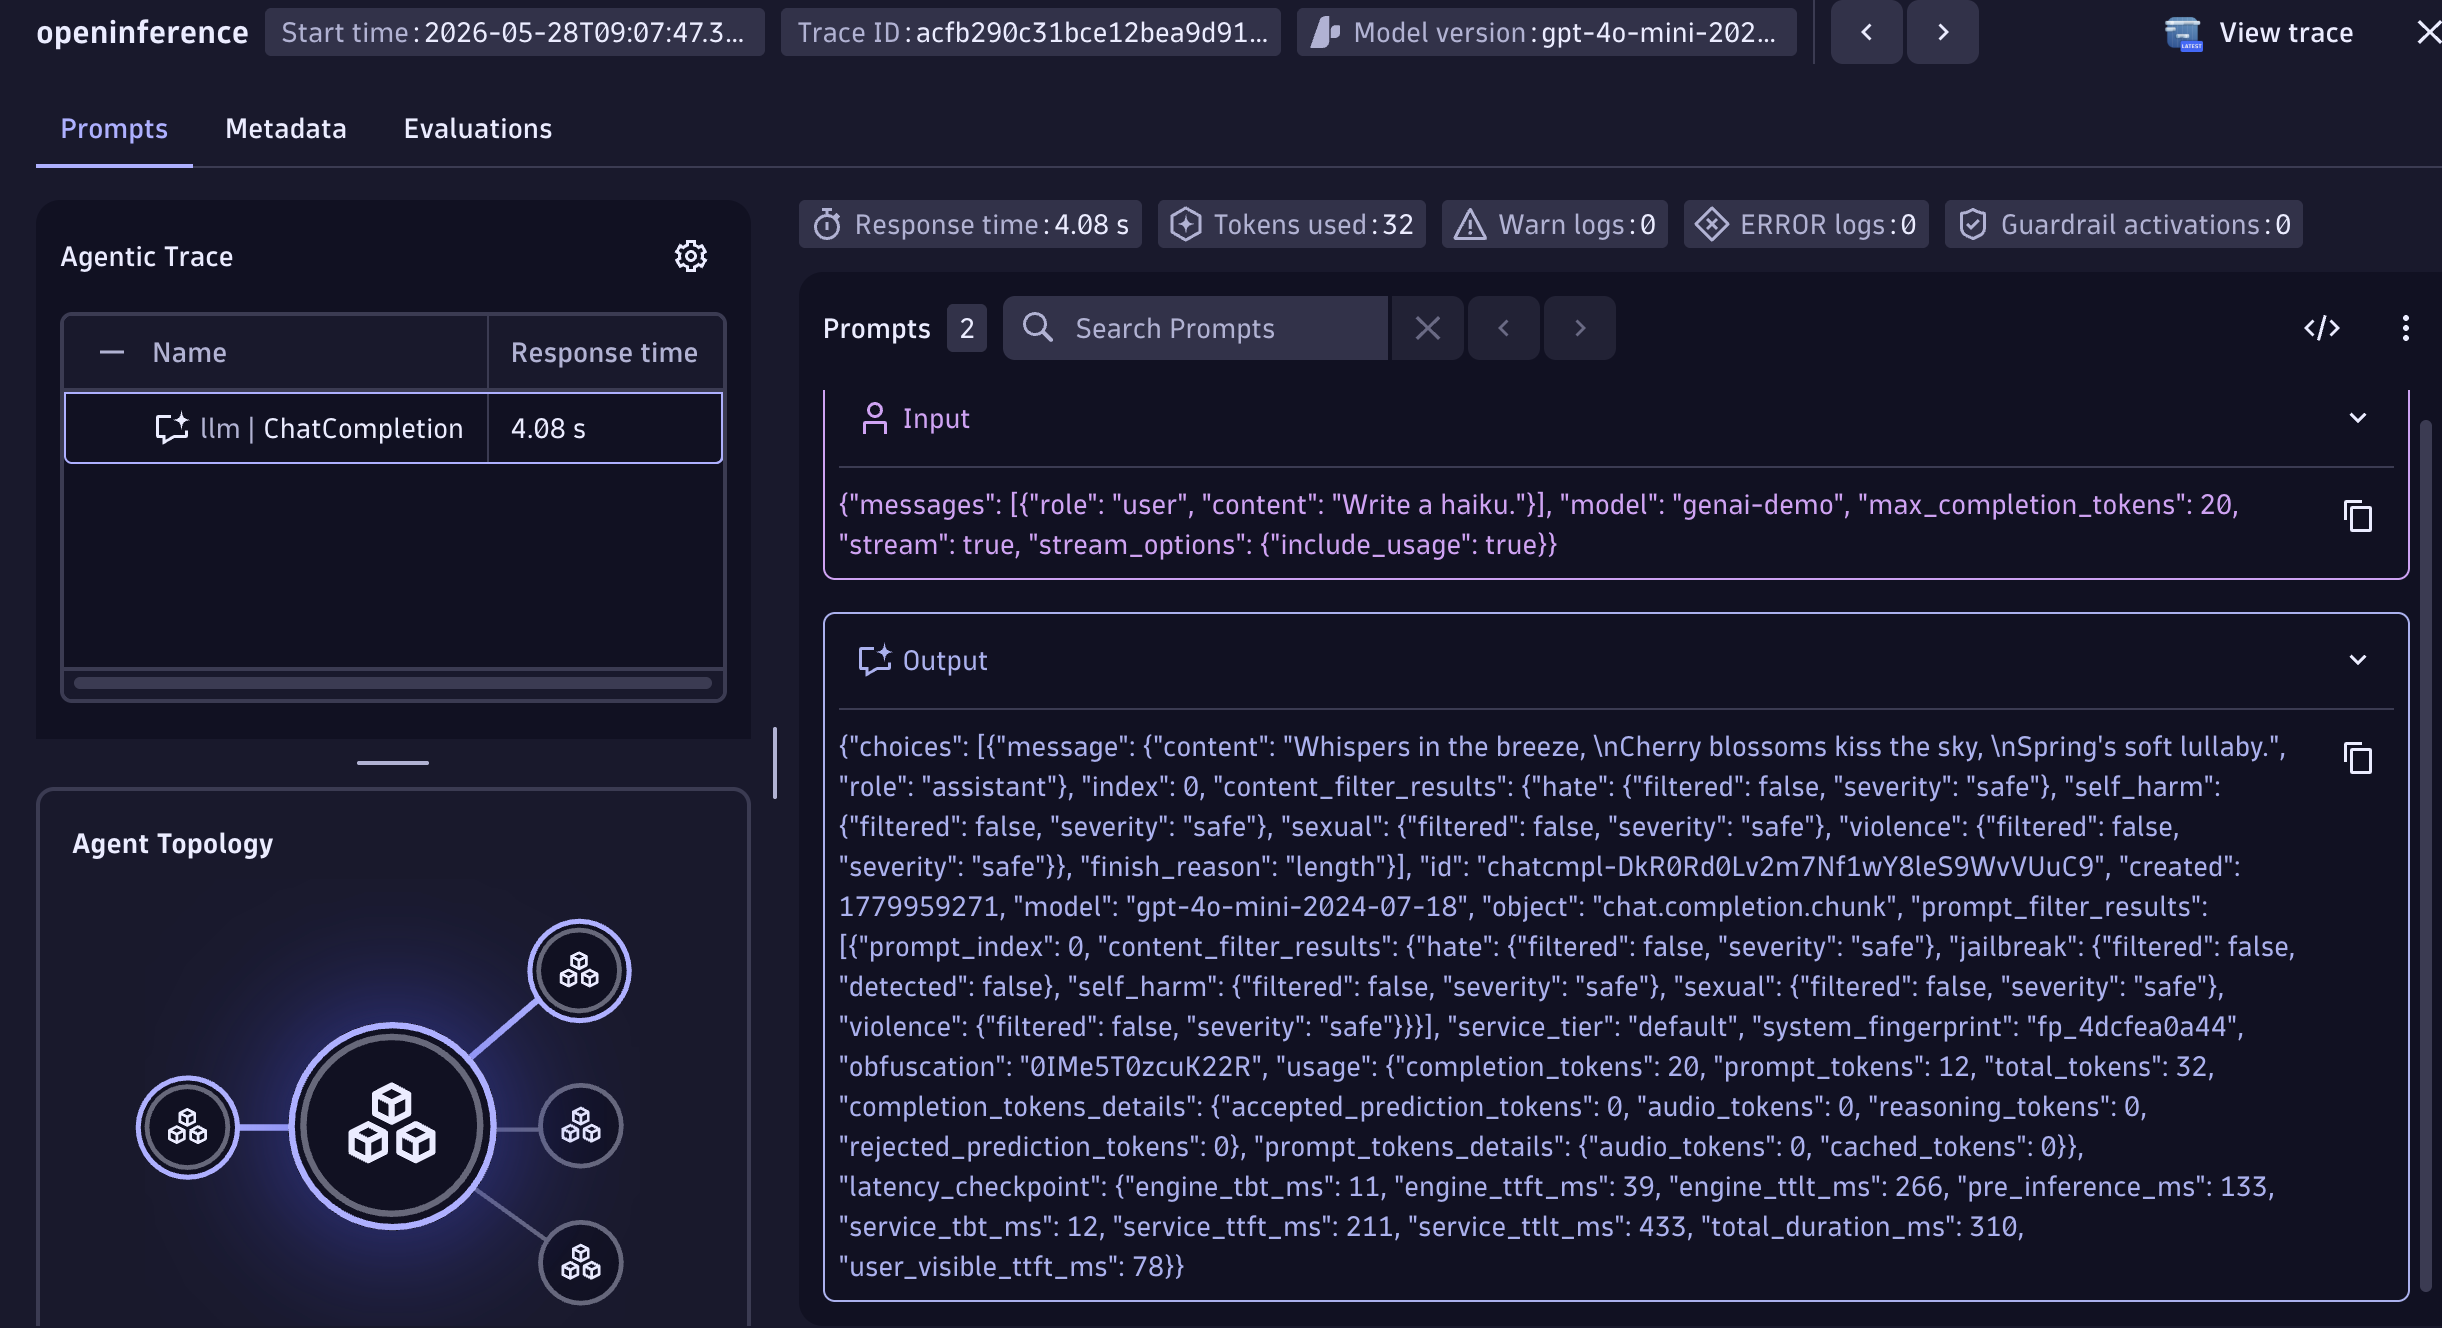
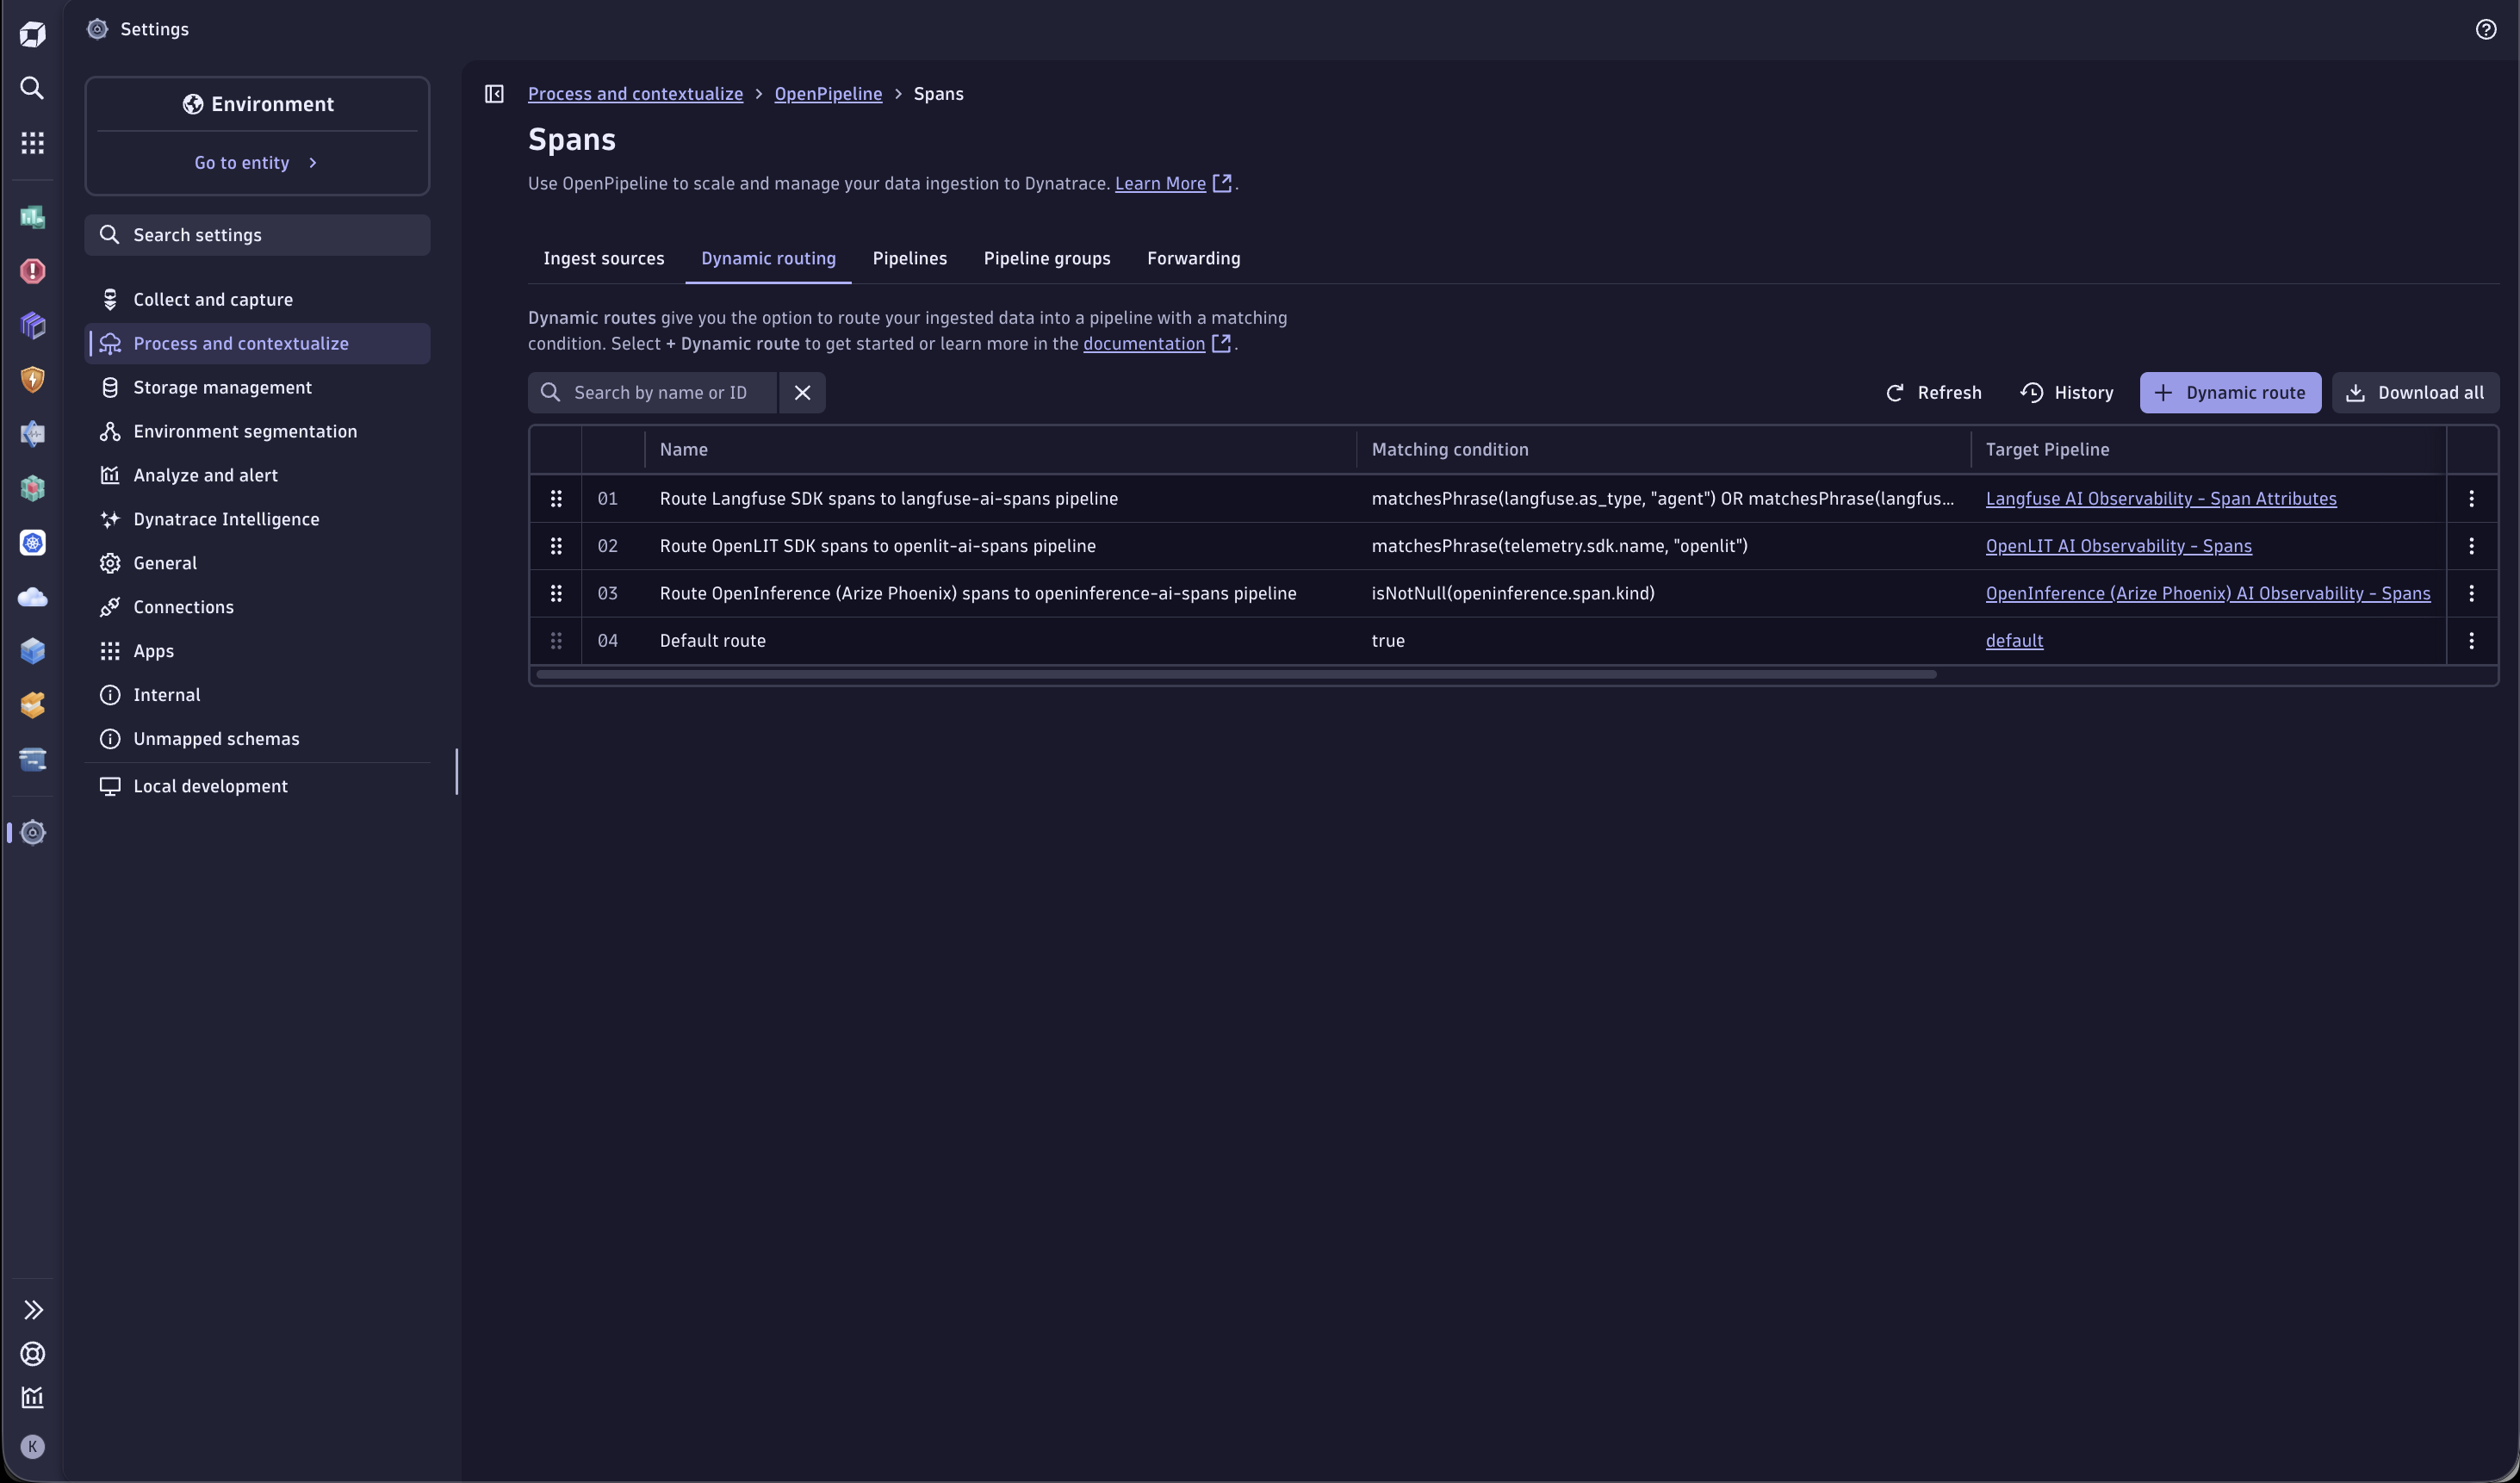
Get visibility into Agent Topology and dependency for your OpenInference instrumented AI servicesOpenInference reference instrumentation architecturePrompts stream showing all Agent and LLM interactions with model version, token count, and full prompt/response content.Trace-level debug view showing agentic span hierarchy, tool calls, prompt and response content, and agent topology for a single AI agent run.Debug your AI prompts captured by OpenInferenceOpenPipeline dynamic routing rules directing Langfuse, OpenLIT, and OpenInference spans to dedicated attribute-normalization pipelines.
  • Product information

Overview

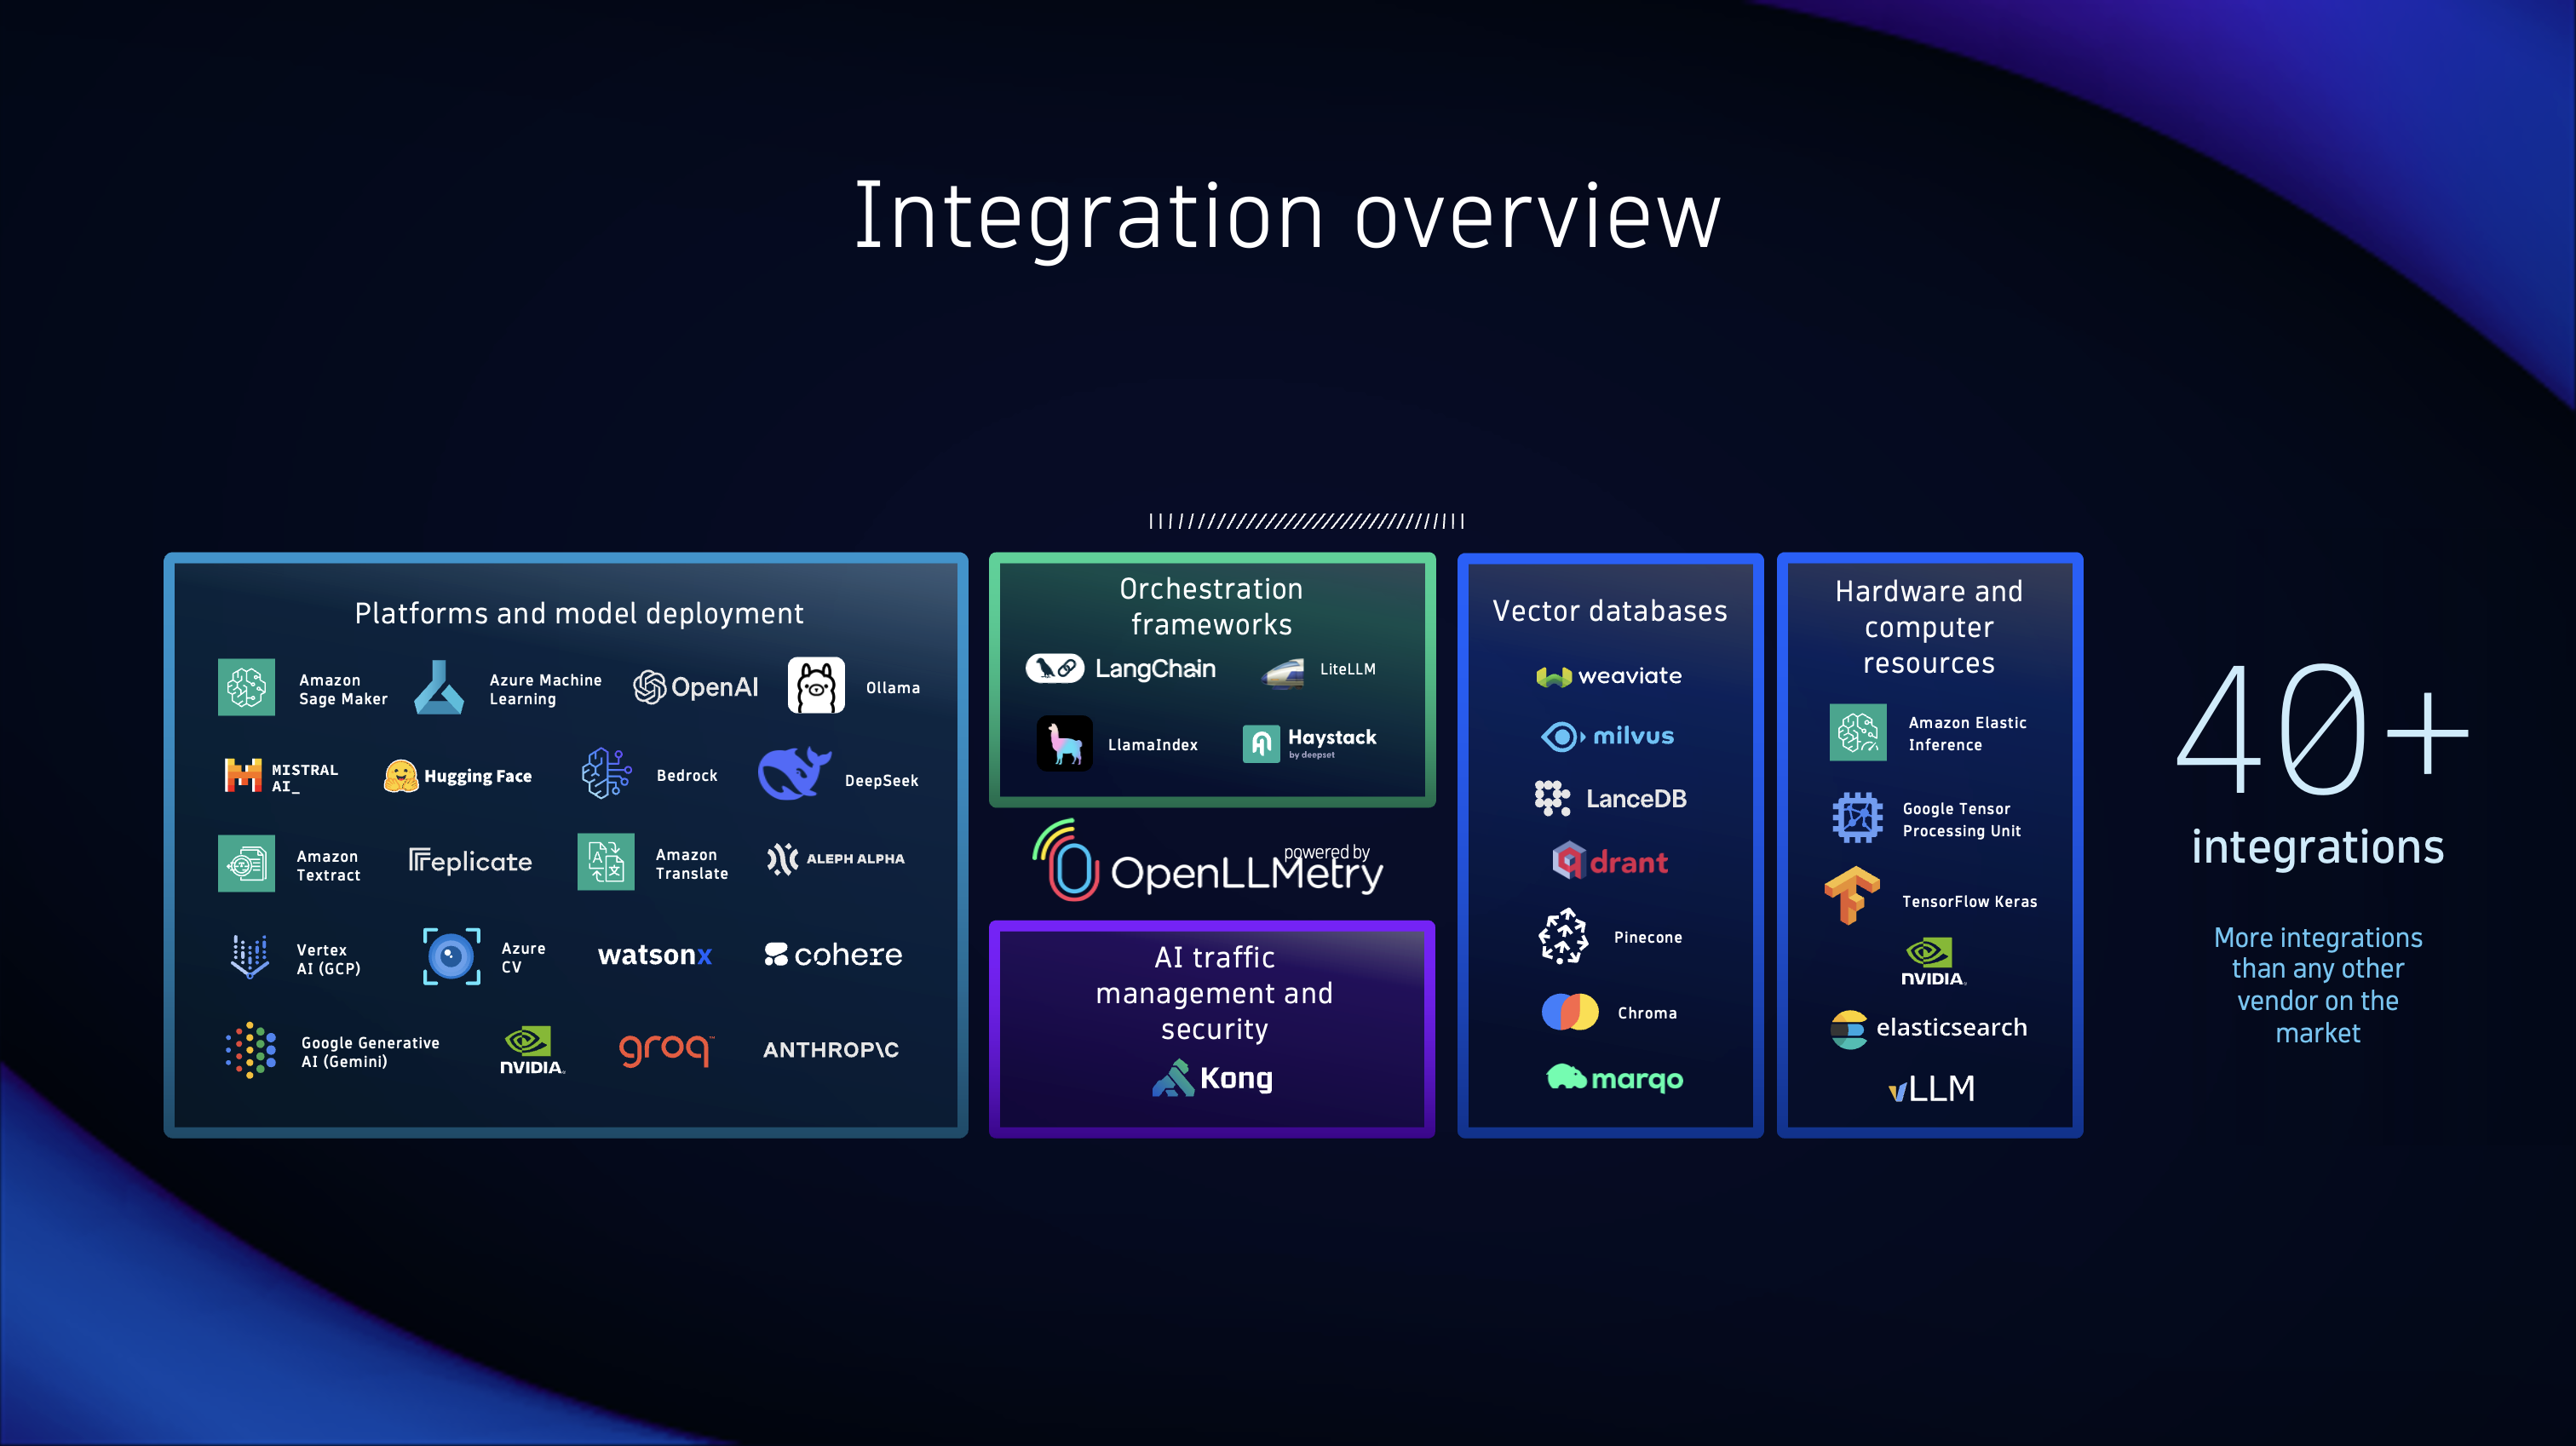
OpenInference is an open observability standard for AI applications, developed by Arize AI and built on top of OpenTelemetry. It provides auto-instrumentation for 33+ frameworks: including LangChain, LlamaIndex, CrewAI, AutoGen, OpenAI, Anthropic, and more. Capturing LLM calls, agent runs, tool invocations, retrieval steps, and quality evaluations as distributed traces, with no changes required to your application code.

OpenInference uses its own semantic conventions (llm.model_name, llm.token_count.*, openinference.span.kind, and others). Dynatrace normalizes these to the gen_ai.* OTel standard, via an OTel Collector transform processor or Dynatrace OpenPipeline: so your data populates the AI Observability app out of the box.

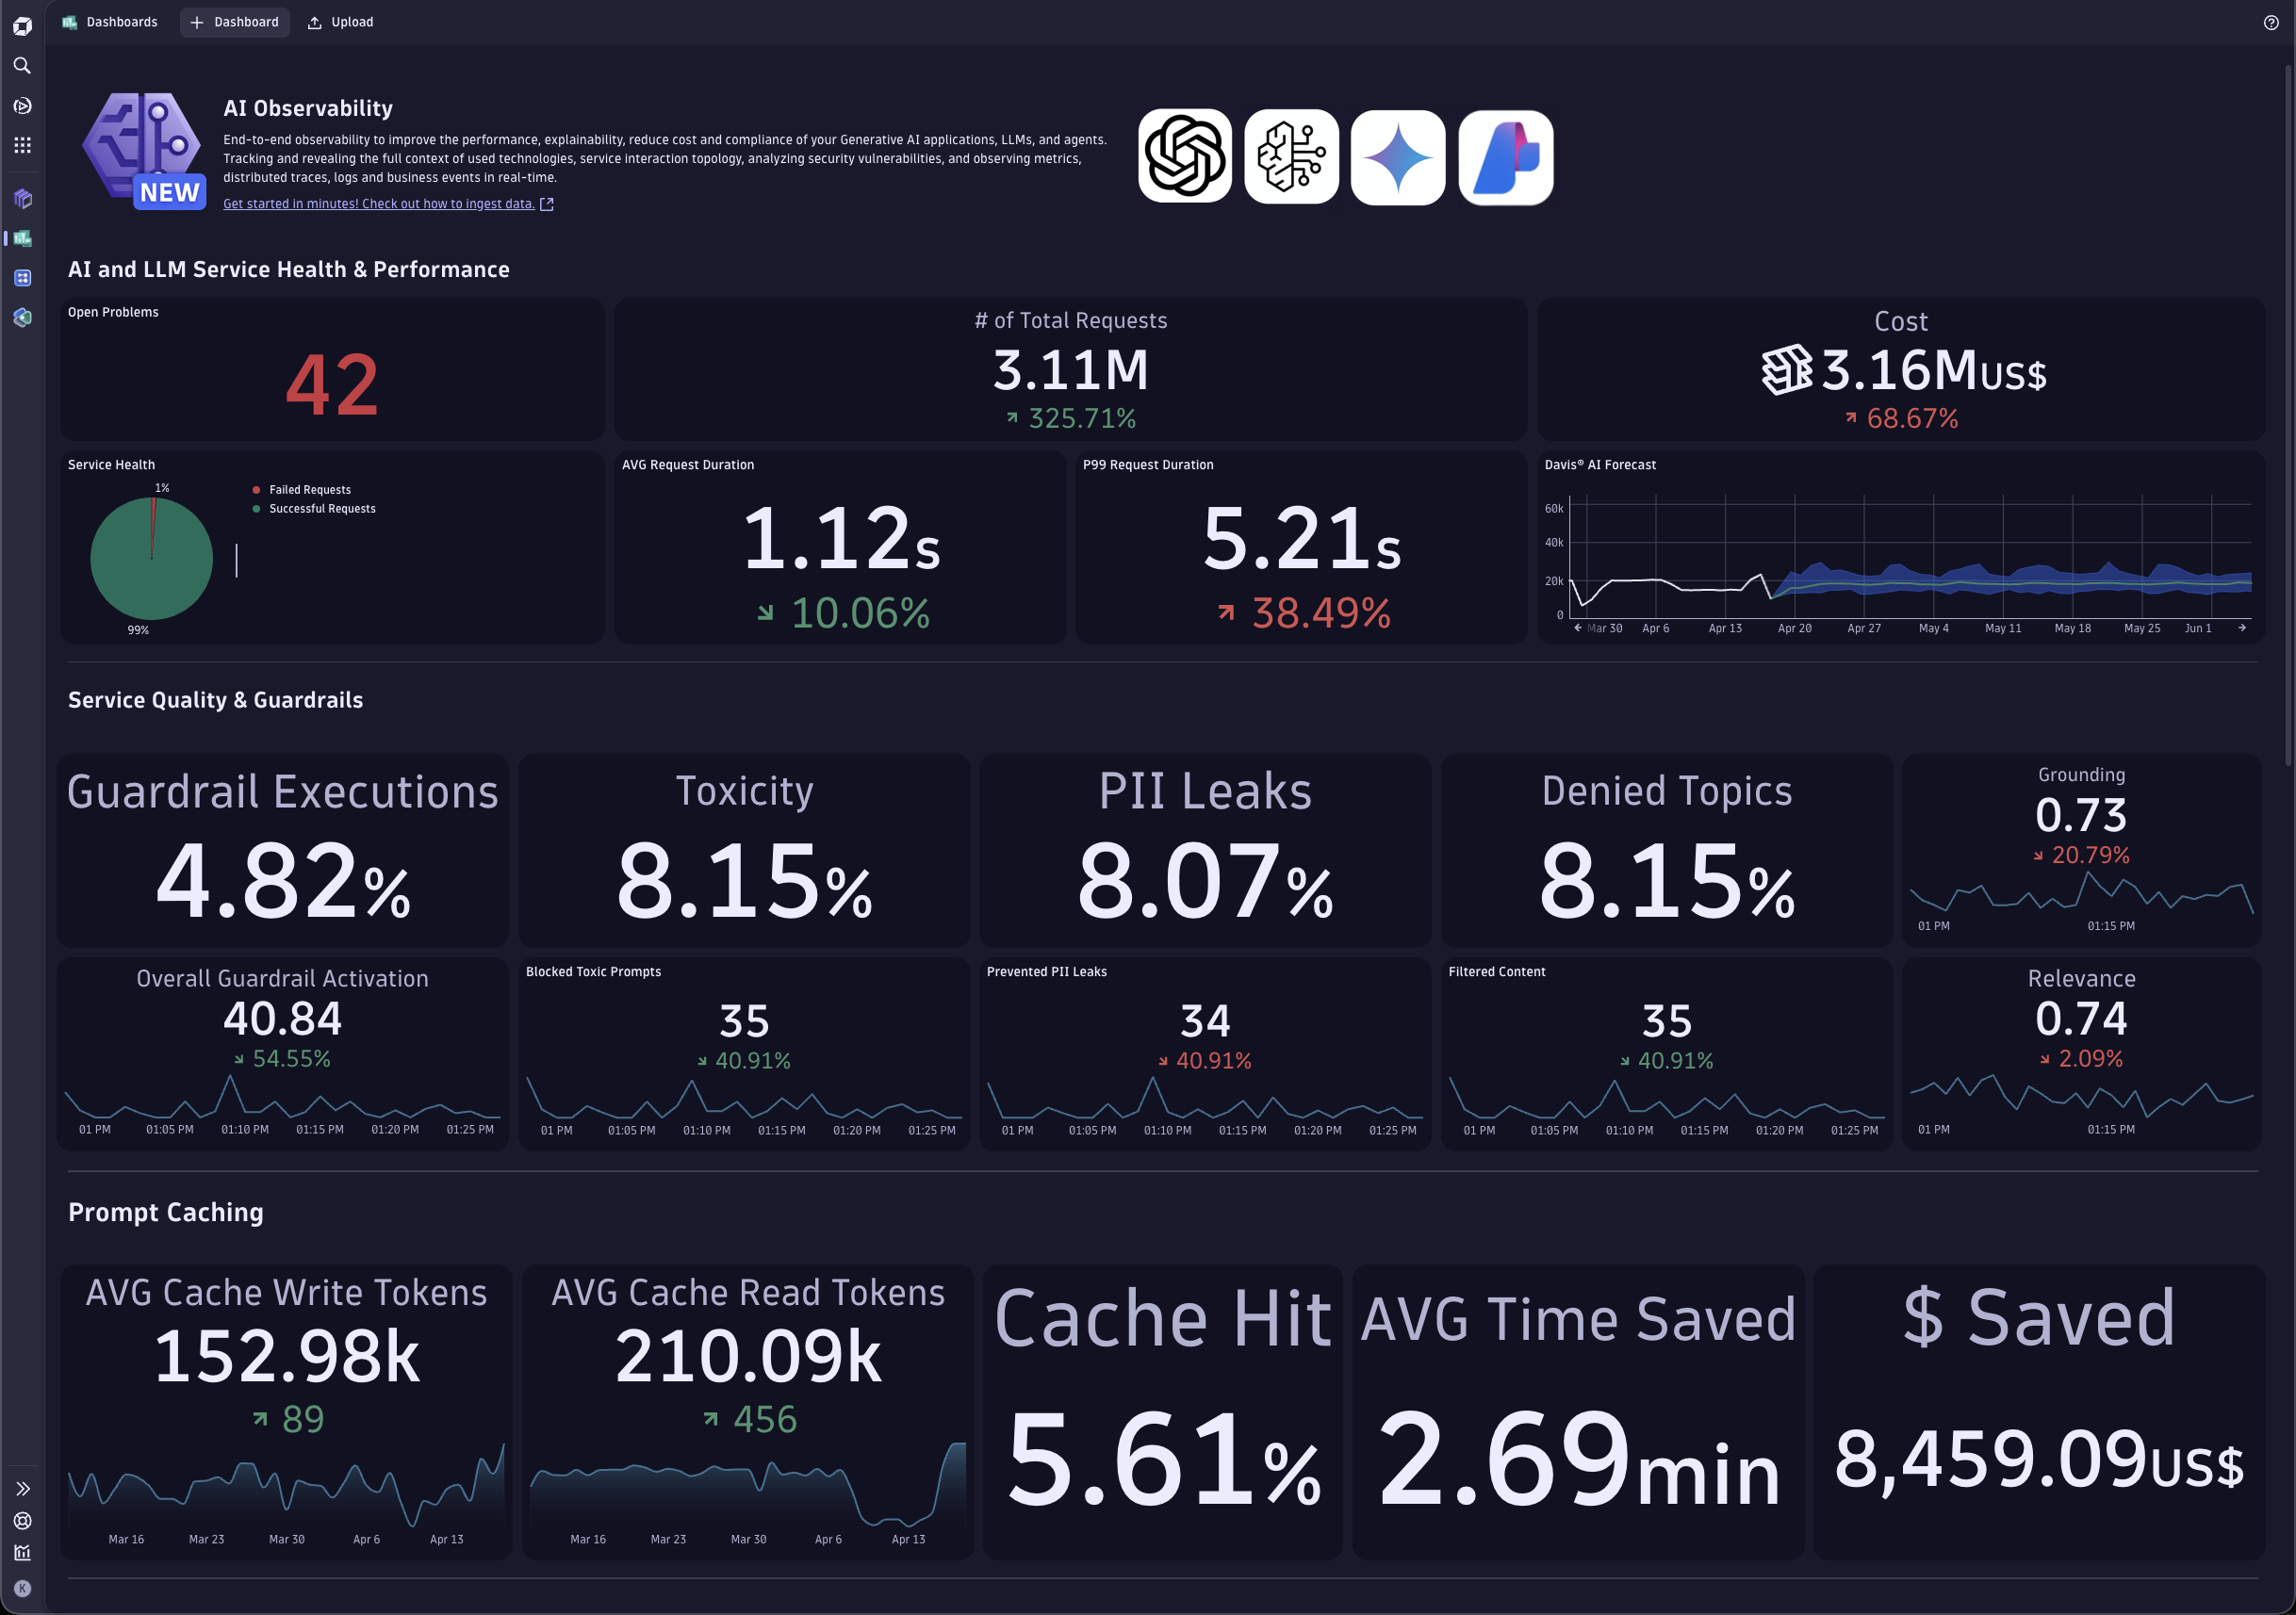
By connecting OpenInference to Dynatrace, you get full-stack visibility into your AI workloads: model performance, token consumption, cost, tool behavior, retrieval quality, and evaluation scores, all in one place.

Use cases

Monitor AI service health and performance

  • Detect bottlenecks by tracking real-time metrics including request counts, durations, and error rates across LLM providers and models.
  • Manage costs with automated token-level cost calculations broken down by model and provider.
  • Set error budgets for performance and cost controls, and validate consumption and response time per model.

End-to-end tracing and debugging of agentic AI

  • Achieve full visibility of prompt flows, tool calls, retrieval steps, and model handoffs — from initial request to final response — for faster root cause analysis.
  • Capture detailed debug data, including full prompt and completion content, to troubleshoot issues in complex multi-agent pipelines.
  • Pinpoint exact failure points in tool calls, prompts, tokens, or system integrations with granular span-level tracing following the GenAI semantic conventions.

Evaluate AI quality in production

  • Run LLM-as-judge and custom evaluation with dt-evals as first-class spans alongside your inference traces, with scores, labels, and explanations attached to the evaluated response.
  • Track quality metrics — relevance, groundedness, toxicity, and custom evaluators — over time alongside latency and cost.
  • Correlate evaluation regressions with model version changes, prompt updates, or provider switches.

Multi-framework coverage with a single pipeline

  • Instrument 33+ AI frameworks with a single OTLP export pipeline, no per-framework Dynatrace integration required.
  • Normalize all OpenInference conventions to gen_ai.* attributes once, via OTel Collector or OpenPipeline, and get consistent dashboards regardless of which framework your team uses.
  • Extend coverage to retrieval (RAG), reranking, and guardrail spans beyond standard LLM calls.

Get started

Setting up observability for your OpenInference-instrumented application requires one normalization step to map OpenInference attributes to the gen_ai.* format that Dynatrace AI Observability understands. This is done either with a Dynatrace OTel Collector (no Dynatrace configuration needed, one Docker command) or with Dynatrace OpenPipeline (server-side, no Collector to manage).

To get started, see our OpenInference instrumentation example on GitHub and the OpenInference + Dynatrace getting started guide.

Additionally, you can read more about how to install the AI Observability app.

Dynatrace
Documentation
By Dynatrace
Dynatrace support center
Copy to clipboard

Related to OpenInference

AI Observability logo

AI Observability

End-to-end observability for your Agentic AI and LLM workloads.

Dynatrace Hub
Hub HomeGet data into DynatraceBuild your own app
Dynatrace Intelligence - Agentic Operations SystemThe Dynatrace Agentic AI ecosystem
All (914)Log Management and AnalyticsKubernetesInfrastructure ObservabilitySoftware DeliveryApplication ObservabilityApplication SecurityBusiness ObservabilityDigital Experience
Filter
Type
Built and maintained by
Deployment model
SaaS
  • SaaS
  • Managed
Partner FinderBecome a partnerDynatrace Developer

AI and LLM Observability

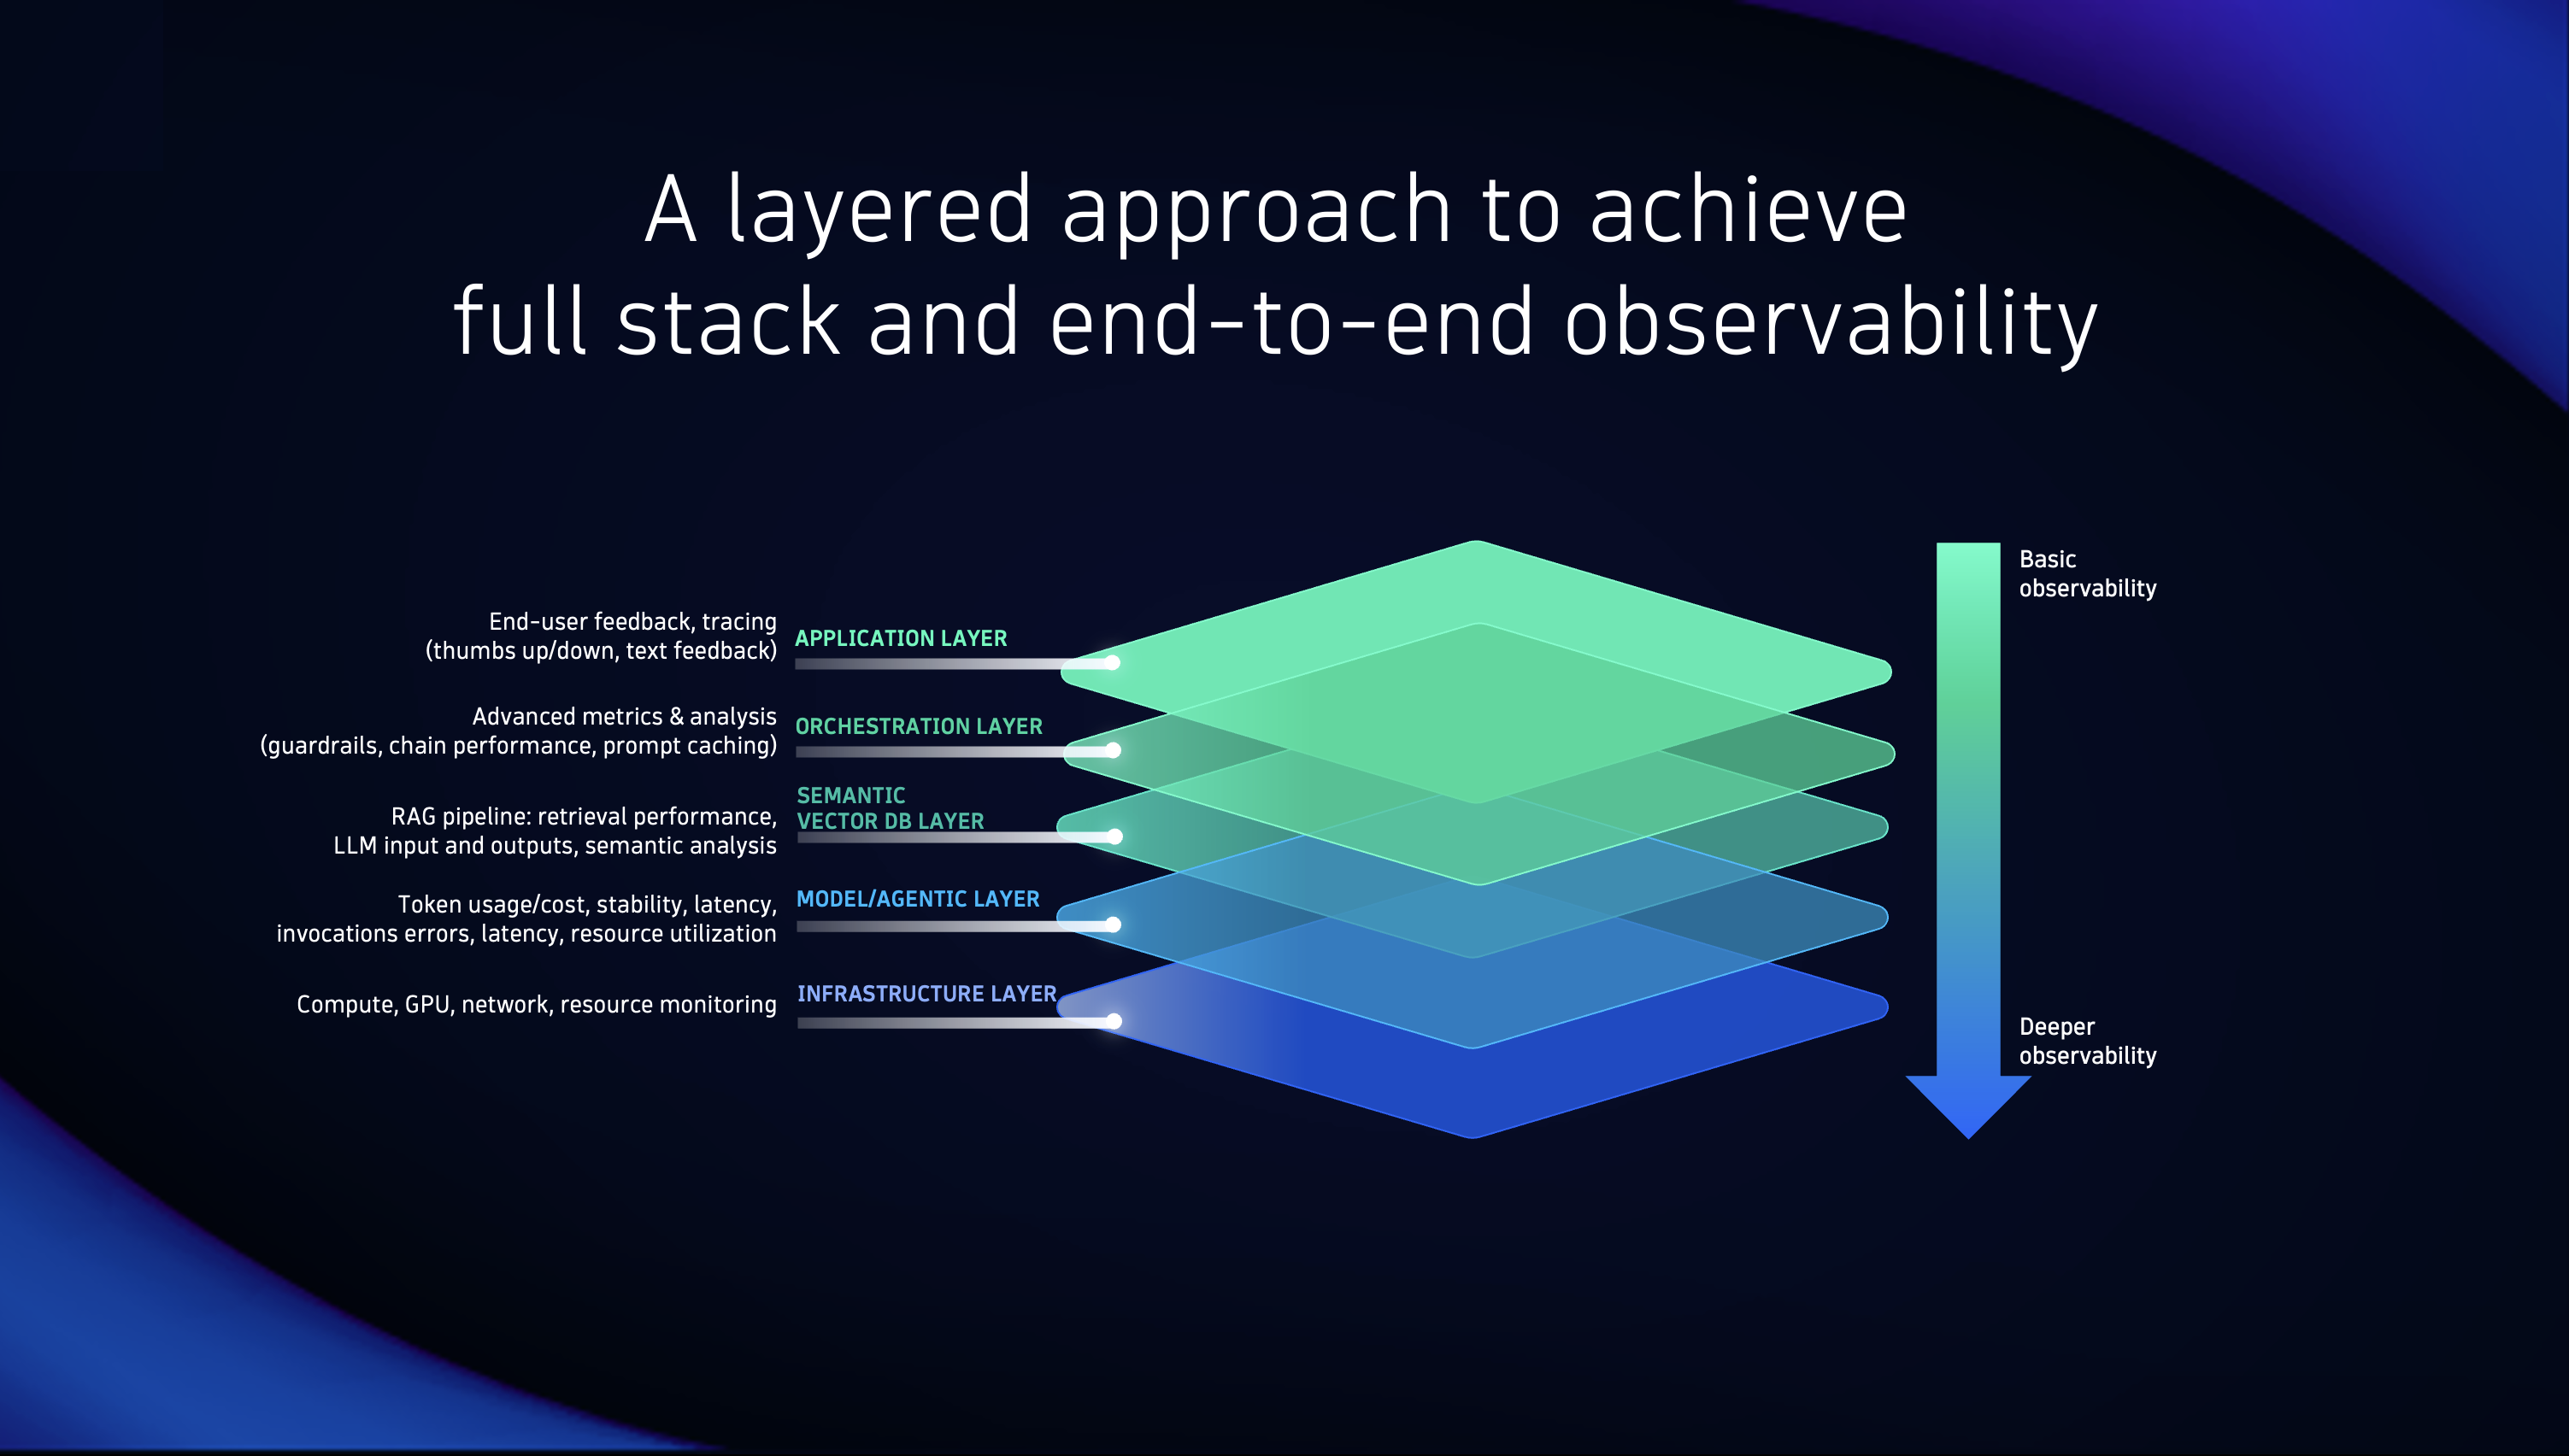
Achieve complete visibility and insights across every layer of your AI and LLM ecosystem – from data ingestion and vector stores to agentic frameworks and prompt engineering – ensuring optimal performance, cost efficiency, compliance, and system reliability at scale.

Essentials

AI Observability logo

AI Observability

End-to-end observability for your Agentic AI and LLM workloads.

OneAgent for GenAI logo

OneAgent for GenAI

Monitor and trace your AI workloads and apps automatically with OneAgent.

OpenTelemetry for GenAI logo

OpenTelemetry for GenAI

Ingest and analyze OTel GenAI traces & metrics for your AI workloads.

OpenInference logo

OpenInference

Instrument your AI agents, services and apps with OpenInference.

AI Agents

Get visibility into Agentic AI workloads: trace execution paths, tool invocations, and inter-agent communication. Monitor and debug Agent interactions (function calling, tool-use, RAG), and resolve performance, latency, cost, and reliability issues.

OpenAI Agents logo

OpenAI Agents

Monitor and trace your OpenAI Agents.

Amazon Bedrock AgentCore logo

Amazon Bedrock AgentCore

Monitor and trace your Amazon Bedrock AgentCore Agents.

Google ADK logo

Google ADK

Monitor your Google Agent Development Kit.

LangGraph logo

LangGraph

Monitor and trace your LangChain Agents.

Pydantic AI logo

Pydantic AI

Monitor and trace your Pydantic AI agents.

MCP AI Agent monitoring logo

MCP AI Agent monitoring

Monitoring and tracing of agents communicating via MCP.

Model providers and platforms

Monitor and gain insights into the performance, consumption, latency, availability, response time, and health of the platforms used for pre-trained foundational models, agentic frameworks, and specialized AI APIs for building, training, and deploying machine learning models.

See more (16)
OpenAI logo

OpenAI

Monitoring your OpenAI & Azure OpenAI services such as GPT, o1, DALL-E, ChatGPT.

Amazon Bedrock logo

Amazon Bedrock

Observe end-to-end generative AI models provided by Amazon Bedrock.

CrewAI logo

CrewAI

Monitor CrewAI workloads and AI Agents.

Azure AI Foundry logo

Azure AI Foundry

End-to-end observability for GenAI & LLM applications build with Azure.

Anthropic logo

Anthropic

Monitor end-to-end your Anthropic services such as Haiku, Sonnet, and Opus.

Gemini logo

Gemini

Observe end-to-end multimodal AI models provided by Google Gemini.

AI Coding Agent Monitoring

Monitor coding AI agents with end‑to‑end distributed tracing, cost and performance insights, and full‑stack context, so teams can reduce token spend, resolve agent failures faster, and confidently run AI‑driven code workflows in production.

Claude Code Agent monitoring logo

Claude Code Agent monitoring

Monitor your Claude Code coding agents with OTel.

Gemini CLI Monitoring logo

Gemini CLI Monitoring

End‑to‑end visibility into Gemini CLI usage, tokens, and performance.

OpenAI Codex Monitoring logo

OpenAI Codex Monitoring

Visibility into OpenAI Codex CLI usage, tokens, and performance in Dynatrace.

Github Copilot SDK Monitoring logo

Github Copilot SDK Monitoring

End-to-end insight into Copilot SDK model calls, performance, and token usage.

OpenCode Monitoring logo

OpenCode Monitoring

Visibility into OpenCode sessions, LLM calls, tools, and performance.

OpenClaw Monitoring logo

OpenClaw Monitoring

Monitor OpenClaw agent activity with AI observability in Dynatrace.

Data management and vector stores

Monitor, optimize, and manage data ingestion, preprocessing, and storage for traditional and vector-based workflows.

See more (2)
Pinecone logo

Pinecone

Gain insight into your Pinecone vector databases to build knowledgeable AI.

LanceDB logo

LanceDB

Monitor the performance of your multimodal AI database powered by LanceDB.

Chroma logo

Chroma

Gain insights into the health of your vector and embedding databases from Chroma.

Milvus logo

Milvus

Gain insights about vector database resource utilization and cache behavior.

Weaviate logo

Weaviate

Observe your semantic cache efficiency to reduce cost and latency for LLM apps.

Qdrant logo

Qdrant

Gain insights about your Qdrant semantic vector collections.

Orchestration and Prompt Engineering Frameworks

Automate multi-step LLM workflows, manage prompt chaining, agent-based systems, and retrieval-augmented generation (RAG).

LangChain logo

LangChain

Monitor your generative AI LLM applications built by LangChain framework.

Haystack logo

Haystack

Observe your LLM applications at scale, with RAG pipeline models by Haystack.

LlamaIndex logo

LlamaIndex

Monitor your LLM-powered agents and workflows built with LlamaIndex framework.

Infrastructure and Compute Resources

Manage and monitor hardware and compute environments for training, fine-tuning, costs, and inference acceleration.

Google Cloud Tensor Processing Units logo

Google Cloud Tensor Processing Units

Observe and monitor your machine learning models built on top of Tensor Units.

TensorFlow Keras logo

TensorFlow Keras

Observe the training progress of TensorFlow Keras AI models.

NVIDIA GPU logo

NVIDIA GPU

Monitor base parameters of the GPU, including load, memory and temperature.

vLLM logo

vLLM

Monitor your services built with vLLM's inference and LLM serving solution.

Security, Governance and Traffic Management

Ensure secure, compliant, and well-routed AI traffic with transparent governance and policy enforcement.

Kong AI logo

Kong AI

Automatic, intelligent observability for Kong AI and LLM API traffic.

LiteLLM logo

LiteLLM

Automatic, intelligent observability for your LLM Gateway traffic.

More resources

Groq logo

Groq

Monitor your services built with Groq AI inference models.

Microsoft Agent Framework logo

Microsoft Agent Framework

Observe your Microsoft Agent Framework AI agents with built-in OpenTelemetry.

Are you looking for something different?

We have hundreds of apps, extensions, and other technologies to customize your environment

More resources

AI and LLM Observability

AI and LLM Observability

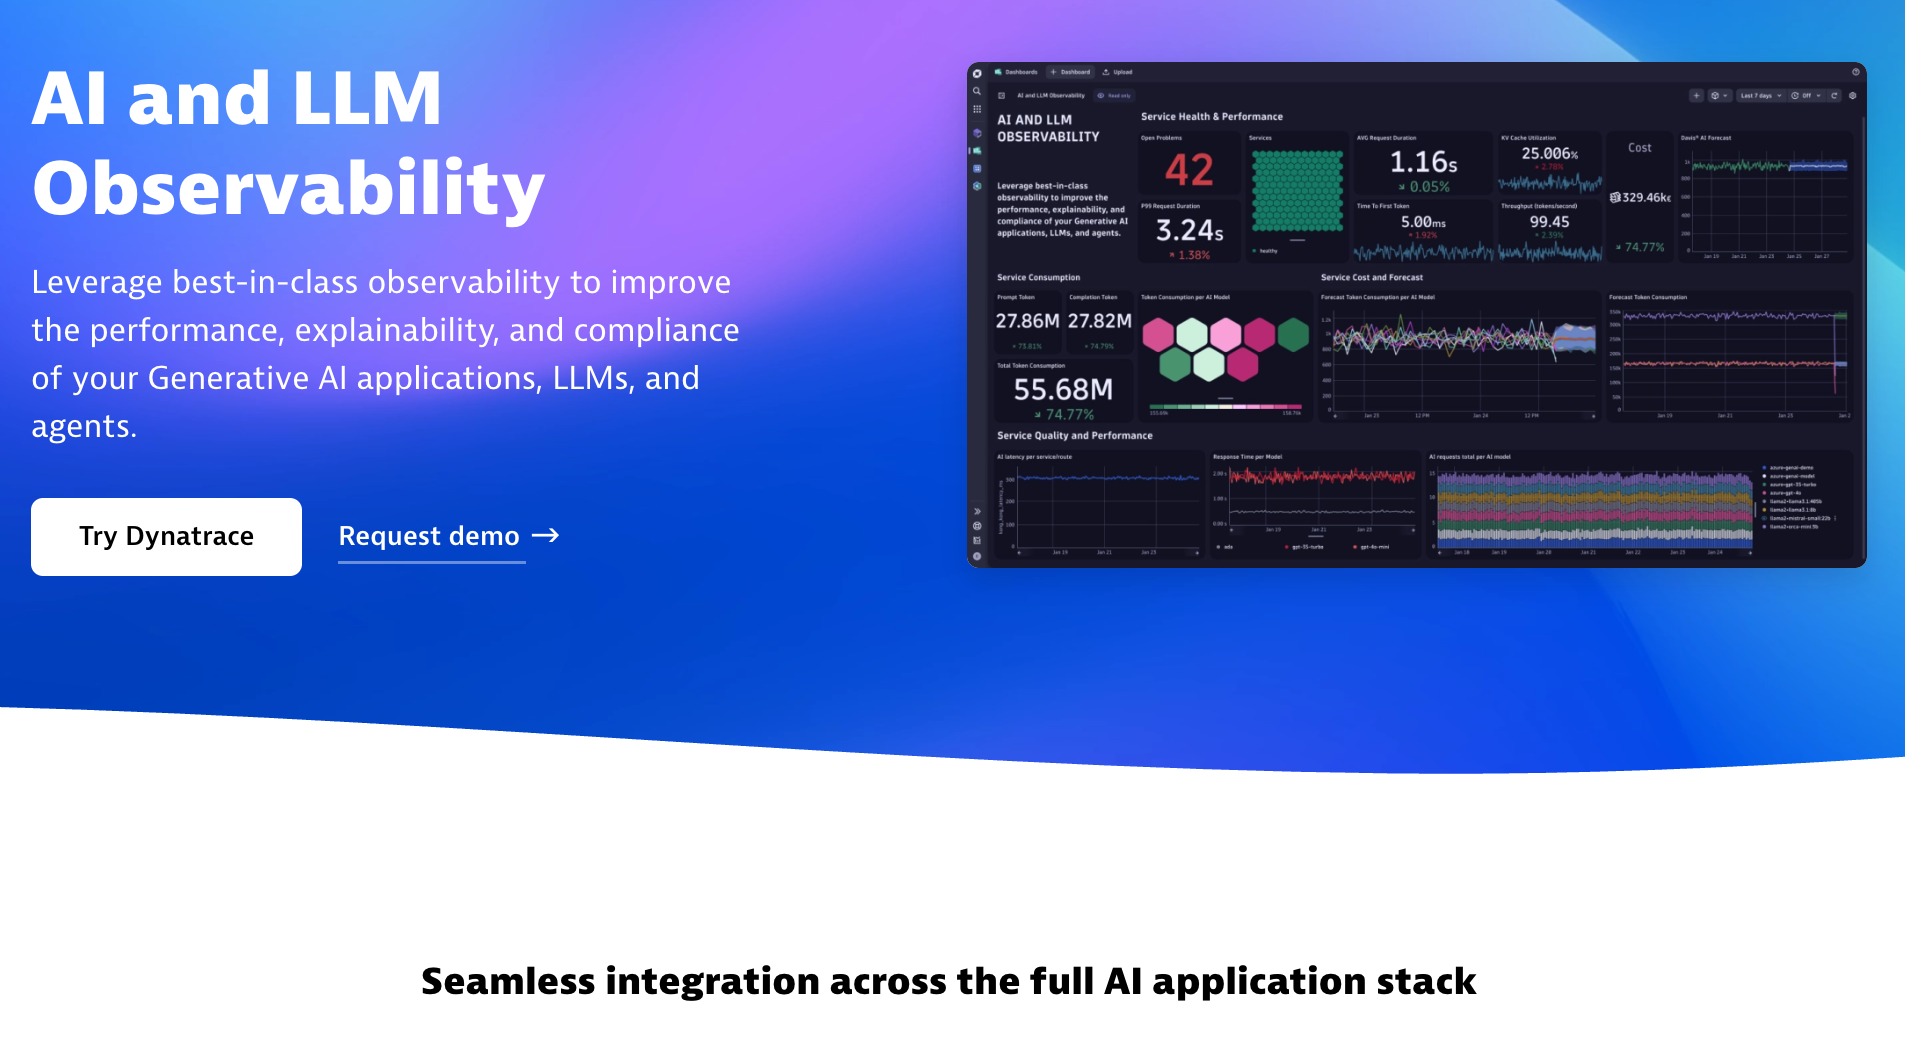
Leverage best-in-class observability to improve the performance, explainability, and compliance of your Generative AI applications, LLMs, and agents.
Read more

Deliver secure, safe GenAI apps with Dynatrace

Deliver secure, safe GenAI apps with Dynatrace

Amazon Bedrock, equipped with Dynatrace Davis® AI and LLM observability, gives you end-to-end insight into the Generative AI stack, from code-level visibility and performance metrics to GenAI-specific guardrails.
Read more
AI and LLM Observability Solution

AI and LLM Observability Solution

Leverage best-in-class observability to improve the performance, explainability, and compliance of your Generative AI applications, LLMs, and agents.
Read more
AI Observability Documentation

AI Observability Documentation

Documentation