





































































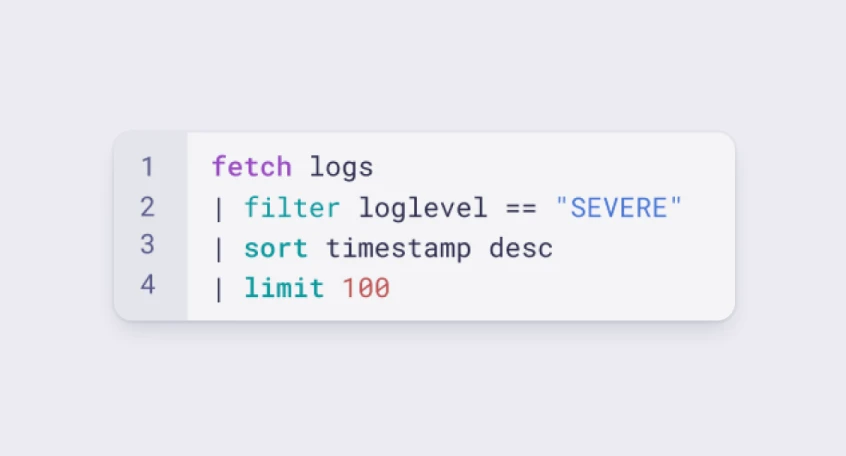
Learn the Dynatrace Query Language
Explore data, discover patterns, anomalies and outliers, and create statistical modeling with DQL, our powerful query language..
Learn DQL
 Palo Alto firewalls
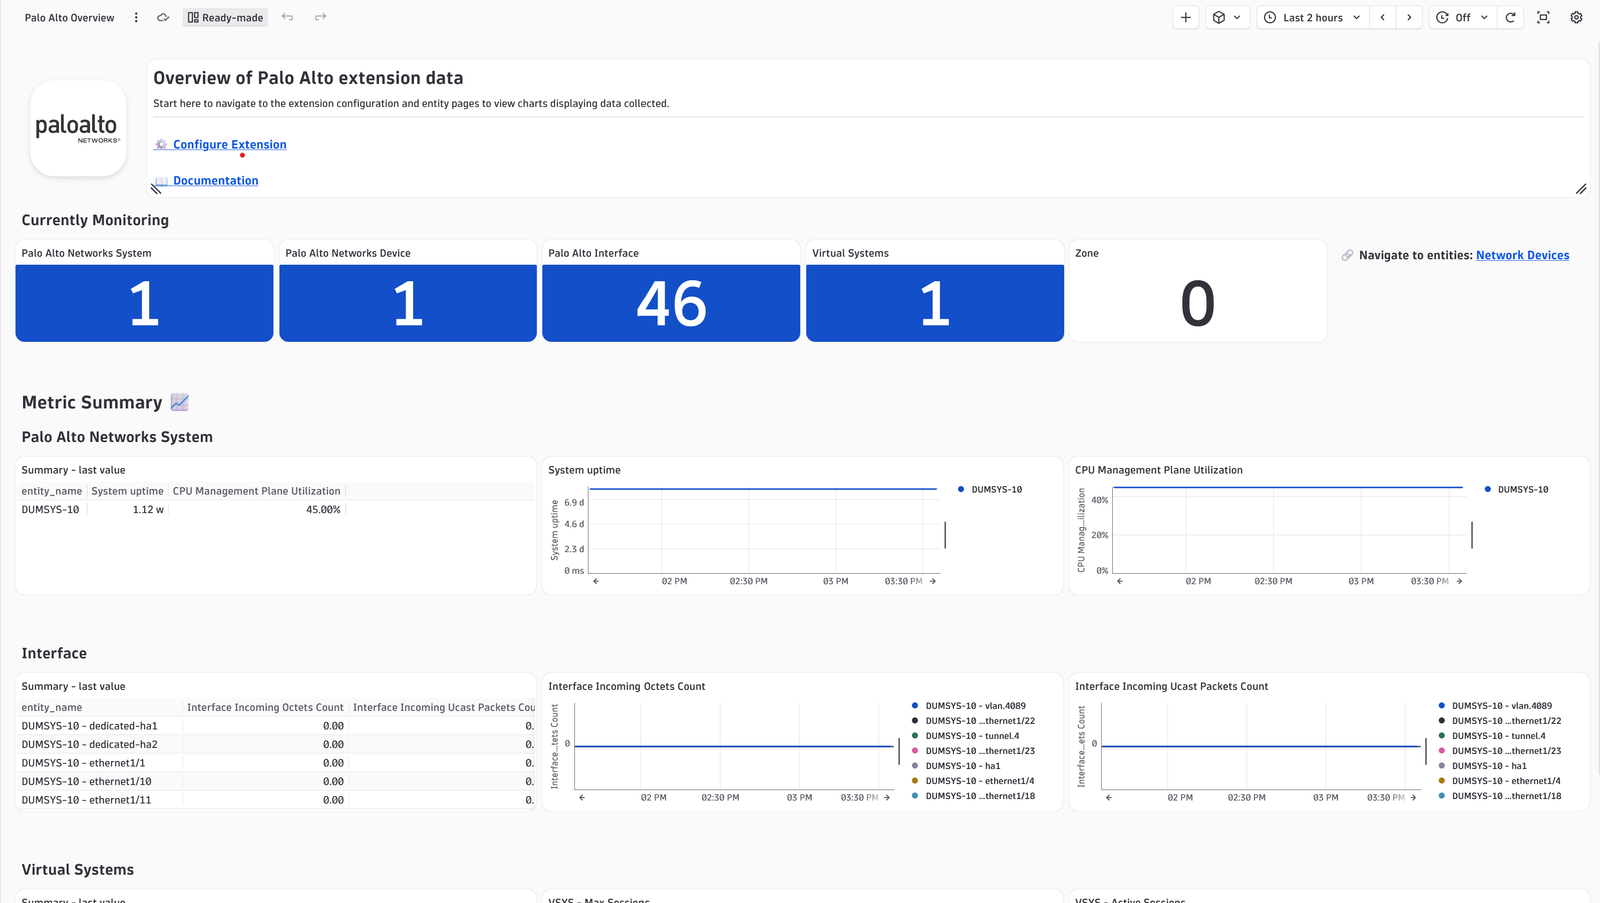
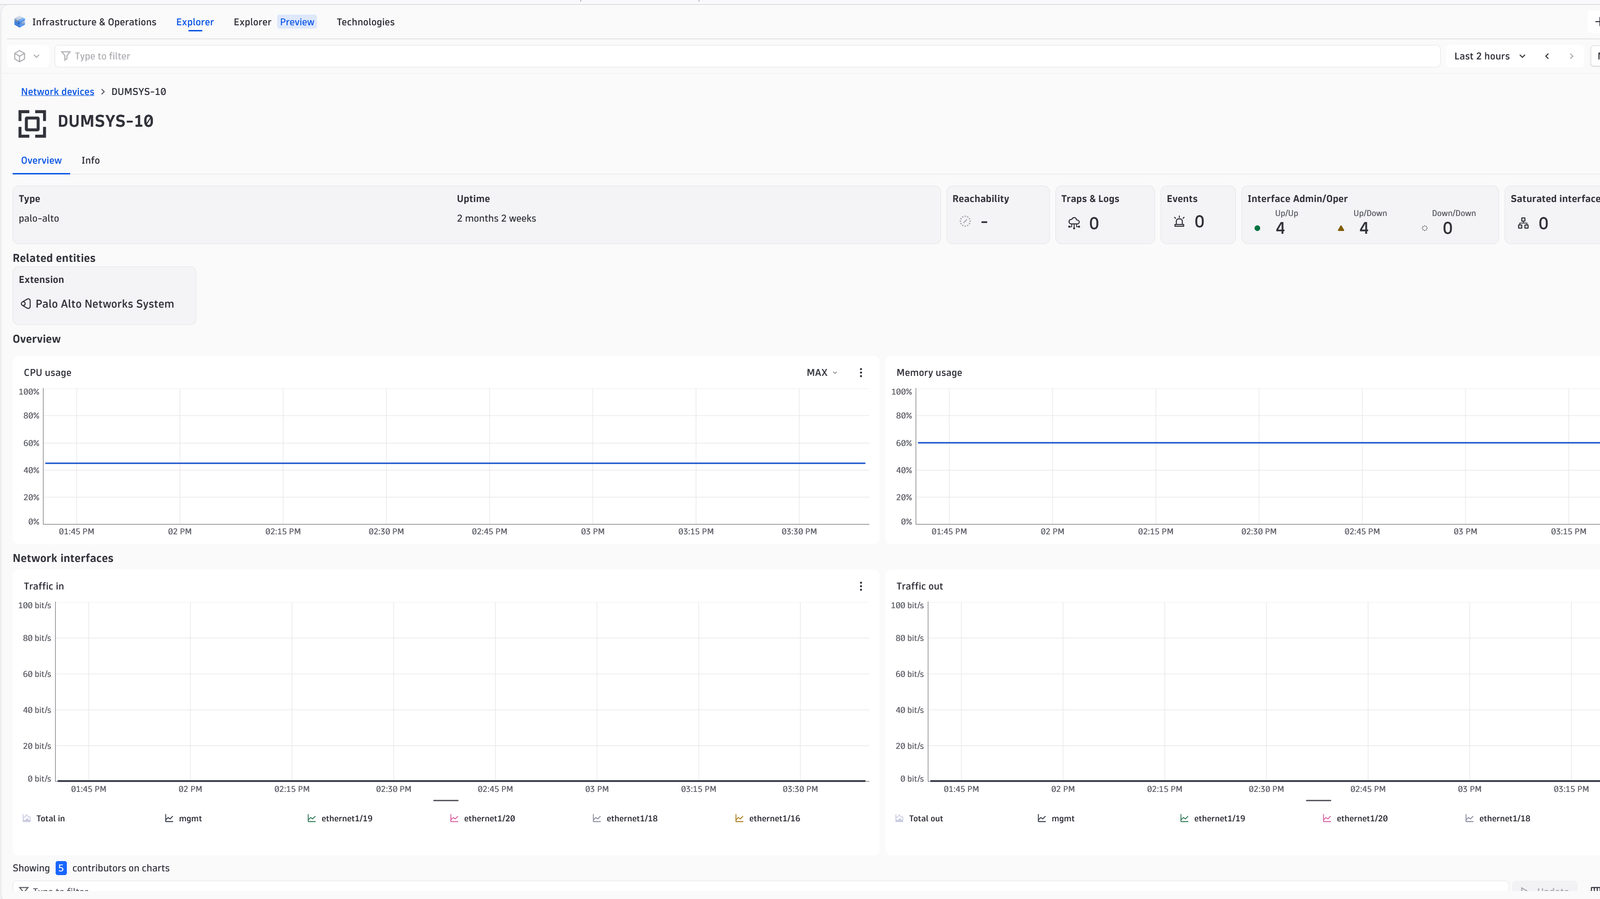
This extension leverages the SNMP protocol to provide a complete solution to monitor your Palo Alto Firewalls. The complete configuration is provided out-of-the-box.
Monitor health state and performance of your Palo Alto firewalls and provide unified analysis for Ops, DevOps and IT Admins.
For more information on the installation and configuration, please see Palo Alto firewalls extension in the Dynatrace Documentation.
Below is a complete list of the feature sets provided in this version. To ensure a good fit for your needs, individual feature sets can be activated and deactivated by your administrator during configuration.
| Metric name | Metric key | Description | Unit |
|---|---|---|---|
| - | com.dynatrace.extension.network_device.if.status | - | - |
| - | com.dynatrace.extension.network_device.sysuptime | - | - |
| - | com.dynatrace.extension.network_device.cpu_usage | - | - |
| - | com.dynatrace.extension.network_device.memory_total | - | - |
| - | com.dynatrace.extension.network_device.memory_used | - | - |
| Metric name | Metric key | Description | Unit |
|---|---|---|---|
| - | com.dynatrace.extension.palo-alto.generic.if.entity | - | - |
| Interface Incoming Octets Count | com.dynatrace.extension.palo-alto.generic.if.in.octets.count | - | Count |
| Interface Incoming Ucast Packets Count | com.dynatrace.extension.palo-alto.generic.if.in.ucast.packets.count | - | Count |
| Interface Outgoing Octets Count | com.dynatrace.extension.palo-alto.generic.if.out.octets.count | - | Count |
| Interface Outgoing Packets Count | com.dynatrace.extension.palo-alto.generic.if.out.ucast.packets.count | - | Count |
| Interface Incoming Errors | com.dynatrace.extension.palo-alto.generic.if.in.err.count | - | Count |
| Interface Outgoing Errors | com.dynatrace.extension.palo-alto.generic.if.out.err.count | - | Count |
| Interface Incoming Discards | com.dynatrace.extension.palo-alto.generic.if.in.discards.count | - | Count |
| Interface Outgoing Discards | com.dynatrace.extension.palo-alto.generic.if.out.discards.count | - | Count |
| Metric name | Metric key | Description | Unit |
|---|---|---|---|
| PAN LC Log Rate | com.dynatrace.extension.palo-alto.generic.lc.log_rate | The write rate in logs/s on the Log Collection. | PerSecond |
| PAN LC Disk Usage | com.dynatrace.extension.palo-alto.generic.lc.disk_usage | The Log disk usage for logical disks on the Log Collector | MegaByte |
| PAN LC Log Duration | com.dynatrace.extension.palo-alto.generic.lc.log_duration | The Log duration (in days) for the logs on the Log Collector | Day |
| Metric name | Metric key | Description | Unit |
|---|---|---|---|
| System uptime | com.dynatrace.extension.palo-alto.generic.sys.uptime | - | MilliSecond |
| CPU Management Plane Utilization | com.dynatrace.extension.palo-alto.generic.cpu.management.utilization | - | Percent |
| CPU System Plane Utilization | com.dynatrace.extension.palo-alto.generic.cpu.system.utilization | - | Percent |
| Memory Allocation Units | com.dynatrace.extension.palo-alto.generic.mem.allocation.units | The size in bytes of the data objects allocated from this pool. | Byte |
| Memory Size | com.dynatrace.extension.palo-alto.generic.mem.size | - | Byte |
| Memory Used | com.dynatrace.extension.palo-alto.generic.mem.used | - | Byte |
| Memory Allocation Failures | com.dynatrace.extension.palo-alto.generic.mem.allocation.failures.count | The number of requests for storage represented by this entry that could not be honored due to not enough storage. | Count |
| Metric name | Metric key | Description | Unit |
|---|---|---|---|
| - | com.dynatrace.extension.network_device.if.in.multicast_pkts.count | - | - |
| - | com.dynatrace.extension.network_device.if.out.multicast_pkts.count | - | - |
| - | com.dynatrace.extension.network_device.if.in.broadcast_pkts.count | - | - |
| - | com.dynatrace.extension.network_device.if.out.broadcast_pkts.count | - | - |
| - | com.dynatrace.extension.network_device.if.in.ucast_pkts.count | - | - |
| - | com.dynatrace.extension.network_device.if.out.ucast_pkts.count | - | - |
| - | com.dynatrace.extension.network_device.if.lastchange | - | - |
| Metric name | Metric key | Description | Unit |
|---|---|---|---|
| Incoming log rate | com.dynatrace.extension.palo-alto.generic.pandeviceincominglograte | The incoming rate in logs/s on the Device. PAN-COMMON-MIB | PerSecond |
| Write log rate | com.dynatrace.extension.palo-alto.generic.pandevicewritelograte | The write rate in logs/s on the Device. PAN-COMMON-MIB | PerSecond |
| Metric name | Metric key | Description | Unit |
|---|---|---|---|
| Total Power Available (Watts) | com.dynatrace.extension.palo-alto.generic.power.available | - | Count |
| Total Power Used (Watts) | com.dynatrace.extension.palo-alto.generic.power.used | - | Count |
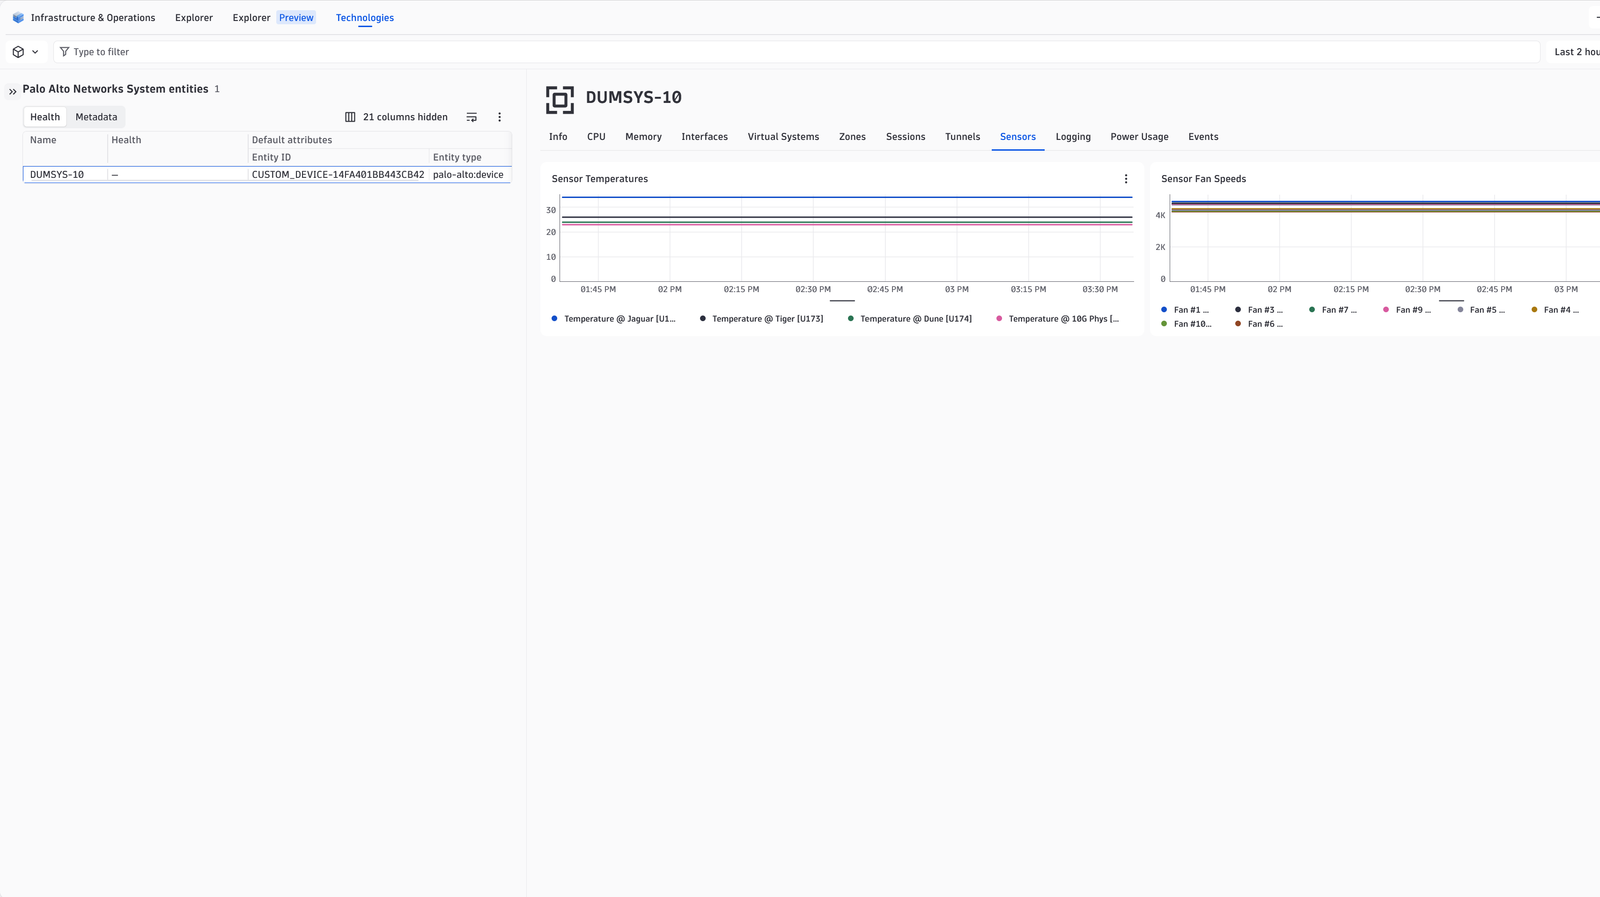
| Sensor Value | com.dynatrace.extension.palo-alto.generic.sensor.value | entPhySensorValue objects, represent fan speed and temperature. | Unspecified |
| Metric name | Metric key | Description | Unit |
|---|---|---|---|
| - | com.dynatrace.extension.network_device.if.bytes_in.count | - | - |
| - | com.dynatrace.extension.network_device.if.bytes_out.count | - | - |
| - | com.dynatrace.extension.network_device.if.in.errors.count | - | - |
| - | com.dynatrace.extension.network_device.if.out.errors.count | - | - |
| - | com.dynatrace.extension.network_device.if.in.discards.count | - | - |
| - | com.dynatrace.extension.network_device.if.out.discards.count | - | - |
| Metric name | Metric key | Description | Unit |
|---|---|---|---|
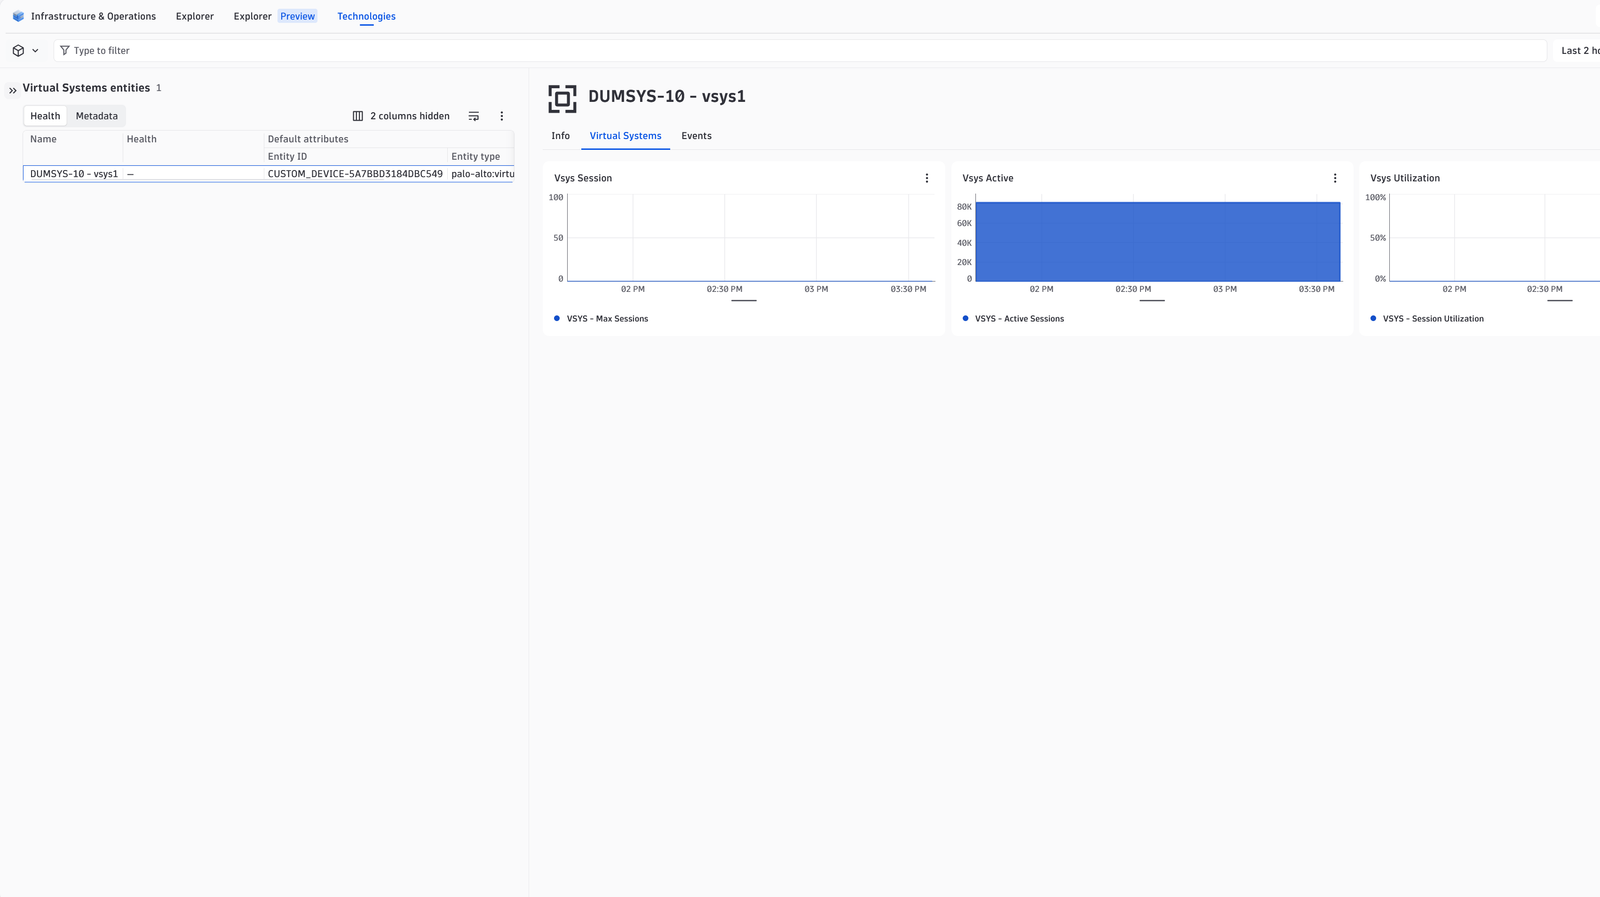
| VSYS - Max Sessions | com.dynatrace.extension.palo-alto.generic.vsys.sessions.max | - | Count |
| VSYS - Active Sessions | com.dynatrace.extension.palo-alto.generic.vsys.sessions.active | - | Count |
| VSYS - Session Utilization | com.dynatrace.extension.palo-alto.generic.vsys.sessions.utilization | - | Percent |
| Metric name | Metric key | Description | Unit |
|---|---|---|---|
| System Users | com.dynatrace.extension.palo-alto.generic.sys.host.num_users | The number of user sessions for which this host is storing state information. hrSystemNumUsers | Count |
| System Processes | com.dynatrace.extension.palo-alto.generic.sys.host.num_processes | The number of process contexts currently loaded or running on this system. hrSystemProcesses | Count |
| System Max Processes | com.dynatrace.extension.palo-alto.generic.sys.host.max_processes | The maximum number of process contexts this system can support. hrSystemMaxProcesses | Count |
| Load Average 1min | com.dynatrace.extension.palo-alto.generic.sys.host.load_average | The 1 minute load average. laLoad | Count |
| Metric name | Metric key | Description | Unit |
|---|---|---|---|
| Zone active TCP connections per second | com.dynatrace.extension.palo-alto.generic.zone.active.tcp.cps | Number of active TCP connections per second for this zone. panZoneActiveTcpCps - PAN-COMMON-MIB | PerSecond |
| Zone active UDP connections per second | com.dynatrace.extension.palo-alto.generic.zone.active.udp.cps | Number of active UDP connections per second for this zone. panZoneActiveUdpCps - PAN-COMMON-MIB | PerSecond |
| Zone Other IP connections per second | com.dynatrace.extension.palo-alto.generic.zone.active.otherip.cps | Number of active Other IP connections per second for this zone. panZoneActiveOtherIpCps - PAN-COMMON-MIB | PerSecond |
| Metric name | Metric key | Description | Unit |
|---|---|---|---|
| Sys release date info | com.dynatrace.extension.palo-alto.generic.sys.release.dates | Dimensions: panSysSwVersion panSysAppVersion, panSysAppReleaseDate, panSysThreatVersion, panSysThreatReleaseDate, panSysAvVersion, panSysAvReleaseDate, panSysWildfireVersion, panSysWfReleaseDate, panSysUrlFilteringVersion, panSysHAState, panSysHAPeerState, chassis.type . PAN-COMMON-MIB | PerSecond |
| Metric name | Metric key | Description | Unit |
|---|---|---|---|
| Active Tunnels | com.dynatrace.extension.palo-alto.generic.tunnels.active | - | Count |
| Max Tunnels | com.dynatrace.extension.palo-alto.generic.tunnels.max | - | Count |
| Gateway Utilization % | com.dynatrace.extension.palo-alto.generic.gateway.utilization | - | Percent |
| Active Sessions | com.dynatrace.extension.palo-alto.generic.sessions.active | - | Count |
| Session utilization | com.dynatrace.extension.palo-alto.generic.sessions.utilization | Session table utilization percentage. | Percent |
| Max Sessions | com.dynatrace.extension.palo-alto.generic.sessions.max | - | Count |
| Sessions - TCP | com.dynatrace.extension.palo-alto.generic.sessions.tcp | - | Count |
| Sessions - UDP | com.dynatrace.extension.palo-alto.generic.sessions.udp | - | Count |
| Sessions - ICMP | com.dynatrace.extension.palo-alto.generic.sessions.icmp | - | Count |
| Sessions - SSL Proxy | com.dynatrace.extension.palo-alto.generic.sessions.proxy | - | Count |
| Session SSL proxy utilization | com.dynatrace.extension.palo-alto.generic.sessions.proxy.util | SSL proxy Session utilization percentage. panSessionSslProxyUtilization PAN-COMMON-MIB | Percent |
Decreased minEECVersion (ActiveGate) from 1.338.0 to 1.333.0.
snmp.ip field to EXT_NETWORK_DEVICE node extraction in OpenPipeline.1.338.0 and a minimum EEC (ActiveGate) version of 1.338.0.com.dynatrace.extension.network_device.* metrics for generic network topology.com.dynatrace.extension.palo-alto.generic.*) have been moved to other featuresets.ℹ️ This version requires ActiveGate version 1.313.0 or higher.
ℹ️ This version requires ActiveGate version 1.313.0 or higher.
sys.name and mac.address dimensions are required on all network metrics and filtered for empty values. This caused unnecessary stress on topology engine1.318Palo-Alto fan speedPalo-Alto temperature alertAdvanced interfaces feature set:
com.dynatrace.extension.network_device.if.in.multicast_pkts.countcom.dynatrace.extension.network_device.if.out.multicast_pkts.countcom.dynatrace.extension.network_device.if.in.broadcast_pkts.countcom.dynatrace.extension.network_device.if.out.broadcast_pkts.countcom.dynatrace.extension.network_device.if.in.ucast_pkts.countcom.dynatrace.extension.network_device.if.out.ucast_pkts.countcom.dynatrace.extension.network_device.if.lastchangeℹ️ This version requires ActiveGate version 1.313.0 or higher.
default feature set were regrouped into a new control-plane feature set:com.dynatrace.extension.palo-alto.generic.sys.uptimecom.dynatrace.extension.palo-alto.generic.cpu.management.utilizationcom.dynatrace.extension.palo-alto.generic.cpu.system.utilizationcom.dynatrace.extension.palo-alto.generic.mem.allocation.unitscom.dynatrace.extension.palo-alto.generic.mem.sizecom.dynatrace.extension.palo-alto.generic.mem.usedcom.dynatrace.extension.palo-alto.generic.mem.allocation.failures.count⚠️ WARNING: if you want to keep monitoring these metrics, you must manually toggle on the new feature set in the updated extension configuration.
if.in/out.err.count to if.in/out.errors.count.com.dynatrace.extension.palo-alto.generic.device.entity metric to align with our standards.⚠️ WARNING: you will have to manually change any dashboard, alert, or other dependent configuration that uses the old metric keys.
com.dynatrace.extension.palo-alto.generic.cpu.system.utilization metric.To align with other network extensions, the following metrics were added default feature set:
com.dynatrace.extension.network_device.if.bytes_in.countcom.dynatrace.extension.network_device.if.bytes_out.countcom.dynatrace.extension.network_device.if.in.err.countcom.dynatrace.extension.network_device.if.out.err.countcom.dynatrace.extension.network_device.if.in.discards.countcom.dynatrace.extension.network_device.if.out.discards.countcom.dynatrace.extension.network_device.if.statusThis means that interfaces will now be monitored as part of the default feature set. It is still possible to disable interface monitoring by using the filter $eq() in the Pattern to filter capturing of Interfaces by Name field of the monitoring configuration.
Added out-of-the-box Platform dashboard.
The dt.security_context property will now be propagated to all entities created by this extension.
ℹ️ This version requires ActiveGate version 1.313.0 or higher.
sw.version and chassis.type to the metric com.dynatrace.extension.palo-alto.generic.sys.release.dates.ℹ️ This version requires ActiveGate version 1.290.0 or higher.
ha.peerstate, app.version, threat.version, av.version, wf.version and urlfiltering.version to the metric com.dynatrace.extension.palo-alto.generic.sys.release.dates. These dimension values will now show as attributes of the Palo Alto Device entity.com.dynatrace.extension.network_device.sysuptime and com.dynatrace.extension.palo-alto.generic.sys.uptime now represent the time since the device was started (OID 1.3.6.1.2.1.25.1.1.0) as opposed to the time since the SNMP service was started (OID 1.3.6.1.2.1.1.3.0).ℹ️ This version requires ActiveGate version 1.290.0 or higher.
default feature set to interface.hardware to which the power consumption and sensor metrics were moved.
status dimension to the com.dynatrace.extension.palo-alto.generic.cpu.system.utilization and com.dynatrace.extension.palo-alto.generic.cpu.management.utilization metrics corresponding to OID 1.3.6.1.2.1.25.3.2.1.5.ℹ️ This version requires ActiveGate version 1.290.0 or higher.
com.dynatrace.extension.palo-alto.generic.power.available and com.dynatrace.extension.palo-alto.generic.power.used and corresponding charts as part of the general feature set.com.dynatrace.extension.palo-alto.generic.gateway.utilization, com.dynatrace.extension.palo-alto.generic.sessions.utilization, com.dynatrace.extension.palo-alto.generic.sessions.proxy as part of the gateway feature set.com.dynatrace.extension.palo-alto.generic.if.in.ucast.packets.count and com.dynatrace.extension.palo-alto.generic.if.out.ucast.packets.count and corresponding charts as part of the interface feature set.com.dynatrace.extension.palo-alto.generic.mem.allocation.units and com.dynatrace.extension.palo-alto.generic.mem.allocation.failures.count as part of the memory feature set.zone with metrics com.dynatrace.extension.palo-alto.generic.zone.active.tcp.cps, com.dynatrace.extension.palo-alto.generic.zone.active.udp.cps and com.dynatrace.extension.palo-alto.generic.zone.active.otherip.cps.device-logging with metrics com.dynatrace.extension.palo-alto.generic.pandeviceincominglograte and com.dynatrace.extension.palo-alto.generic.pandevicewritelograte.pan-sys with the metric com.dynatrace.extension.palo-alto.generic.sys.release.dates.1.3.6.1.2.1.31.1.1.1.15 instead of 1.3.6.1.2.1.2.2.1.5.Fixed bug where metrics weren't being picked up in management zones with Palo Alto entities.
Dropped support for 32-bit counter octet in/out interface metrics. Only 64-bit counters are now supported. Only devices with Firewall PAN-OS version earlier than 8.1 will be affected.
The interface_high_capacity feature set was dropped as those metrics are now in the interface feature set. Before being able to upgrade your monitoring configurations you will need to manually disable the interface-high-capacity on those configurations (if enabled).
The following metrics of the interface_high_capacity feature set are renamed
com.dynatrace.extension.palo-alto.generic.if.in.octets to com.dynatrace.extension.palo-alto.generic.if.hc.in.octetscom.dynatrace.extension.palo-alto.generic.if.out.octets to com.dynatrace.extension.palo-alto.generic.if.hc.out.octetscom.dynatrace.extension.palo-alto.generic.if.in.err to com.dynatrace.extension.palo-alto.generic.if.hc.in.errcom.dynatrace.extension.palo-alto.generic.if.out.err to com.dynatrace.extension.palo-alto.generic.if.hc.out.errcom.dynatrace.extension.palo-alto.generic.if.in.discards to com.dynatrace.extension.palo-alto.generic.if.hc.in.discardscom.dynatrace.extension.palo-alto.generic.if.out.discards to com.dynatrace.extension.palo-alto.generic.if.hc.out.discardsAny dashboards or metric events relying on these metrics will need to be reconfigured.
Customers not using the interface_high_capacity feature set are not affected.
Renamed high capacity interface metrics, to fix a bug where having both the interface and interface_high_capacity feature sets enabled at the same time would cause inaccurate metrics to be ingested.
No release notes
No release notes
Fix for dashboard to be compatible with feature flags
Substract of suffix ".count" in metric com.dynatrace.extension.palo-alto.generic.sys.uptime and changed it type to gauge
New calculated metrics:
Corrected oid for dimension: if.keyx
New dimension if.descr for subgroup interface
Added topology, relationships and screens
Version 0.1.15 (initial):