




































































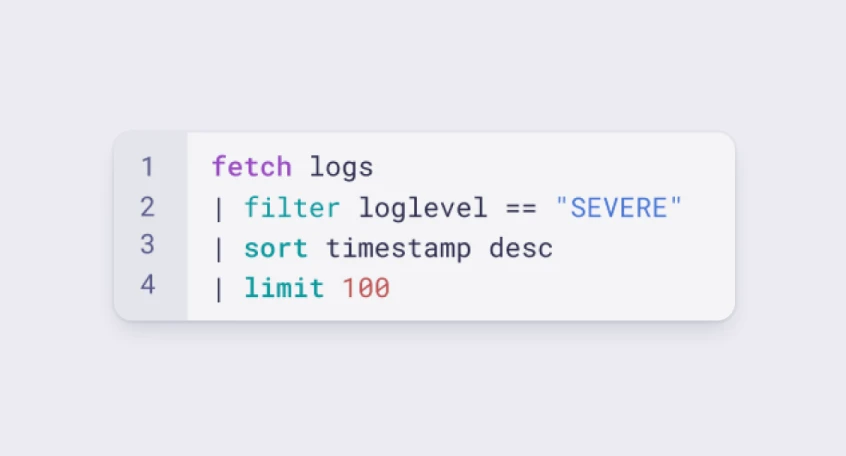
Learn the Dynatrace Query Language
Explore data, discover patterns, anomalies and outliers, and create statistical modeling with DQL, our powerful query language..
Learn DQL
 PostgreSQL
Monitor your Postgres performance via our new EF2.0 extension framework.
ExtensionOur PostgreSQL database monitoring is based on a remote monitoring approach implemented as a Dynatrace ActiveGate SQL extension. The extension queries databases for key performance and health metrics, extending your visibility, and allowing Dynatrace Intelligence to provide anomaly detection and problem analysis.
For more information on the installation and configuration, please see PostgreSQL extension in the Dynatrace Documentation.
Compatible with all currently maintained Postgres versions.
The extension is designed to work with PostgreSQL version 11 and later.
Below is a complete list of the feature sets provided in this version. To ensure a good fit for your needs, individual feature sets can be activated and deactivated by your administrator during configuration.
| Metric name | Metric key | Description | Unit |
|---|---|---|---|
| Instance uptime | postgres.uptime | Time since the instance has been started | Second |
| Metric name | Metric key | Description | Unit |
|---|---|---|---|
| Latest transaction XID age | postgres.xid_age | Difference between the current transaction's XID and datfrozenxid. If this value exceeds 2^31, this can cause a database crash due to transaction ID wraparound. | Count |
| Number of backends | postgres.numbackends | Number of backends currently connected to this database | Count |
| Committed transactions | postgres.xact_commit.count | Number of transactions in this database that have been committed | Count |
| Rolled back transactions | postgres.xact_rollback.count | Number of transactions in this database that have been rolled back | Count |
| Block read from disk | postgres.blks_read.count | Number of disk blocks read in this database | Count |
| Blocks found in buffer cache | postgres.blks_hit.count | Number of times disk blocks were found already in the buffer cache, so that a read was not necessary | Count |
| Live rows returned | postgres.tup_returned.count | Number of live rows fetched by sequential scans and index entries returned by index scans in this database | Count |
| Live rows fetched by index scans | postgres.tup_fetched.count | Number of live rows fetched by index scans in this database | Count |
| Rows inserted | postgres.tup_inserted.count | Number of rows inserted by queries in this database | Count |
| Rows updated | postgres.tup_updated.count | Number of rows updated by queries in this database | Count |
| Rows deleted | postgres.tup_deleted.count | Number of rows deleted by queries in this database | Count |
| Queries canceled due to conflict | postgres.conflicts.count | Number of queries canceled due to conflicts with recovery in this database | Count |
| Temporary files created | postgres.temp_files.count | Number of temporary files created by queries in this database | Count |
| Data written to temporary files | postgres.temp_bytes.count | Total amount of data written to temporary files by queries in this database | Byte |
| Deadlocks | postgres.deadlocks.count | Number of deadlocks detected in this database | Count |
| Data file blocks reading time | postgres.blk_read_time.count | Time spent reading data file blocks by backends in this database | MilliSecond |
| Data file blocks writing time | postgres.blk_write_time.count | Time spent writing data file blocks by backends in this database | MilliSecond |
| Database Size | postgres.db_size | Size of the database in bytes | Byte |
| Time spent by sessions | postgres.session_time.count | Time spent by database sessions in this database | MilliSecond |
| Time spent executing SQL statements | postgres.active_time.count | Time spent executing SQL statements in this database | MilliSecond |
| Time spent idling | postgres.idle_in_transaction_time.count | Time spent idling while in a transaction in this database | MilliSecond |
| Data page checksum failures | postgres.checksum_failures.count | Number of data page checksum failures detected in this database. Only available if data checksums are enabled. | Count |
| Established sessions | postgres.sessions.count | Total number of sessions established | Count |
| Abandoned sessions | postgres.sessions_abandoned.count | Number of database sessions to this database that were terminated because connection to the client was lost | Count |
| Fatal error terminated sessions | postgres.sessions_fatal.count | Number of database sessions to this database that were terminated by fatal errors | Count |
| Killed sessions | postgres.sessions_killed.count | Number of database sessions to this database that were terminated by operator intervention | Count |
| Metric name | Metric key | Description | Unit |
|---|---|---|---|
| Subscription stats - apply error | postgres.subscription_stats.apply_error.count | Number of times an error occurred while applying changes, as reported by pg_stat_subscription_stats. | Count |
| Subscription stats - sync error | postgres.subscription_stats.sync_error.count | Number of times an error occurred during the initial table synchronization, as reported by pg_stat_subscription_stats. | Count |
| Subscription stats conflict - insert exists | postgres.subscription_stats.confl_insert_exists.count | Number of times a row insertion violated a NOT DEFERRABLE unique constraint during the application of changes, as reported by pg_stat_subscription_stats. | Count |
| Subscription stats conflict - update origin differs | postgres.subscription_stats.confl_update_origin_differs.count | Number of times an update operation was applied to a row that had been previously modified by another source during the application of changes, as reported by pg_stat_subscription_stats. | Count |
| Subscription stats conflict - update exists | postgres.subscription_stats.confl_update_exists.count | Number of times that an updated row value violated a NOT DEFERRABLE unique constraint during the application of changes, as reported by pg_stat_subscription_stats. | Count |
| Subscription stats conflict - update missing | postgres.subscription_stats.confl_update_missing.count | Number of times the tuple to be updated was not found during the application of changes, as reported by pg_stat_subscription_stats. | Count |
| Subscription stats conflict - delete origin differs | postgres.subscription_stats.confl_delete_origin_differs.count | Number of times a delete operation was applied to row that had been previously modified by another source during the application of changes, as reported by pg_stat_subscription_stats. | Count |
| Subscription stats conflict - missing delete | postgres.subscription_stats.confl_delete_missing.count | Number of times the tuple to be deleted was not found during the application of changes, as reported by pg_stat_subscription_stats. | Count |
| Subscription stats conflict - multiple unique conflicts | postgres.subscription_stats.confl_multiple_unique_conflicts.count | Number of times a row insertion or an updated row values violated multiple NOT DEFERRABLE unique constraints during the application of changes, as reported by pg_stat_subscription_stats. | Count |
| Metric name | Metric key | Description | Unit |
|---|---|---|---|
| Active backend processes | postgres.activity.active | Number of server processes executing a query | Count |
| Active waiting backend processes | postgres.activity.active_waiting | Number of server processes actively waiting | Count |
| Idle backend processes | postgres.activity.idle | Number of server processes waiting for a new client command | Count |
| Idle in transaction backends processes | postgres.activity.idle_in_transaction | Number of server processes in transaction not currently executing a query | Count |
| Idle in transaction aborted backends processes | postgres.activity.idle_in_transaction_aborted | Number of server processes in transaction not currently executing a query where one of the statements caused an error | Count |
| Fast-path function backend processes | postgres.activity.fastpath_function_call | Number of server processes executing a fast-path function call | Count |
| Metric name | Metric key | Description | Unit |
|---|---|---|---|
| WAL files size | postgres.wal_files_size | Total size of all WAL files in the WAL directory | Byte |
| WAL files count | postgres.wal_files | Total number of WAL files in the WAL directory | Count |
| WAL files age | postgres.wal_files_age | Time elapsed since the oldest WAL file was modified | Second |
| WAL write | postgres.wal_write.count | Number of times WAL buffers were written out to disk via XLogWrite request | Count |
| WAL sync | postgres.wal_sync.count | Number of times WAL files were synced to disk via issue_xlog_fsync request | Count |
| WAL write time | postgres.wal_write_time.count | Total amount of time spent writing WAL buffers to disk via XLogWrite request, in milliseconds | MilliSecond |
| WAL sync time | postgres.wal_sync_time.count | Total amount of time spent syncing WAL files to disk via issue_xlog_fsync request, in milliseconds | MilliSecond |
| WAL diff size | postgres.wal_diff_size | Size of difference between current WAL and last WAL replay | Byte |
| WAL records per minute | postgres.wal_records.count | Number of WAL records generated per minute | Count |
| WAL fpi per minute | postgres.wal_fpi.count | Number of WAL full page images generated per minute | Count |
| WAL bytes | postgres.wal_bytes.count | Total amount of WAL generated in bytes | Count |
| WAL buffers full | postgres.wal_buffers_full.count | Number of times WAL data was written to disk because WAL buffers became full | Count |
| Metric name | Metric key | Description | Unit |
|---|---|---|---|
| Index size | postgres.indexes.index_size | Disk space used by the index, as reported by pg_relation_size(). | Byte |
| Index scans | postgres.indexes.scans.count | Number of index scans initiated on this index as reported by pg_stat_user_indexes (idx_scan). | Count |
| Index tuples read | postgres.indexes.tuples_read.count | Number of index entries returned by scans on this index as reported by pg_stat_user_indexes (idx_tup_read). | Count |
| Index tuples fetched | postgres.indexes.tuples_fetched.count | Number of live table rows fetched by simple index scans using this index as reported by pg_stat_user_indexes (idx_tup_fetch). | Count |
| Index disk block reads | postgres.indexes.index_disk_reads.count | Number of disk blocks read from this index as reported by pg_statio_user_indexes (idx_blks_read). | Count |
| Index buffer hits | postgres.indexes.index_buffer_hits.count | Number of buffer hits for this index as reported by pg_statio_user_indexes (idx_blks_hit). | Count |
| Estimated row count | postgres.tables.rows | Estimated number of live rows in the table as reported by pg_stat_user_tables (n_live_tup). | Count |
| Dead rows | postgres.tables.dead_rows | Estimated number of dead rows in the table as reported by pg_stat_user_tables (n_dead_tup). | Count |
| Rows modified since analyze | postgres.tables.rows_modified_since_analyze | Estimated number of rows modified since this table was last analyzed as reported by pg_stat_user_tables (n_mod_since_analyze). | Count |
| Rows inserted since vacuum | postgres.tables.rows_inserted_since_vacuum | Estimated number of rows inserted since this table was last vacuumed as reported by pg_stat_user_tables (n_ins_since_vacuum). | Count |
| Total table size | postgres.tables.total_size | Total disk space used by the table, including indexes and TOAST data, as returned by pg_total_relation_size(). | Byte |
| Table size | postgres.tables.table_size | Disk space used by the main fork of the table, as returned by pg_relation_size(). | Byte |
| TOAST size | postgres.tables.toast_size | Disk space used by the TOAST table associated with this table, as returned by pg_relation_size(). | Byte |
| Indexes size | postgres.tables.indexes_size | Total disk space used by all indexes on the table, as returned by pg_indexes_size(). | Byte |
| Sequential scans | postgres.tables.sequential_scans.count | Number of sequential scans initiated on this table as reported by pg_stat_user_tables (seq_scan). | Count |
| Index scans | postgres.tables.index_scans.count | Number of index scans initiated on this table as reported by pg_stat_user_tables (idx_scan). | Count |
| Rows read by sequential scans | postgres.tables.rows_read_seq.count | Number of live rows fetched by sequential scans as reported by pg_stat_user_tables (seq_tup_read). | Count |
| Rows read by index scans | postgres.tables.rows_read_idx.count | Number of live rows fetched by index scans as reported by pg_stat_user_tables (idx_tup_fetch). | Count |
| Rows inserted | postgres.tables.rows_inserted.count | Number of rows inserted into this table as reported by pg_stat_user_tables (n_tup_ins). | Count |
| Rows updated | postgres.tables.rows_updated.count | Number of rows updated in this table as reported by pg_stat_user_tables (n_tup_upd). | Count |
| Rows deleted | postgres.tables.rows_deleted.count | Number of rows deleted from this table as reported by pg_stat_user_tables (n_tup_del). | Count |
| HOT updates | postgres.tables.hot_updates.count | Number of rows HOT updated in this table, where no separate index update was needed, as reported by pg_stat_user_tables (n_tup_hot_upd). | Count |
| Table disk block reads | postgres.tables.table_disk_reads.count | Number of disk blocks read from this table as reported by pg_statio_user_tables (heap_blks_read). | Count |
| Table buffer hits | postgres.tables.table_buffer_hits.count | Number of buffer hits for this table as reported by pg_statio_user_tables (heap_blks_hit). | Count |
| Index disk block reads | postgres.tables.index_disk_reads.count | Number of disk blocks read from all indexes on this table as reported by pg_statio_user_tables (idx_blks_read). | Count |
| Index buffer hits | postgres.tables.index_buffer_hits.count | Number of buffer hits for all indexes on this table as reported by pg_statio_user_tables (idx_blks_hit). | Count |
| TOAST disk block reads | postgres.tables.toast_disk_reads.count | Number of disk blocks read from this table's TOAST table as reported by pg_statio_user_tables (toast_blks_read). | Count |
| TOAST buffer hits | postgres.tables.toast_buffer_hits.count | Number of buffer hits for this table's TOAST table as reported by pg_statio_user_tables (toast_blks_hit). | Count |
| TOAST index disk block reads | postgres.tables.toast_index_disk_reads.count | Number of disk blocks read from this table's TOAST table indexes as reported by pg_statio_user_tables (tidx_blks_read). | Count |
| TOAST index buffer hits | postgres.tables.toast_index_buffer_hits.count | Number of buffer hits for this table's TOAST table indexes as reported by pg_statio_user_tables (tidx_blks_hit). | Count |
| Manual vacuums | postgres.tables.vacuum.count | Number of times this table has been manually vacuumed (not counting VACUUM FULL) as reported by pg_stat_user_tables (vacuum_count). | Count |
| Autovacuums | postgres.tables.autovacuum.count | Number of times this table has been vacuumed by the autovacuum daemon as reported by pg_stat_user_tables (autovacuum_count). | Count |
| Manual analyzes | postgres.tables.analyze.count | Number of times this table has been manually analyzed as reported by pg_stat_user_tables (analyze_count). | Count |
| Autoanalyzes | postgres.tables.autoanalyze.count | Number of times this table has been analyzed by the autovacuum daemon as reported by pg_stat_user_tables (autoanalyze_count). | Count |
| Metric name | Metric key | Description | Unit |
|---|---|---|---|
| SLRU blocks zeroed | postgres.slru.blks_zeroed.count | Number of blocks zeroed during initializations, as reported by pg_stat_slru. | Count |
| SLRU blocks hit | postgres.slru.blks_hit.count | Number of times disk blocks were found already in the SLRU cache, so that a read was not necessary, as reported by pg_stat_slru. | Count |
| SLRU blocks read | postgres.slru.blks_read.count | Number of disk blocks read, as reported by pg_stat_slru. | Count |
| SLRU blocks written | postgres.slru.blks_written.count | Number of disk blocks written, as reported by pg_stat_slru. | Count |
| SLRU blocks exists | postgres.slru.blks_exists.count | Number of blocks checked for existence, as reported by pg_stat_slru. | Count |
| SLRU flushes | postgres.slru.flushes.count | Number of SLRU flushes of dirty data, as reported by pg_stat_slru. | Count |
| SLRU truncates | postgres.slru.truncates.count | Number of SLRU truncates, as reported by pg_stat_slru. | Count |
| Metric name | Metric key | Description | Unit |
|---|---|---|---|
| Tablespace size | postgres.tablespace.size | Tablespace size in bytes | Byte |
| Metric name | Metric key | Description | Unit |
|---|---|---|---|
| Buffers written by background writer | postgres.buffers_clean.count | Number of buffers written by the background writer | Count |
| Cleaning scan stops | postgres.maxwritten_clean.count | Number of times the background writer stopped a cleaning scan because it had written too many buffers | Count |
| Buffers allocated | postgres.buffers_alloc.count | Number of buffers allocated | Count |
| Scheduled checkpoints performed | postgres.checkpoints_timed.count | Number of scheduled checkpoints that have been performed | Count |
| Requested checkpoints performed | postgres.checkpoints_req.count | Number of requested checkpoints that have been performed | Count |
| Checkpoints write time | postgres.checkpoint_write_time.count | Total amount of time that has been spent in the portion of checkpoint processing where files are written to disk | MilliSecond |
| Checkpoint sync time | postgres.checkpoint_sync_time.count | Total amount of time that has been spent in the portion of checkpoint processing where files are synchronized to disk | MilliSecond |
| Buffers written during checkpoints | postgres.buffers_checkpoint.count | Number of buffers written during checkpoints | Count |
| Buffers written by backend | postgres.buffers_backend.count | Number of buffers written directly by a backend | Count |
| Backend fsync executions | postgres.buffers_backend_fsync.count | Number of times a backend had to execute its own fsync call | Count |
| Metric name | Metric key | Description | Unit |
|---|---|---|---|
| Replication WAL restart delay | postgres.replication.restart_delay | Difference between current WAL LSN and the restart_lsn as reported by pg_replication_slots. | Byte |
| Replication WAL confirmed flush lag | postgres.replication.confirmed_flush_lag | Difference between current WAL LSN and the confirmed_flush_lsn as reported by pg_replication_slots. | Byte |
| Replication slot transaction age | postgres.replication.slot_xmin_age | Age of the oldest transaction that this logical replication slot needs the database to retain, as reported by pg_replication_slots. | Byte |
| Database conflicts tablespace | postgres.database_conflicts.tablespace.count | Number of queries in this database that have been canceled due to dropped tablespaces, as reported by pg_stat_database_conflicts. Standby only. | Count |
| Database conflicts lock | postgres.database_conflicts.lock.count | Number of queries in this database that have been canceled due to lock timeouts, as reported by pg_stat_database_conflicts. Standby only. | Count |
| Database conflicts snapshot | postgres.database_conflicts.snapshot.count | Number of queries in this database that have been canceled due to old snapshots, as reported by pg_stat_database_conflicts. Standby only. | Count |
| Database conflicts buffer pin | postgres.database_conflicts.bufferpin.count | Number of queries in this database that have been canceled due to pinned buffers, as reported by pg_stat_database_conflicts. Standby only. | Count |
| Database conflicts deadlock | postgres.database_conflicts.deadlock.count | Number of queries in this database that have been canceled due to deadlocks, as reported by pg_stat_database_conflicts. Standby only. | Count |
| Replication WAL write lag | postgres.replication.write_lag | Time elapsed between flushing recent WAL locally and receiving notification that this standby server has written it, as reported by pg_stat_replication. | Second |
| Replication WAL flush lag | postgres.replication.flush_lag | Time elapsed between flushing recent WAL locally and receiving notification that this standby server has written and flushed it, as reported by pg_stat_replication. | Second |
| Replication WAL replay lag | postgres.replication.replay_lag | Time elapsed between flushing recent WAL locally and receiving notification that this standby server has written, flushed and applied it, as reported by pg_stat_replication. | Second |
| Replication backend transaction age | postgres.replication.backend_xmin_age | Age of the backend's xmin horizon, as reported by pg_stat_replication. | Count |
| Replication replay delay | postgres.replication.replay_delay | Difference in bytes between the current WAL position and the last WAL position replayed on the standby server, as reported by pg_stat_replication. | Byte |
| WAL receiver received timeline ID | postgres.wal_receiver.received_tli | Timeline number of the last WAL received and flushed to disk, as reported by pg_stat_wal_receiver. Standby only. | Count |
| WAL receiver last message send age | postgres.wal_receiver.last_msg_send_age | Time elapsed since last message sent to origin WAL sender, as reported by pg_stat_wal_receiver. Standby only. | Second |
| WAL receiver last message receipt age | postgres.wal_receiver.last_msg_receipt_age | Time elapsed since last message received from origin WAL sender, as reported by pg_stat_wal_receiver. Standby only. | Second |
| WAL receiver latest end age | postgres.wal_receiver.latest_end_age | Time elapsed since last write-ahead log location reported to origin WAL sender, as reported by pg_stat_wal_receiver. Standby only. | Second |
| Metric name | Metric key | Description | Unit |
|---|---|---|---|
| Instance recovery mode | postgres.recovery.state | Indicate that the instance is in recovery mode. 1 if in recovery, 0 otherwise. | State |
| Metric name | Metric key | Description | Unit |
|---|---|---|---|
| User function calls | postgres.user_functions.calls.count | Number of times this function has been called, as reported by pg_stat_user_functions. | Count |
| User functions total time | postgres.user_functions.total_time.count | Total time spent in this function and all other functions called by it, as reported by pg_stat_user_functions. | Millisecond |
| User functions self time | postgres.user_functions.self_time.count | Total time spent in this function itself, not including other functions called by it, as reported by pg_stat_user_functions. | Millisecond |
| Metric name | Metric key | Description | Unit |
|---|---|---|---|
| I/O reads | postgres.io.reads.count | Number of read operations as reported by pg_stat_io. | Count |
| I/O read time | postgres.io.read_time.count | Time spent waiting for read operations as reported by pg_stat_io. | MilliSecond |
| I/O writes | postgres.io.writes.count | Number of write operations as reported by pg_stat_io. | Count |
| I/O write time | postgres.io.write_time.count | Time spent waiting for write operations as reported by pg_stat_io. | MilliSecond |
| I/O writebacks | postgres.io.writebacks.count | Number of units of size BLCKSZ (typically 8kB) which the process requested the kernel write out to permanent storage as reported by pg_stat_io. | Count |
| I/O writeback time | postgres.io.writeback_time.count | Time spent waiting for writeback operations as reported by pg_stat_io. | MilliSecond |
| I/O extends | postgres.io.extends.count | Number of relation extend operations as reported by pg_stat_io. | Count |
| I/O extend time | postgres.io.extend_time.count | Time spent waiting for extend operations as reported by pg_stat_io. | MilliSecond |
| I/O hits | postgres.io.hits.count | The number of times a desired block was found in a shared buffer as reported by pg_stat_io. | Count |
| I/O evictions | postgres.io.evictions.count | Number of times a block has been written out from a shared or local buffer in order to make it available for another use as reported by pg_stat_io. | Count |
| I/O reuses | postgres.io.reuses.count | The number of times an existing buffer in a size-limited ring buffer outside of shared buffers was reused as part of an I/O operation as reported by pg_stat_io. | Count |
| I/O fsyncs | postgres.io.fsyncs.count | Number of fsync calls as reported by pg_stat_io. | Count |
| I/O fsync time | postgres.io.fsync_time.count | Time spent waiting for fsync operations as reported by pg_stat_io. | MilliSecond |
| I/O read bytes | postgres.io.read_bytes.count | The total size of read operations as reported by pg_stat_io. | Byte |
| I/O write bytes | postgres.io.write_bytes.count | The total size of write operations as reported by pg_stat_io. | Byte |
| I/O extend bytes | postgres.io.extend_bytes.count | The total size of relation extend operations as reported by pg_stat_io. | Byte |
| Metric name | Metric key | Description | Unit |
|---|---|---|---|
| Number of locks | postgres.locks | Number of locks as reported by pg_locks | Count |
Improvements
⚠️ This version requires ActiveGate version 1.339.0 or higher.
Breaking changes:
⚠️ Possible breaking changes and warnings - PLEASE READ before upgrading to this version ⚠️:
tables feature set introduced with this version is disabled by default and may cause high license consumption if enabled.Features:
postgres.tables.*, postgres.indexes.*.pg_stat_activity.Improvements:
⚠️ This version requires ActiveGate version 1.337.0 or higher.
Bugfixes
2.9.7 , regarding metric description & graphs for postgres.xid_age, to use 2^31 instead of 2^32 for the wraparound value.Enhancements
Bugfixes
Features
SLRU feature set with the following metrics:
postgres.slru.blks_zeroed.countpostgres.slru.blks_hit.countpostgres.slru.blks_read.countpostgres.slru.blks_written.countpostgres.slru.blks_exists.countpostgres.slru.flushes.countpostgres.slru.truncates.countIO feature set with the following metrics (PG16+):
postgres.io.reads.countpostgres.io.read_time.countpostgres.io.writes.countpostgres.io.write_time.count postgres.io.writebacks.countpostgres.io.writeback_time.countpostgres.io.extends.countpostgres.io.extend_time.count postgres.io.hits.count postgres.io.evictions.countpostgres.io.reuses.countpostgres.io.fsyncs.countpostgres.io.fsync_time.countpostgres.io.read_bytes.countpostgres.io.write_bytes.countpostgres.io.extend_bytes.countUser Functions feature set with the following metrics:
postgres.user_functions.calls.countpostgres.user_functions.total_time.countpostgres.user_functions.self_time.countSubscription feature set with the following metrics:
postgres.subscription_stats.apply_error.countpostgres.subscription_stats.sync_error.countpostgres.subscription_stats.confl_insert_exists.countpostgres.subscription_stats.confl_update_origin_differs.countpostgres.subscription_stats.confl_update_exists.countpostgres.subscription_stats.confl_update_missing.countpostgres.subscription_stats.confl_delete_origin_differs.countpostgres.subscription_stats.confl_delete_missing.countpostgres.subscription_stats.confl_multiple_unique_conflicts.countReplication feature set:
postgres.replication.backend_xmin_agepostgres.replication.slot_xmin_agepostgres.replication.replay_delaypostgres.wal_receiver.last_msg_send_agepostgres.wal_receiver.last_msg_receipt_agepostgres.wal_receiver.latest_end_agepostgres.database_conflicts.tablespace.countpostgres.database_conflicts.lock.countpostgres.database_conflicts.snapshot.countpostgres.database_conflicts.bufferpin.countpostgres.database_conflicts.deadlock.countWAL feature set:
postgres.wal_files_sizepostgres.wal_filespostgres.wal_files_ageActivity feature set:
postgres.activity.active_waitingFeatures
Bugfixes
Features
Bugfixes
Bugfixes
Features
Bugfixes
Features
Configuration query interval (minutes) variable. This data will be available soon in the Databases App.Replication which collects replication lag metrics, postgres.replication.*.Locks which collects lock related metrics as well as information about blocking statements in the form of logs.postgres.db_size.postgres.xid_age.Enhancements
pg_stat_activity data to obtain wait event times.ℹ️ This version requires ActiveGate version 1.301.0 or higher.
Features:
SAME_AS relationship will be established between the sql:postgres_instance and the corresponding PROCESS_GROUP_INSTANCE.ℹ️ This version requires ActiveGate version 1.301.0 or higher.
Bug fixes:
ℹ️ This version requires ActiveGate version 1.301.0 or higher.
Bug fixes:
heavy-query-interval variable's default value would not be set correctly.Bug fixes:
Features:
query-interval and heavy-query-interval, which control the frequency with which the Dynatrace queries the database/ingests data. Please see the FAQ section for more details.Bugfixes:
ℹ️ This version requires ActiveGate version 1.293.0 or higher.
Improvements
ALTER statements for security reasons.Bugfixes:
ℹ️ This version requires ActiveGate version 1.293.0 or higher.
WARNING This extension requires minimum ActiveGate version 1.293. Please check your version before upgrading.
Bugfixes:
pg_stat_statements for PostgreSQL 13.WARNING This extension requires minimum ActiveGate version 1.293. Please check your version before upgrading.
Features:
Getting started section on the hub tile for more details on how to set it up.Bug fixes:
Query duration as collected by longest_queries is now calculated as clock_timestamp() - query_start. Previously it was computed as now() - query_start which sometimes caused the query duration to be negative.
The reason behind this is that now() or CURRENT_TIMESTAMP represent the start of the transaction and an individual query within the transaction can start later. The clock_timestamp() however returns an actual system cpu clock and can change over the course of the transaction, producing a correct value to subtract query_start from to compute a valid duration.
Bug fixes:
postgres.blk_hit.count metric key to postgres.blks_hit.count to match official Postgres statistics collector name.Features:
endpoint_metadata attribute of sql:postgres_instance entities and can be used in entity selectors (to facilitate tagging, for example).Queries feature set will now collect queries (ingested as logs) from the pg_stat_statements table as well. These new logs can be queried by filtering by event_group = top_queries. Note that for this to work, the pg_stat_statements table needs to be enabled at the database level as per the official docs.Improvements:
pg_stat_activity is now collected for all activities, not just the ones associated with a specific datid. That adds monitoring for activites such as autovacuum worker.Improvements:
Bug fixes:
client_port dimension was removed from the following metrics, because the field bring no valuable information and is too volatile, causing too many distinct timeseries to be generated.
postgres.activity.activepostgres.activity.fastpath_function_callpostgres.activity.idle_in_transaction_abortedpostgres.activity.idle_in_transactionpostgres.activity.idleBreaking changes: Existing monitoring configurations must be recreated through API or manually
New features:
Bug fixes:
Fix for schema change
No release notes