






































































Learn the Dynatrace Query Language
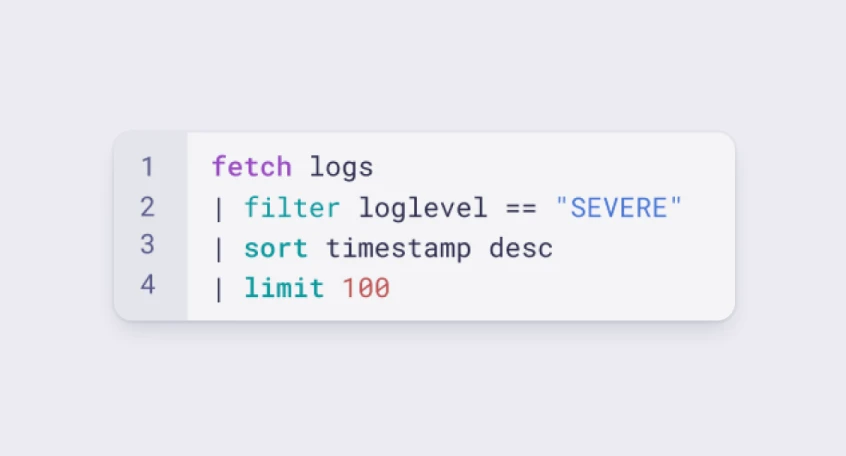
Explore data, discover patterns, anomalies and outliers, and create statistical modeling with DQL, our powerful query language..
Learn DQL
 Remote Windows Host Monitoring
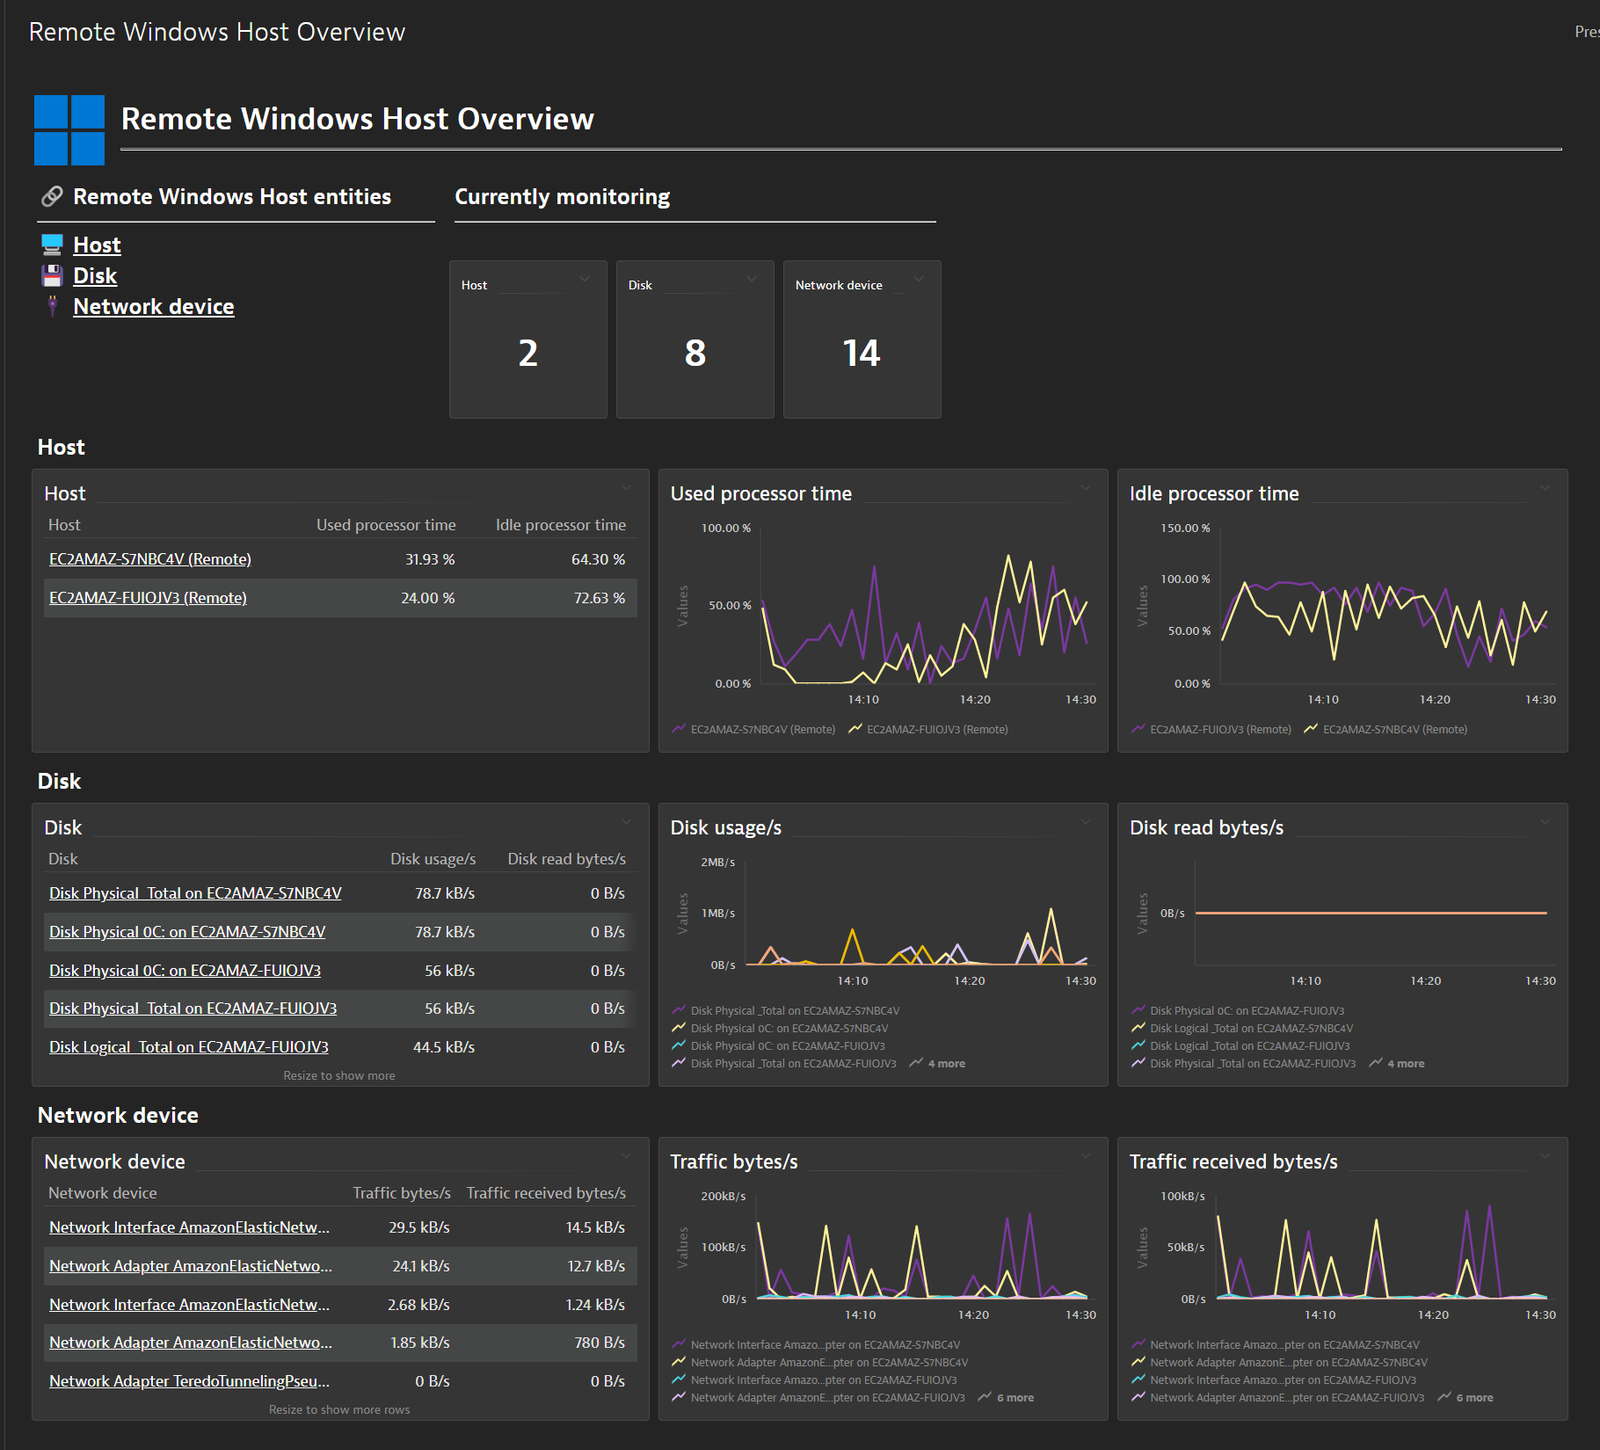
Monitor health and performance of Windows Hosts without installing an agent.
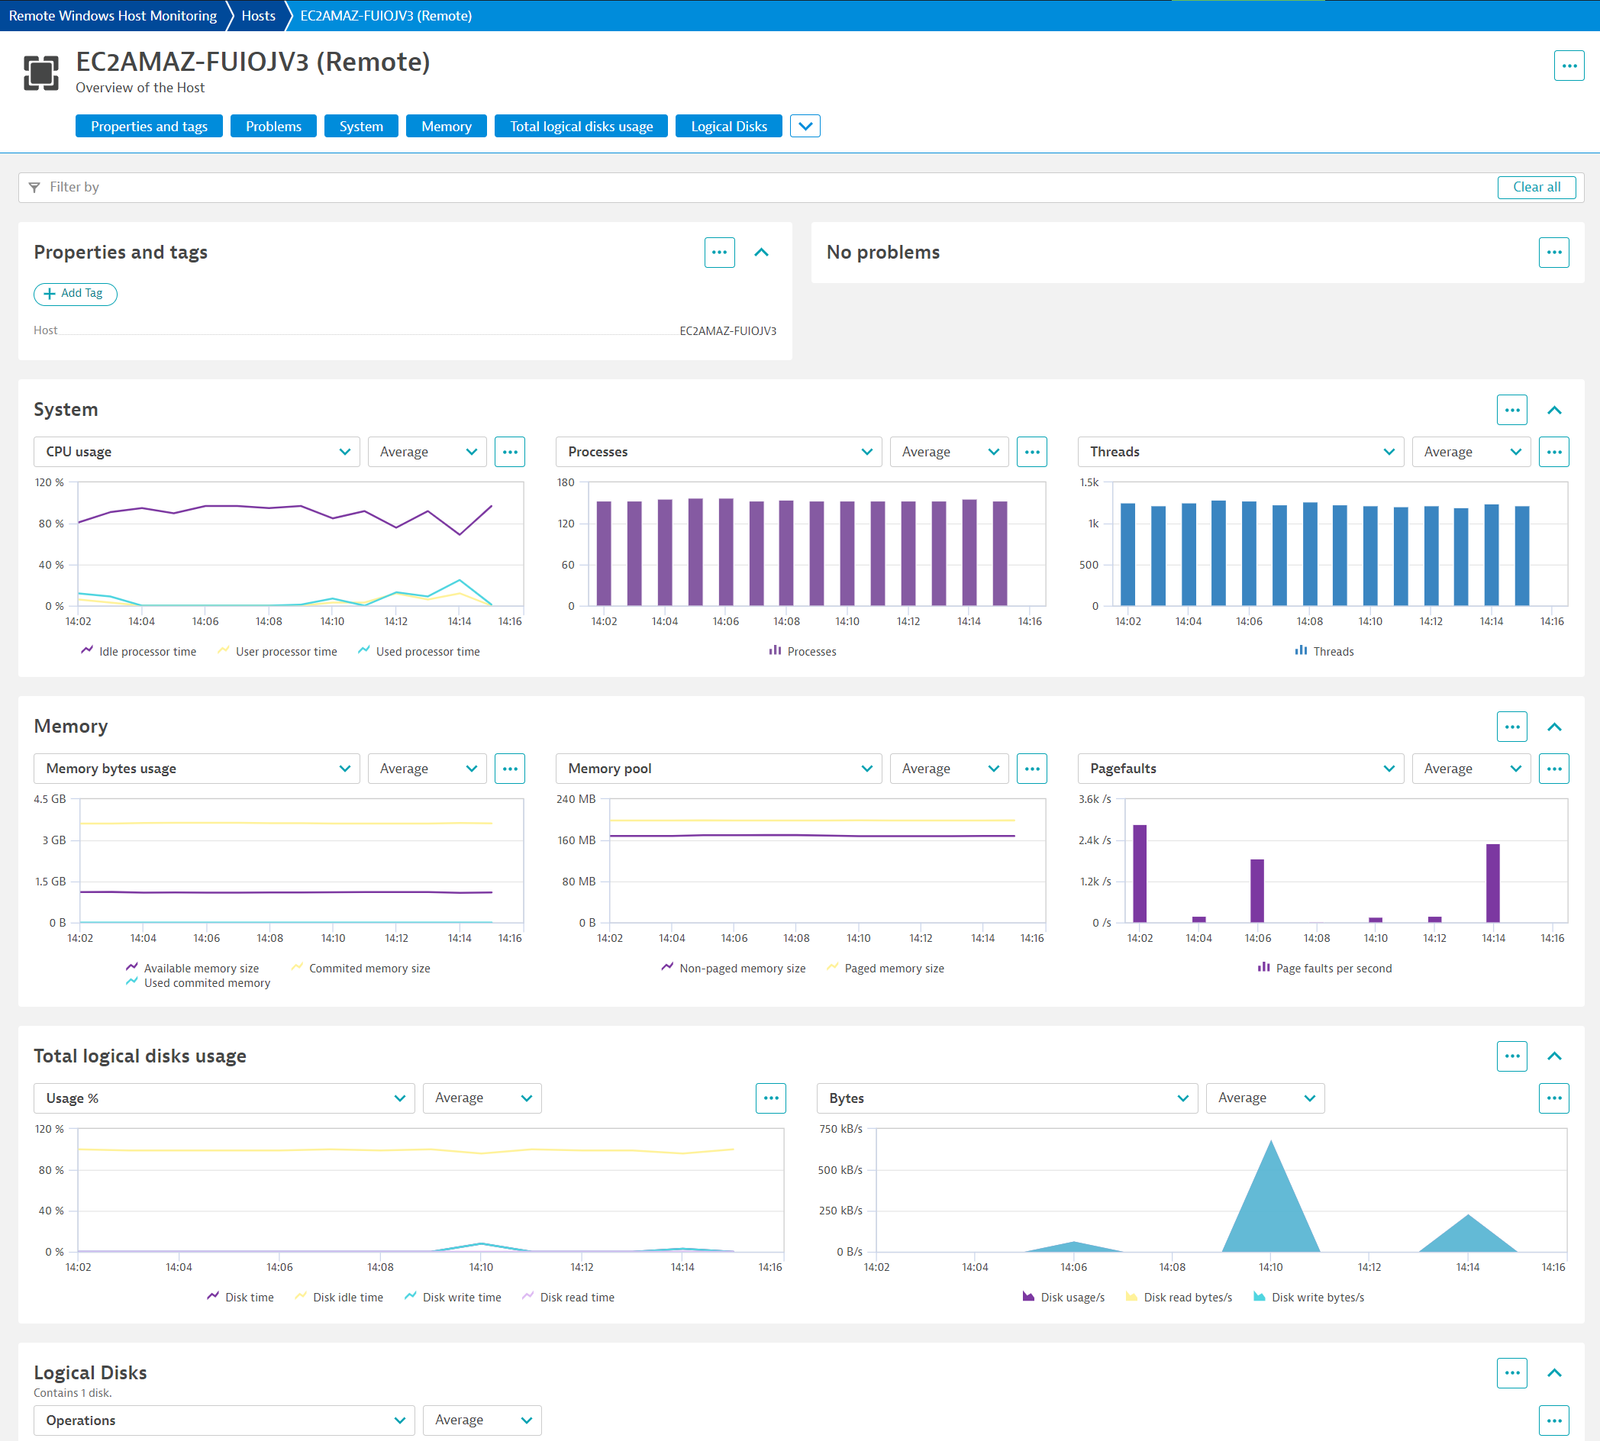
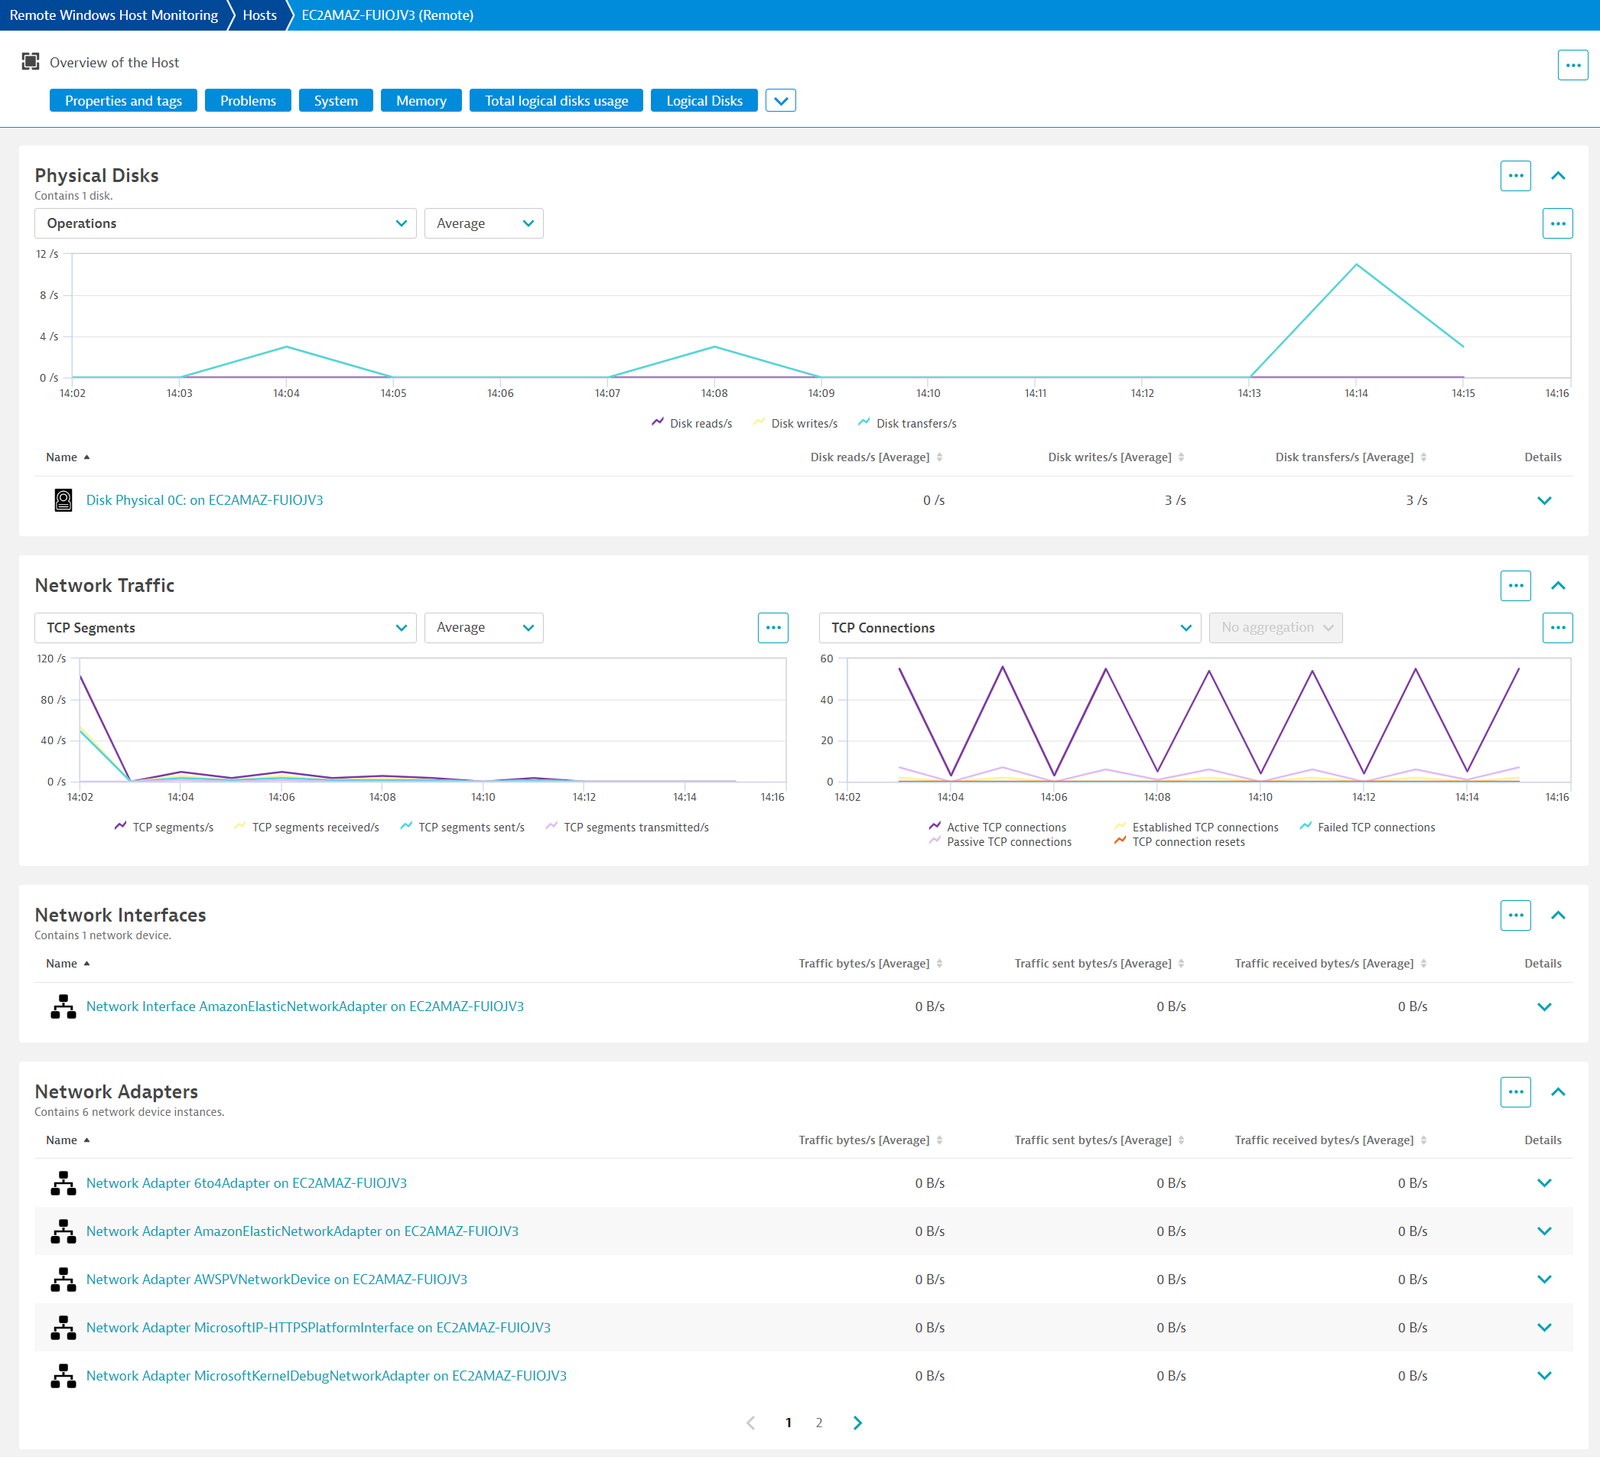
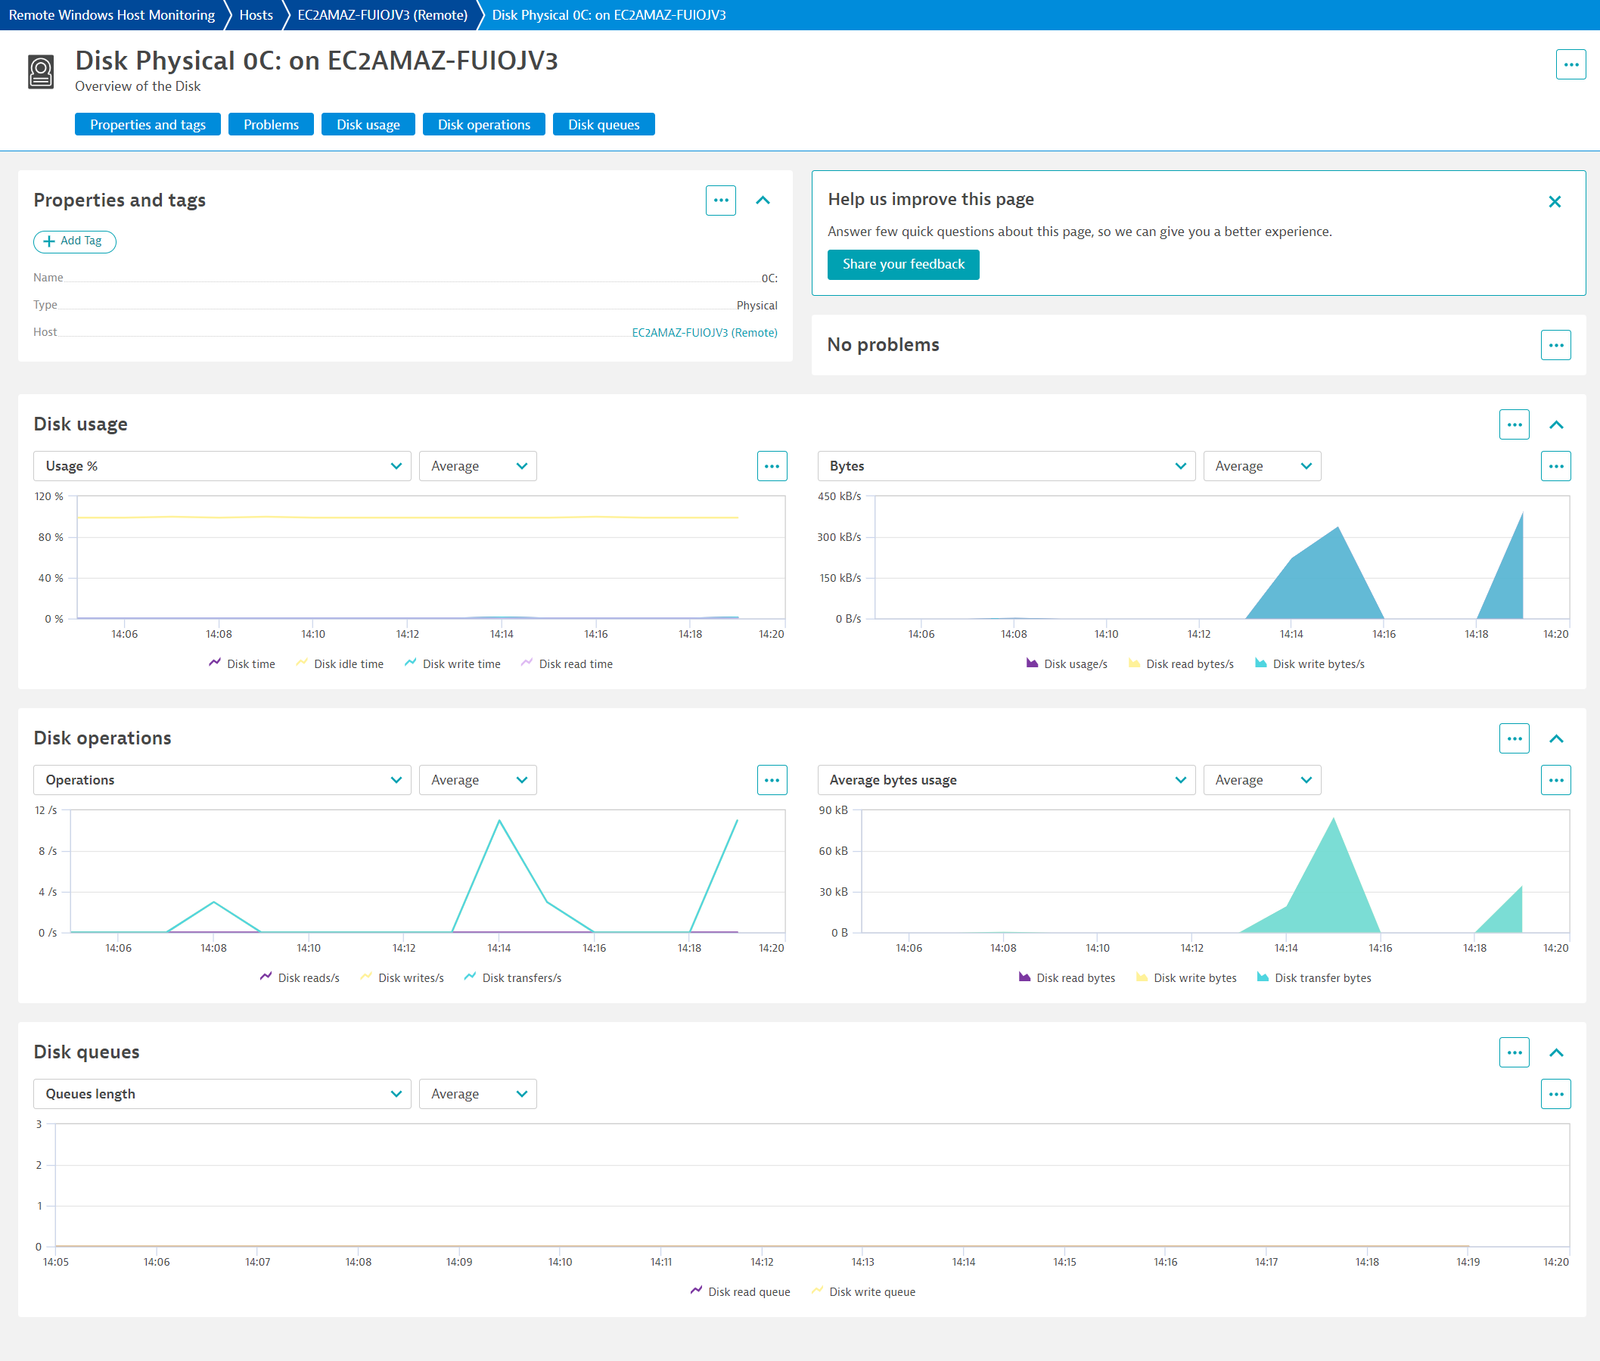
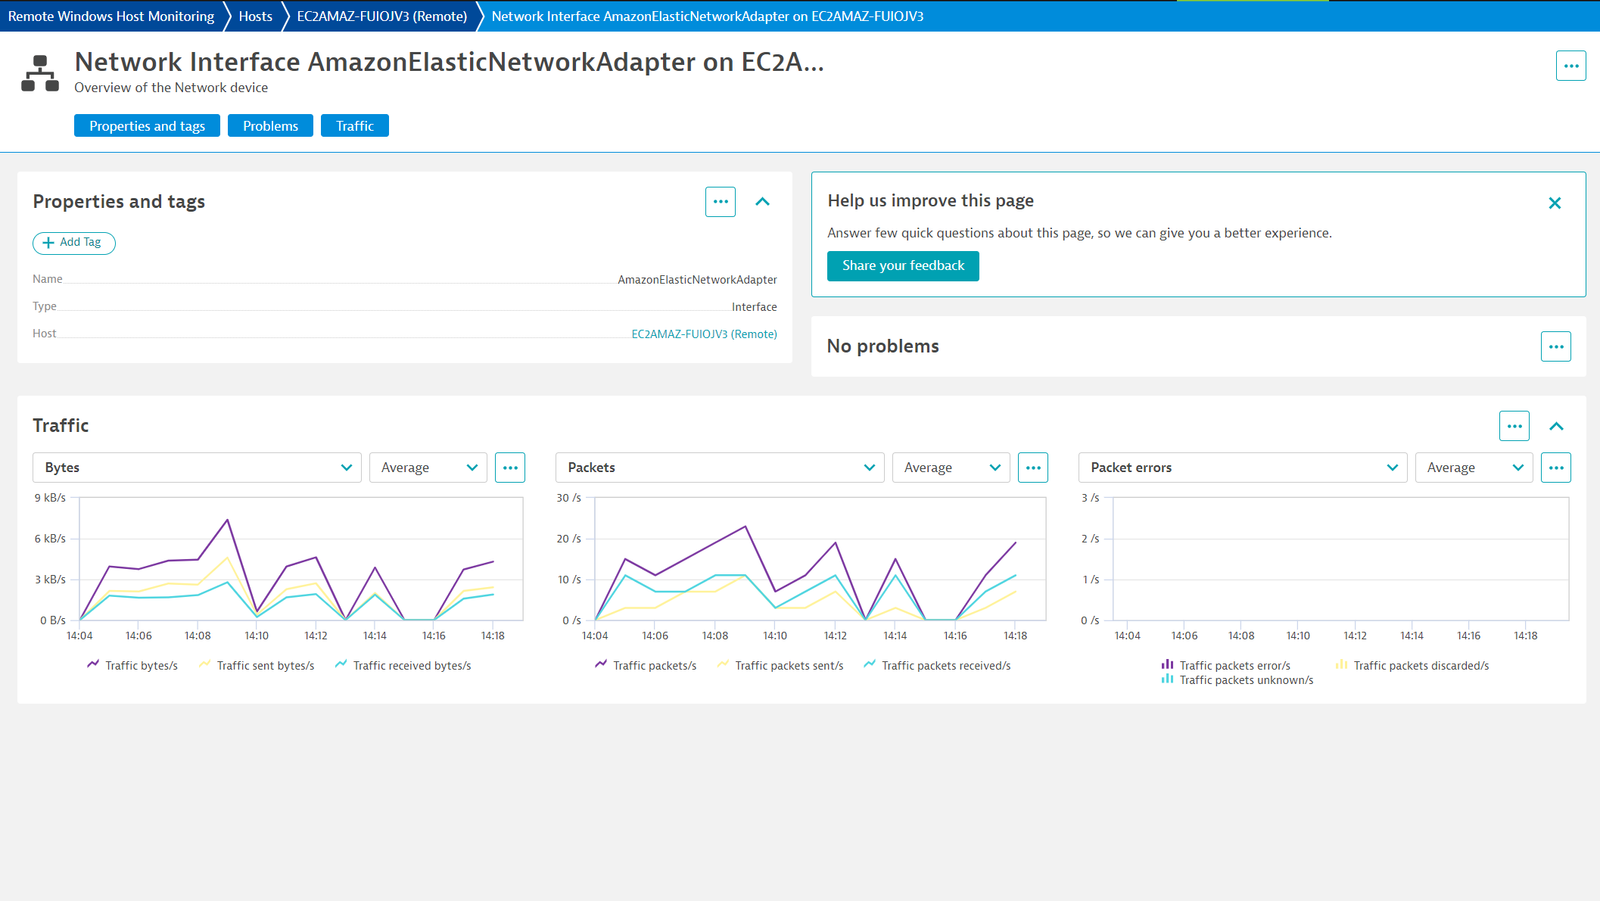
ExtensionThis extension leverages the WMI protocol to collect data from Windows hosts, without the need for any agent. This enables agent-less, remote monitoring while providing the same transparency and visibility of Windows hosts as otherwise only offered with a OneAgent installation.
For more information on the installation and configuration, please see Remote Windows Host Monitoring extension in the Dynatrace Documentation.
Below is a complete list of the feature sets provided in this version. To ensure a good fit for your needs, individual feature sets can be activated and deactivated by your administrator during configuration.
| Metric name | Metric key | Description | Unit |
|---|---|---|---|
| Used processor time | com.dynatrace.extension.host-observability.host.cpu.time.processor | Percent of used processor time | Percent |
| Idle processor time | com.dynatrace.extension.host-observability.host.cpu.time.idle | Percent of idle processor time | Percent |
| User processor time | com.dynatrace.extension.host-observability.host.cpu.time.user | Percent of user processor time | Percent |
| Available memory size | com.dynatrace.extension.host-observability.host.memory.bytes.available | - | Byte |
| Commited memory size | com.dynatrace.extension.host-observability.host.memory.bytes.commited | Committed Bytes is the amount of committed virtual memory, in bytes. | Byte |
| Used commited memory | com.dynatrace.extension.host-observability.host.memory.bytes.commited.inuse | Percentage of using commited memory | Percent |
| Processes | com.dynatrace.extension.host-observability.host.processes | Number of processes | Count |
| Threads | com.dynatrace.extension.host-observability.host.threads | Number of threads | Count |
| Disk usage/s | com.dynatrace.extension.host-observability.disk.bytes.persec | Disk bytes used per second | BytePerSecond |
| Disk read bytes/s | com.dynatrace.extension.host-observability.disk.bytes.read.persec | Disk bytes read per second | BytePerSecond |
| Disk reads/s | com.dynatrace.extension.host-observability.disk.read.persec | Number of disk reads per second | PerSecond |
| Disk write bytes/s | com.dynatrace.extension.host-observability.disk.bytes.write.persec | Disk bytes write per second | BytePerSecond |
| Disk writes/s | com.dynatrace.extension.host-observability.disk.write.persec | Number of disk writes per second | PerSecond |
| Disk transfers/s | com.dynatrace.extension.host-observability.disk.transfer.persec | Number of disk transfers per second | PerSecond |
| Disk time | com.dynatrace.extension.host-observability.disk.usage.percent | Percent of disk time | Percent |
| Disk read time | com.dynatrace.extension.host-observability.disk.usage.read.percent | Percent of disk read time | Percent |
| Disk write time | com.dynatrace.extension.host-observability.disk.usage.write.percent | Percent of disk write time | Percent |
| Disk idle time | com.dynatrace.extension.host-observability.disk.usage.idle.percent | Percent of disk idle time | Percent |
| Disk read bytes | com.dynatrace.extension.host-observability.disk.read.avg.bytes | Average bytes per disk read | Byte |
| Disk write bytes | com.dynatrace.extension.host-observability.disk.write.avg.bytes | Average bytes per disk write | Byte |
| Disk transfer bytes | com.dynatrace.extension.host-observability.disk.transfer.avg.bytes | Average bytes per disk transfer | Byte |
| Disk read queue | com.dynatrace.extension.host-observability.disk.queue.avg.read | Average length of disk read queue | Count |
| Disk write queue | com.dynatrace.extension.host-observability.disk.queue.avg.write | Average length of disk write queue | Count |
| Disk available | com.dynatrace.extension.host-observability.disk.logical.free.megabytes | Disk available | MegaByte |
| Disk available % | com.dynatrace.extension.host-observability.disk.logical.free.percent | Disk available % | Percent |
| Metric name | Metric key | Description | Unit |
|---|---|---|---|
| - | com.dynatrace.extension.host-observability.disk.secper.read.count | - | - |
| - | com.dynatrace.extension.host-observability.disk.secper.read_base.count | - | - |
| - | com.dynatrace.extension.host-observability.disk.secper.transfer.count | - | - |
| - | com.dynatrace.extension.host-observability.disk.secper.transfer_base.count | - | - |
| - | com.dynatrace.extension.host-observability.disk.secper.write.count | - | - |
| - | com.dynatrace.extension.host-observability.disk.secper.write_base.count | - | - |
| - | com.dynatrace.extension.host-observability.disk.frequency_perftime | - | - |
| Metric name | Metric key | Description | Unit |
|---|---|---|---|
| Non-paged memory size | com.dynatrace.extension.host-observability.host.memory.pool.nonpaged | Pool Nonpaged Bytes is the size, in bytes, of the nonpaged pool, an area of the system virtual memory that is used for objects that cannot be written to disk, but must remain in physical memory as long as they are allocated. | Byte |
| Paged memory size | com.dynatrace.extension.host-observability.host.memory.pool.paged | - | Byte |
| Page faults per second | com.dynatrace.extension.host-observability.host.memory.pagefaults.persec | Number of page faults per second | PerSecond |
| Pool paged resident bytes | com.dynatrace.extension.host-observability.host.PerfOS_Memory.PoolPagedResidentBytes | Pool Paged Resident Bytes is the size, in bytes, of the portion of the paged pool that is currently resident and active in physical memory. | Byte |
| Commit limit | com.dynatrace.extension.host-observability.host.PerfOS_Memory.CommitLimit | Commit Limit is the amount of virtual memory that can be committed without having to extend the paging file(s) | Byte |
| Free and Zero page list bytes | com.dynatrace.extension.host-observability.host.PerfOS_Memory.FreeAndZeroPageListBytes | Free & Zero Page List Bytes is the amount of physical memory, in bytes, that is assigned to the free and zero page lists. This memory does not contain cached data. It is immediately available for allocation to a process or for system use. | Byte |
| Free system page table entries | com.dynatrace.extension.host-observability.host.PerfOS_Memory.FreeSystemPageTableEntries | Free System Page Table Entries is the number of page table entries not currently in used by the system. This counter displays the last observed value only; it is not an average. | Count |
| Long-Term average standby cache lifetime | com.dynatrace.extension.host-observability.host.PerfOS_Memory.LongTermAverageStandbyCacheLifetimes | Long-Term Average Standby Cache Lifetime, in seconds. | Second |
| Pages input per second | com.dynatrace.extension.host-observability.host.PerfOS_Memory.PagesInputPersec | Pages Input/sec is the rate at which pages are read from disk to resolve hard page faults. Hard page faults occur when a process refers to a page in virtual memory that is not in its working set or elsewhere in physical memory, and must be retrieved from disk. | PerSecond |
| Pages output per second | com.dynatrace.extension.host-observability.host.PerfOS_Memory.PagesOutputPersec | Pages Output/sec is the rate at which pages are written to disk to free up space in physical memory. Pages are written back to disk only if they are changed in physical memory, so they are likely to hold data, not code. | PerSecond |
| Pages per second | com.dynatrace.extension.host-observability.host.PerfOS_Memory.PagesPersec | Pages/sec is the rate at which pages are read from or written to disk to resolve hard page faults. This counter is a primary indicator of the kinds of faults that cause system-wide delays. | PerSecond |
| System cache resident bytes | com.dynatrace.extension.host-observability.host.PerfOS_Memory.SystemCacheResidentBytes | System Cache Resident Bytes is the size, in bytes, of the portion of the system file cache which is currently resident and active in physical memory. | Byte |
| Transition pages repurposed per second | com.dynatrace.extension.host-observability.host.PerfOS_Memory.TransitionPagesRePurposedPersec | Transition Pages RePurposed is the rate at which the number of transition cache pages were reused for a different purpose. | PerSecond |
| Allocated for swap memory | com.dynatrace.extension.host-observability.host.swap.allocated | Allocated disk space for swap memory | MegaByte |
| - | com.dynatrace.extension.host-observability.host.swap.current | - | - |
| Swap memory used | com.dynatrace.extension.host-observability.host.swap.peak | Disk space used by swap memory | MegaByte |
| Total swap memory | com.dynatrace.extension.host-observability.host.swap.total | Total kilobytes that can be stored in the operating system paging files | KiloByte |
| Available swap memory | com.dynatrace.extension.host-observability.host.swap.available | Number, in kilobytes, that can be mapped into the paging files without causing any other pages to be swapped out | KiloByte |
| Metric name | Metric key | Description | Unit |
|---|---|---|---|
| Traffic bytes/s | com.dynatrace.extension.host-observability.network.bytes.persec | Network traffic bytes per second | BytePerSecond |
| Traffic received bytes/s | com.dynatrace.extension.host-observability.network.bytes.received.persec | Network traffic received bytes per second | BytePerSecond |
| Traffic sent bytes/s | com.dynatrace.extension.host-observability.network.bytes.sent.persec | Network traffic sent bytes per second | BytePerSecond |
| Traffic packets/s | com.dynatrace.extension.host-observability.network.packets.persec | Network traffic packets per second | PerSecond |
| Traffic packets received/s | com.dynatrace.extension.host-observability.network.packets.received.persec | Network traffic received packets per second | PerSecond |
| Traffic packets discarded/s | com.dynatrace.extension.host-observability.network.packets.received.discarded.persec | Network traffic discarded received packets per second | PerSecond |
| Traffic packets error/s | com.dynatrace.extension.host-observability.network.packets.received.errors.persec | Network traffic error received packets per second | PerSecond |
| Traffic packets unknown/s | com.dynatrace.extension.host-observability.network.packets.received.unknown.persec | Network traffic unknown received packets per second | PerSecond |
| Traffic packets sent/s | com.dynatrace.extension.host-observability.network.packets.sent.persec | - | PerSecond |
| Metric name | Metric key | Description | Unit |
|---|---|---|---|
| Traffic bytes/s | com.dynatrace.extension.host-observability.network.bytes.persec | Network traffic bytes per second | BytePerSecond |
| Traffic received bytes/s | com.dynatrace.extension.host-observability.network.bytes.received.persec | Network traffic received bytes per second | BytePerSecond |
| Traffic sent bytes/s | com.dynatrace.extension.host-observability.network.bytes.sent.persec | Network traffic sent bytes per second | BytePerSecond |
| Traffic packets/s | com.dynatrace.extension.host-observability.network.packets.persec | Network traffic packets per second | PerSecond |
| Traffic packets received/s | com.dynatrace.extension.host-observability.network.packets.received.persec | Network traffic received packets per second | PerSecond |
| Traffic packets discarded/s | com.dynatrace.extension.host-observability.network.packets.received.discarded.persec | Network traffic discarded received packets per second | PerSecond |
| Traffic packets error/s | com.dynatrace.extension.host-observability.network.packets.received.errors.persec | Network traffic error received packets per second | PerSecond |
| Traffic packets unknown/s | com.dynatrace.extension.host-observability.network.packets.received.unknown.persec | Network traffic unknown received packets per second | PerSecond |
| Traffic packets sent/s | com.dynatrace.extension.host-observability.network.packets.sent.persec | - | PerSecond |
| Metric name | Metric key | Description | Unit |
|---|---|---|---|
| Handle count | com.dynatrace.extension.host-observability.process.PerfProc_Process.HandleCount | The total number of handles currently open by this process. | Count |
| IO data operations per second | com.dynatrace.extension.host-observability.process.PerfProc_Process.IODataOperationsPersec | The rate at which the process is issuing read and write I/O operations. | PerSecond |
| IO other operations per second | com.dynatrace.extension.host-observability.process.PerfProc_Process.IOOtherOperationsPersec | The rate at which the process is issuing I/O operations that are neither read nor write operations (for example, a control function). | PerSecond |
| IO read operations per second | com.dynatrace.extension.host-observability.process.PerfProc_Process.IOReadOperationsPersec | The rate at which the process is issuing read I/O operations. | PerSecond |
| IO write operations per second | com.dynatrace.extension.host-observability.process.PerfProc_Process.IOWriteOperationsPersec | The rate at which the process is issuing write I/O operations. | PerSecond |
| Percent privileged time | com.dynatrace.extension.host-observability.process.PerfProc_Process.PercentPrivilegedTime | Percent Privileged Time is the percentage of elapsed time that the process threads spent executing code in privileged mode. | Percent |
| Percent processor time | com.dynatrace.extension.host-observability.process.PerfProc_Process.PercentProcessorTime | Percent Processor Time is the percentage of elapsed time that all of process threads used the processor to execution instructions. | Percent |
| Private bytes | com.dynatrace.extension.host-observability.process.PerfProc_Process.PrivateBytes | Private Bytes is the current size, in bytes, of memory that this process has allocated that cannot be shared with other processes. | Byte |
| Thread count | com.dynatrace.extension.host-observability.process.PerfProc_Process.ThreadCount | The number of threads currently active in this process. | Count |
| Virtual bytes | com.dynatrace.extension.host-observability.process.PerfProc_Process.VirtualBytes | Virtual Bytes is the current size, in bytes, of the virtual address space the process is using. | Byte |
| Working set | com.dynatrace.extension.host-observability.process.PerfProc_Process.WorkingSet | Working Set is the current size, in bytes, of the Working Set of this process. | Byte |
| Pool non paged bytes | com.dynatrace.extension.host-observability.process.PerfProc_Process.PoolNonpagedBytes | Pool Nonpaged Bytes is the size, in bytes, of the nonpaged pool, an area of the system virtual memory that is used for objects that cannot be written to disk, but must remain in physical memory as long as they are allocated. | Byte |
| Pool paged bytes | com.dynatrace.extension.host-observability.process.PerfProc_Process.PoolPagedBytes | Pool Paged Bytes is the size, in bytes, of the paged pool, an area of the system virtual memory that is used for objects that can be written to disk when they are not being used. | Byte |
| Metric name | Metric key | Description | Unit |
|---|---|---|---|
| Disk usage/s | com.dynatrace.extension.host-observability.disk.bytes.persec | Disk bytes used per second | BytePerSecond |
| Disk read bytes/s | com.dynatrace.extension.host-observability.disk.bytes.read.persec | Disk bytes read per second | BytePerSecond |
| Disk reads/s | com.dynatrace.extension.host-observability.disk.read.persec | Number of disk reads per second | PerSecond |
| Disk write bytes/s | com.dynatrace.extension.host-observability.disk.bytes.write.persec | Disk bytes write per second | BytePerSecond |
| Disk writes/s | com.dynatrace.extension.host-observability.disk.write.persec | Number of disk writes per second | PerSecond |
| Disk transfers/s | com.dynatrace.extension.host-observability.disk.transfer.persec | Number of disk transfers per second | PerSecond |
| Disk time | com.dynatrace.extension.host-observability.disk.usage.percent | Percent of disk time | Percent |
| Disk read time | com.dynatrace.extension.host-observability.disk.usage.read.percent | Percent of disk read time | Percent |
| Disk write time | com.dynatrace.extension.host-observability.disk.usage.write.percent | Percent of disk write time | Percent |
| Disk idle time | com.dynatrace.extension.host-observability.disk.usage.idle.percent | Percent of disk idle time | Percent |
| Disk read bytes | com.dynatrace.extension.host-observability.disk.read.avg.bytes | Average bytes per disk read | Byte |
| Disk write bytes | com.dynatrace.extension.host-observability.disk.write.avg.bytes | Average bytes per disk write | Byte |
| Disk transfer bytes | com.dynatrace.extension.host-observability.disk.transfer.avg.bytes | Average bytes per disk transfer | Byte |
| Disk read queue | com.dynatrace.extension.host-observability.disk.queue.avg.read | Average length of disk read queue | Count |
| Disk write queue | com.dynatrace.extension.host-observability.disk.queue.avg.write | Average length of disk write queue | Count |
| Metric name | Metric key | Description | Unit |
|---|---|---|---|
| Active TCP connections | com.dynatrace.extension.host-observability.network.tcp.connections.active.count | Number of active TCP connections | Count |
| Established TCP connections | com.dynatrace.extension.host-observability.network.tcp.connections.established.count | Number of established TCP connections | Count |
| Failed TCP connections | com.dynatrace.extension.host-observability.network.tcp.connections.failures.count | Number of failed TCP connections | Count |
| Passive TCP connections | com.dynatrace.extension.host-observability.network.tcp.connections.passive.count | Number of passive TCP connections | Count |
| TCP connection resets | com.dynatrace.extension.host-observability.network.tcp.connections.resets.count | Number of TCP connection resets | Count |
| TCP segments/s | com.dynatrace.extension.host-observability.network.tcp.segments.persec | Number of TCP segments per second | PerSecond |
| TCP segments received/s | com.dynatrace.extension.host-observability.network.tcp.segments.received.persec | Number of received TCP segments per second | PerSecond |
| TCP segments sent/s | com.dynatrace.extension.host-observability.network.tcp.segments.sent.persec | Number of sent TCP segments per second | PerSecond |
| TCP segments transmitted/s | com.dynatrace.extension.host-observability.network.tcp.segments.transmitted.persec | Number of transmitted TCP segments per second | PerSecond |
| Metric name | Metric key | Description | Unit |
|---|---|---|---|
| UDP datagrams/s | com.dynatrace.extension.host-observability.network.udp.datagrams.persec | Number of UDP datagrams per second | PerSecond |
| UDP datagrams received/s | com.dynatrace.extension.host-observability.network.udp.datagrams.received.persec | Number of received UDP datagrams per second | PerSecond |
| UDP Received invalid datagrams | com.dynatrace.extension.host-observability.network.udp.datagrams.received.errors.count | Number of received invalid UDP datagrams | Count |
| UDP datagrams sent/s | com.dynatrace.extension.host-observability.network.udp.datagrams.sent.persec | Number of sent UDP datagrams per second | PerSecond |
1.338.0 and a minimum EEC version of 1.318.0.✨ New in this version:
com.dynatrace.extension.host-observability.host.processes and com.dynatrace.extension.host-observability.host.threads✨ New in this version:
1.318New in this version:
dt.security_context is applied to extension topology.com.dynatrace.extension.host-observability.disk.logical.free.megabytes
Free disk memory -> Disk availablecom.dynatrace.extension.host-observability.disk.logical.free.percent
Free disk memory % -> Disk available %🐛Bug Fixes
✨ Improvements
Version 1.2.1 of this extension raises the minDynatraceVersion to 1.233
Updated icons Updated UA screens with breadcrumbs