





Skip to technology filters Skip to main content
Dynatrace Hub

Extend the platform,
empower your team.

Popular searches:
Home hero bg
SnowflakeSnowflake
Snowflake

Snowflake

Expand visibility to improve health and performance monitoring of your Snowflake.

Extension
Free trialDocumentation
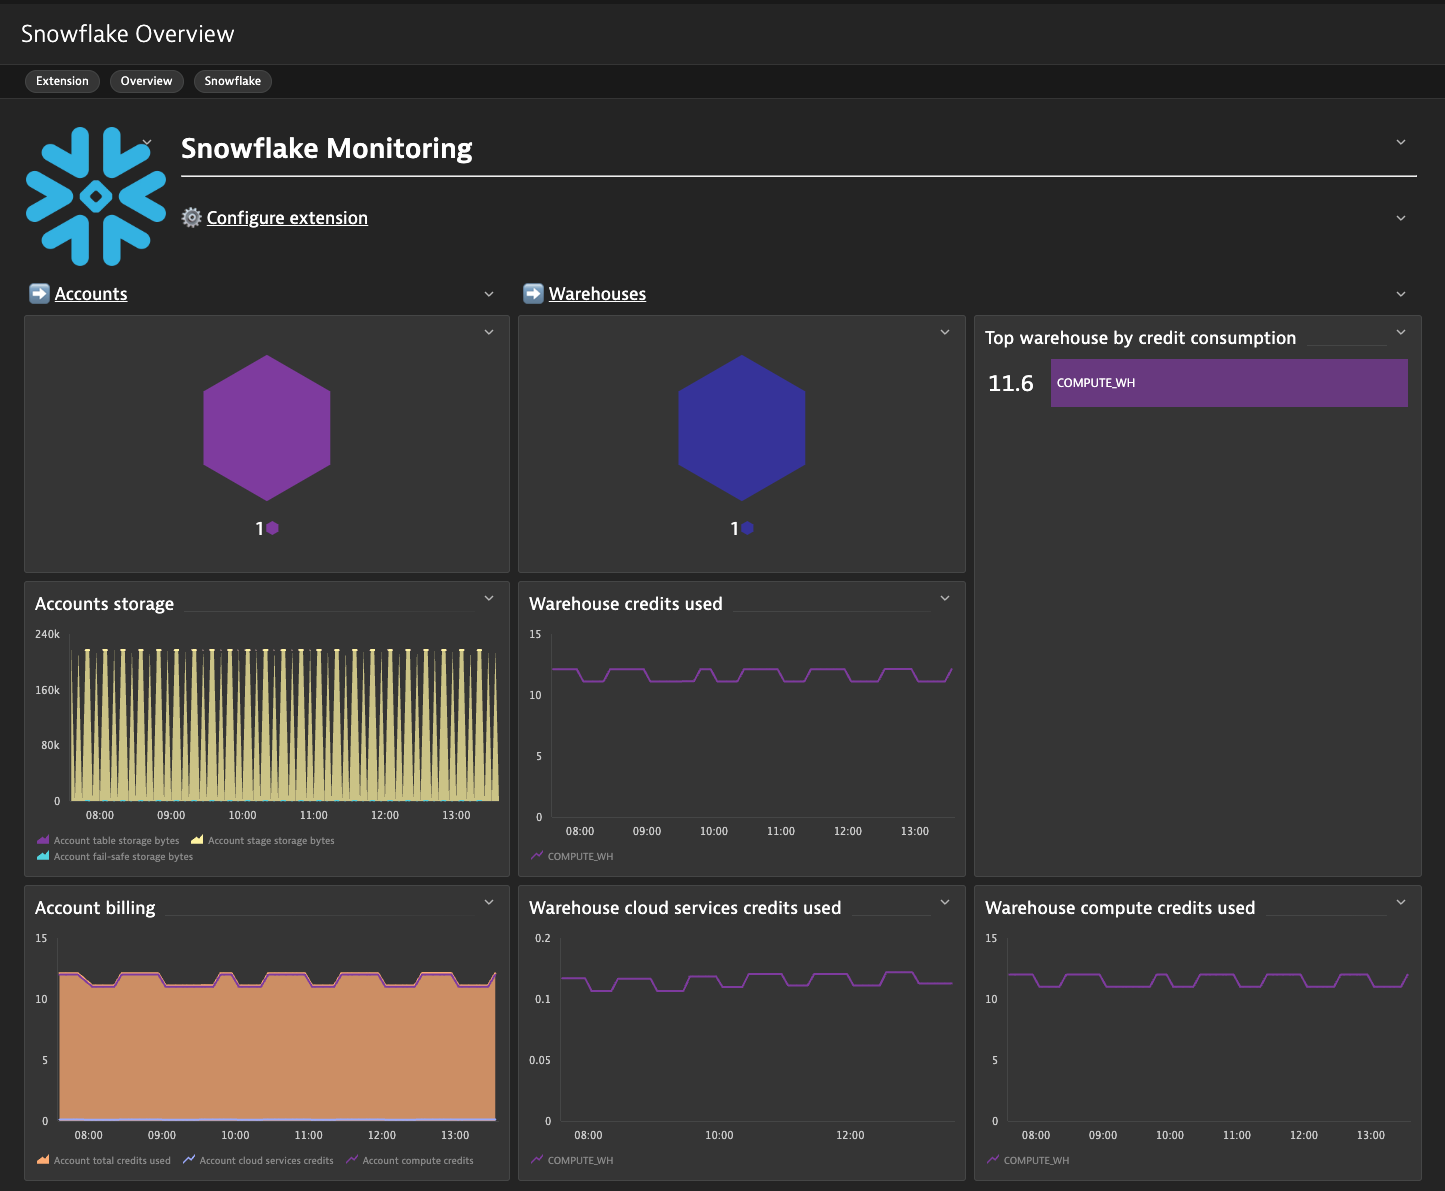
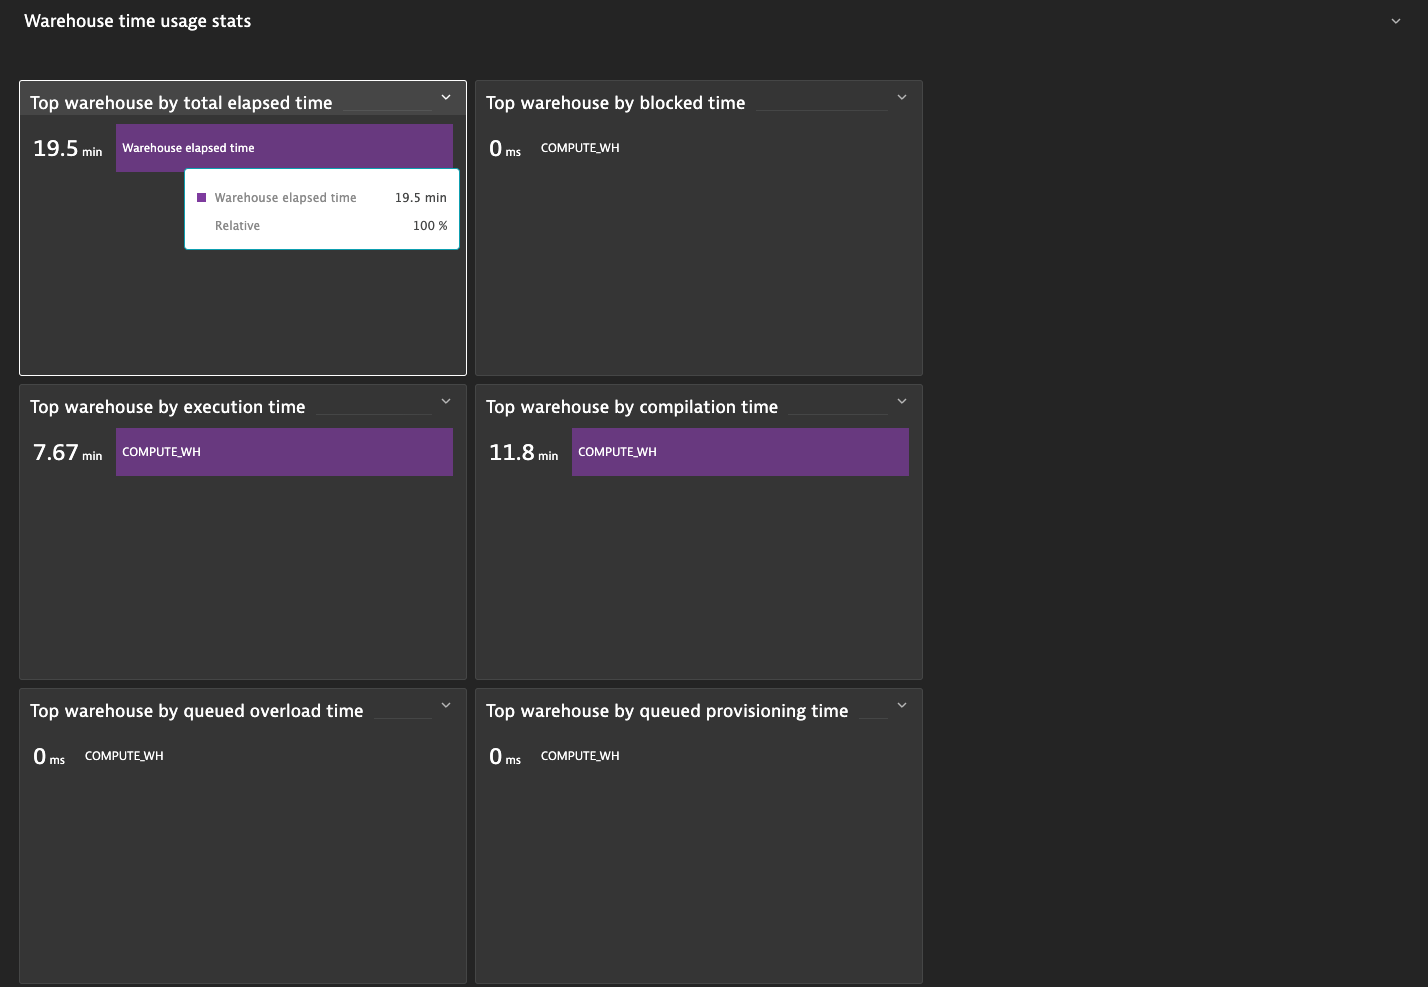
Dashboard overviewTop warehouses by consumed time
  • Product information
  • Release notes

Overview

Snowflake monitoring uses a remote monitoring approach implemented as a Dynatrace ActiveGate extension. The extension queries the Account Usage and Information Schema for key performance and health metrics, extending your visibility and allowing Dynatrace Intelligence to detect anomalies and support problem analysis.

Use cases

  • monitor Snowflake data pipelines: detect unexpected drops or spikes in row counts or query outputs, improving reliability of analytics and ETL workflows.
  • unify BI & Application Observability: combine Snowflake data with application telemetry to pinpoint downstream impacts of data latency or schema changes.
  • automate based on Snowflake conditions: trigger workflows based on query results, enabling automated actions when thresholds, business rules, or anomalies are detected.

Get started

For more information on the installation and configuration, please see Snowflake extension in the Dynatrace Documentation.

Details

  • Snowflake Query Ingestion: execute Snowflake queries and ingest results as BizEvents or Grail records. Columns become indexed fields available for analysis.
  • Operational Visibility: monitor data volumes and detect anomalies in Snowflake-driven pipelines, using Extensions 2.0 combined with Grail analytics.
  • Performance & Cost Awareness: track Snowflake query behavior, compute usage, and workload patterns to understand consumption and efficiency.
  • Data Enrichment: merge Snowflake data with existing telemetry in Dynatrace for holistic investigations, dashboards, and workflows.
  • Secure, governed access: ingested Snowflake data respects Snowflake’s permission model and data governance practices.
Dynatrace
Documentation
By Dynatrace
Dynatrace support center
Subscribe to new releases
Copy to clipboard

Feature sets

Below is a complete list of the feature sets provided in this version. To ensure a good fit for your needs, individual feature sets can be activated and deactivated by your administrator during configuration.

Feature setsNumber of metrics included
Metric nameMetric keyDescriptionUnit
Snowflake availabilitysnowflake.account.availabilityWhether Snowflake responds to queries or notPercent
Metric nameMetric keyDescriptionUnit
Account table storage bytessnowflake.account.storage.tableNumber of bytes of table storage used, including bytes for data currently in Time Travel.Bytes
Account stage storage bytessnowflake.account.storage.stageNumber of bytes of stage storage used by files in all internal stages (named, table, and user).Bytes
Account fail-safe storage bytessnowflake.account.storage.failsafeNumber of bytes of data in Fail-safe.Bytes
Metric nameMetric keyDescriptionUnit
Warehouse compute credits usedsnowflake.account.warehouse.credits.computeNumber of credits used for the warehouse.Count
Warehouse cloud services credits usedsnowflake.account.warehouse.credits.cloudServicesNumber of credits used for cloud services for the warehouse.Count
Warehouse credits usedsnowflake.account.warehouse.credits.totalNumber of credits billed for the warehouse.Count
Metric nameMetric keyDescriptionUnit
Warehouse compilation timesnowflake.account.warehouse.time.compilationQuery compillation time per warehouse.MilliSecond
Warehouse execution timesnowflake.account.warehouse.time.executionQuery execution time per warehouse.MilliSecond
Warehouse elapsed timesnowflake.account.warehouse.time.elapsedQuery total elapsed time per warehouse.MilliSecond
Warehouse queued provisioning timesnowflake.account.warehouse.time.queued.provisioningQuery queued provisioning time per warehouse.MilliSecond
Warehouse queued overload timesnowflake.account.warehouse.time.queued.overloadQuery queued overload time per warehouse.MilliSecond
Warehouse blocked timesnowflake.account.warehouse.time.blockedQuery blocked time per warehouse.MilliSecond
Metric nameMetric keyDescriptionUnit
Account compute creditssnowflake.account.credits.computeNumber of credits used by warehouses and serverless compute resources.Count
Account cloud services creditssnowflake.account.credits.cloudServicesNumber of credits used for cloud services.Count
Account total credits usedsnowflake.account.credits.totalTotal number of credits used by the account.Count

Related to Snowflake

ActiveGate logo

ActiveGate

Route traffic, monitor clouds and remote technologies & run Synthetic monitors.

Full version history

To have more information on how to install the downloaded package, please follow the instructions on this page.
ReleaseDate

Full version history

⚠️WARNING⚠️: Possible breaking changes and warnings - PLEASE READ before upgrading:

  • This version requires a minimum Dynatrace version of 1.338.0 and a minimum EEC version of 1.265.0.
  • This version includes a breaking change for Dynatrace on Grail.
    • With the inclusion of OpenPipeline processing rules, any metrics ingested from the extension will be processed by a dedicated OpenPipeline pipeline.
    • This means that any dynamic route configured to process any metrics from the extension will be dropped in favor of the dedicated pipeline. Please, refer to pipeline groups to continue using dynamic routes.
    • With the inclusion of OpenPipeline processing rules, any logs ingested from the extension will be processed by a dedicated OpenPipeline pipeline instead of the classic log pipeline.
    • This means that classic rules will no longer be used on logs ingested from the extension. Please be sure to migrate any you still need to OpenPipeline rules.
    • Additionally, some field names are handled differently in OpenPipeline, e.g. capitalization. Please double-check any custom dashboards and alerts you have created for this extension.
    • You must opt-in to OpenPipeline configuration via Settings API – see the documentation.

New in this version:

  • Smartscape on Grail.
  • Added feature set metadata for recommended metrics.

Full version history

New in this version:

  • Added keyword key value pairs to extension

Full version history

New in this version

  • dt.security_context is applied to sql:snowflake_account and sql:snowflake_warehouse entites.
  • Added screens for latest Dynatrace.
  • Added New Dashboard for latest Dynatrace.

Improved in this version

  • Improved layout of existing Unified Analysis screens.

Full version history

✨New in this version:

  • Adds a new variable to control the timeout for collecting longest queries and failed queries

Full version history

  • Adds two (2) fields to enable modification of the interval for account/warehouse queries and longest/failed queries

Full version history

v2.0.0

Breaking changes: monitoring configurations will have to be recreated to upgrade to this version.

Features:

  • Availability metric snowflake.account.availability that gets reported every minute and does not use a warehouse, meaning that it does not consume credits and allows warehouse to split.

Improvements:

  • Feature sets were renamed to better represent underlying technology.
  • Account entity can be detected from Logs in addition to being detected based on Metrics.

Bug fixes:

  • status attribute for Failed Queries and Longest Queries was renamed to execution_status to avoid conflict with built-in Dynatrace logs status property.

Full version history

The extension has been reworked to better reflect the existing Snowflake monitoring requirements. Account level metrics from ACCOUNT_USAGE schema are collected every 12 hours. Additionally, failed queries and top slowest queries are monitored every hour, if the corresponding feature sets are enabled.

Full version history

  • Updated dashboard to follow standardized look and feel

Full version history

Changes in this release

  • Metric fetching frequency reduced to once per 30 min.

Full version history

Initial release

Dynatrace Hub
Hub HomeGet data into DynatraceBuild your own app
Dynatrace Intelligence - Agentic Operations SystemThe Dynatrace Agentic AI ecosystem
All (914)Log Management and AnalyticsKubernetesAI and LLM ObservabilityInfrastructure ObservabilitySoftware DeliveryApplication ObservabilityApplication SecurityDigital Experience
Filter
Type
Built and maintained by
Deployment model
SaaS
  • SaaS
  • Managed
Partner FinderBecome a partnerDynatrace Developer

Business Observability

Get better outcomes across your digital channels and business processes with precise analytics. Use real-time business observability to improve your IT and business collaboration.

Essentials

Business Flow logo

Business Flow

Track, analyze, and optimize your critical business processes.

Cost & Carbon Optimization logo

Cost & Carbon Optimization

Track, analyze, and optimize your IT carbon footprint and public cloud costs.

Business events logo

Business events

Deliver real-time business observability to business and IT teams.

More resources

Compliance Assistant logo

Compliance Assistant

Track, manage, and automate compliance across your IT and business landscape.

Custom database extension logo

Custom database extension

Execute generic database queries and ingest metrics and logs to Dynatrace.

Data Observability logo

Data Observability

Monitor Snowflake health, queries, and credit costs — directly inside Dynatrace.

coming soon
definity logo

definity

Monitor and optimize your Lakehouse, Spark, and Databricks pipelines.

Microsoft Power BI Connector logo

Microsoft Power BI Connector

Connect Power BI to Dynatrace.

Snowflake for Workflows logo

Snowflake for Workflows

Access, query, and store Snowflake data to analyze further within Dynatrace.

Are you looking for something different?

We have hundreds of apps, extensions, and other technologies to customize your environment

Extend your knowledge

Business events and Grail

Business events and Grail

Business events help solve your business use cases through real-time lossless precision and deep access to business data.
Read how

Watch: Dynatrace Observability Clinic

Watch: Dynatrace Observability Clinic

In this Observability Clinic we step through examples of ingesting, exploring, and analyzing your organization’s business data.
Watch
Watch: Optimize business processes

Watch: Optimize business processes

From conversion to fulfillment to financial reports, see how Mitchells & Butlers improves and automates key business processes.
Build skills
Dive deeper into business events

Dive deeper into business events

Discover the unique enabling characteristics of business events through two examples to see how easy it is to get started.
Read more
Watch: Dynatrace Observability Clinic

Watch: Dynatrace Observability Clinic

In this Observability Clinic, learn how to use RUM to capture business events and to use the ingest pipeline to transform, extract metrics, and set alerts.
Watch
Read: Extract metrics from business events

Read: Extract metrics from business events

Did you know you can easily extract metrics from business events? With metrics, you gain Davis AI-driven causation analytics and flexible alerting for your business use cases.
Read how