









Skip to technology filters Skip to main content
Dynatrace Hub

Extend the platform,
empower your team.

Popular searches:
Home hero bg
Syslog (Dynatrace OTel Collector)Syslog (Dynatrace OTel Collector)
Syslog (Dynatrace OTel Collector)

Syslog (Dynatrace OTel Collector)

Stream Syslog data via Dynatrace OpenTelemetry Collector Distribution.

Technology
Free trial
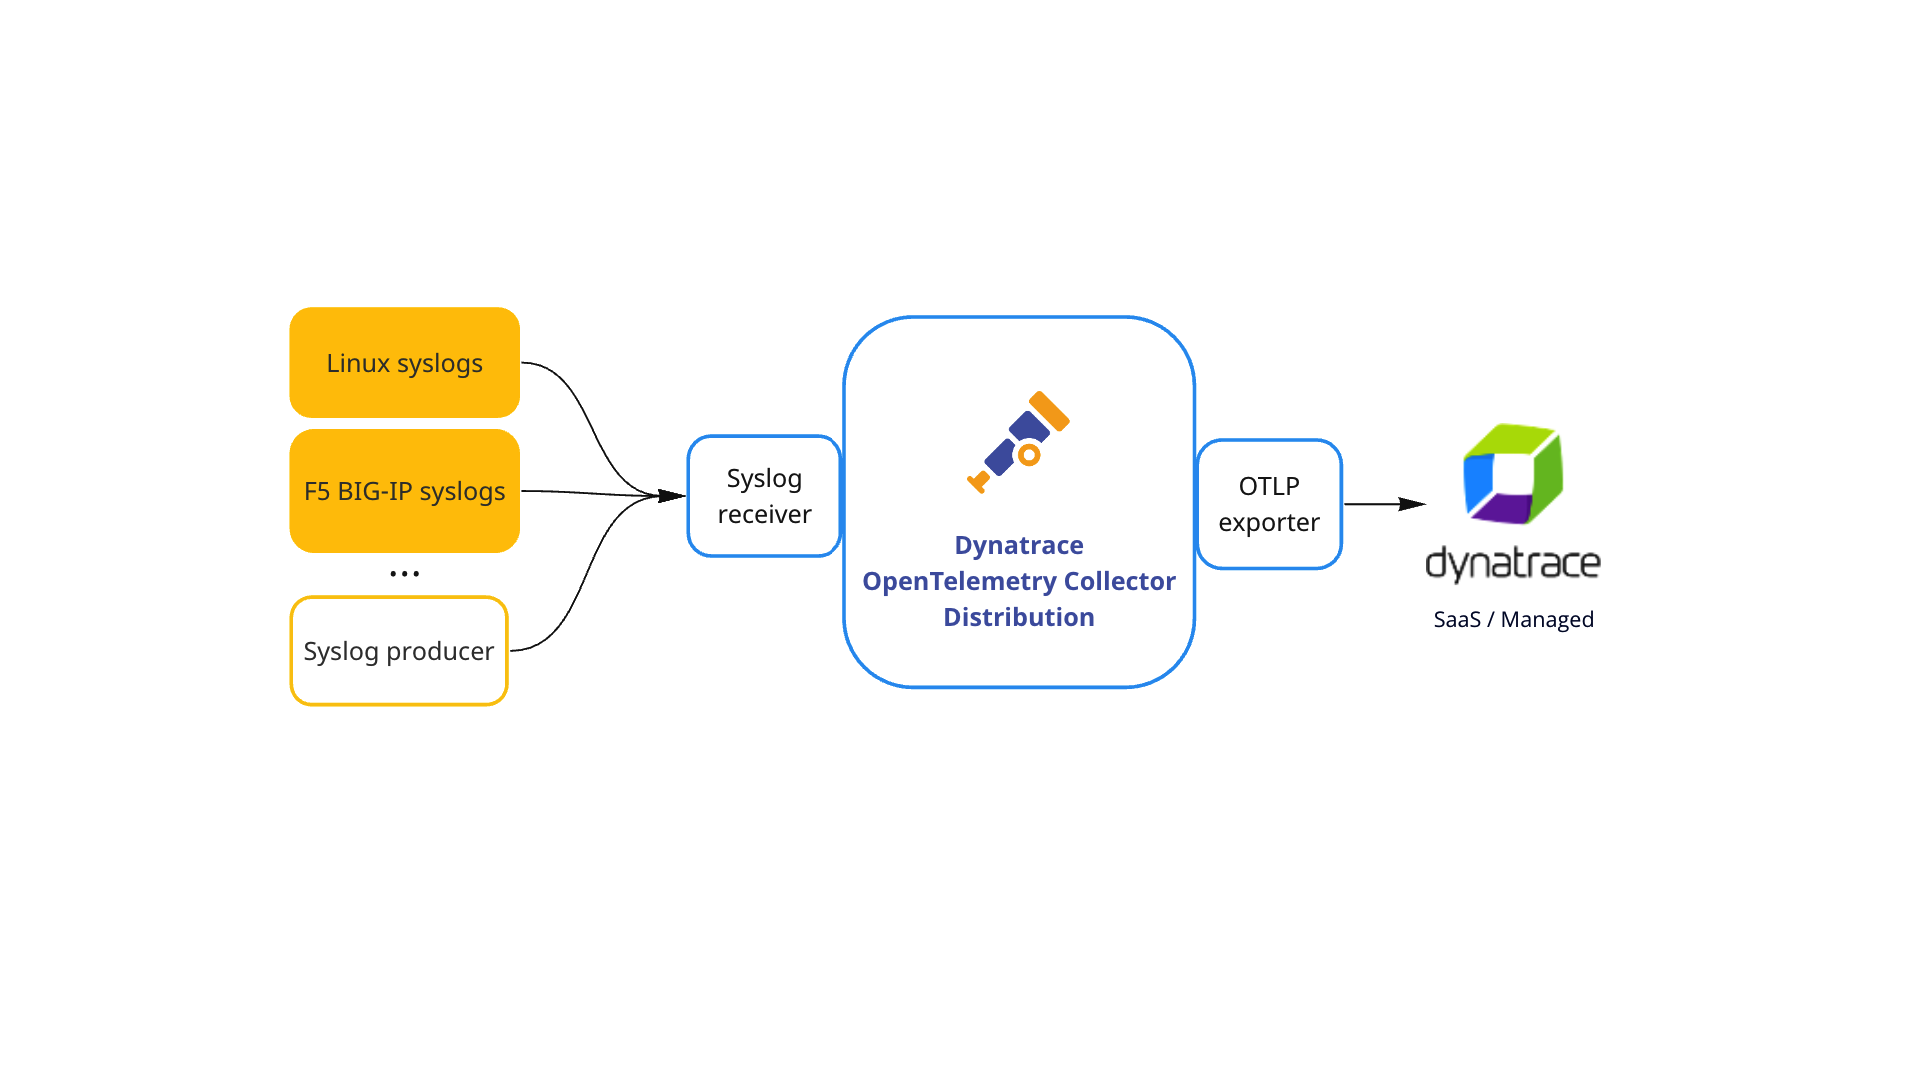
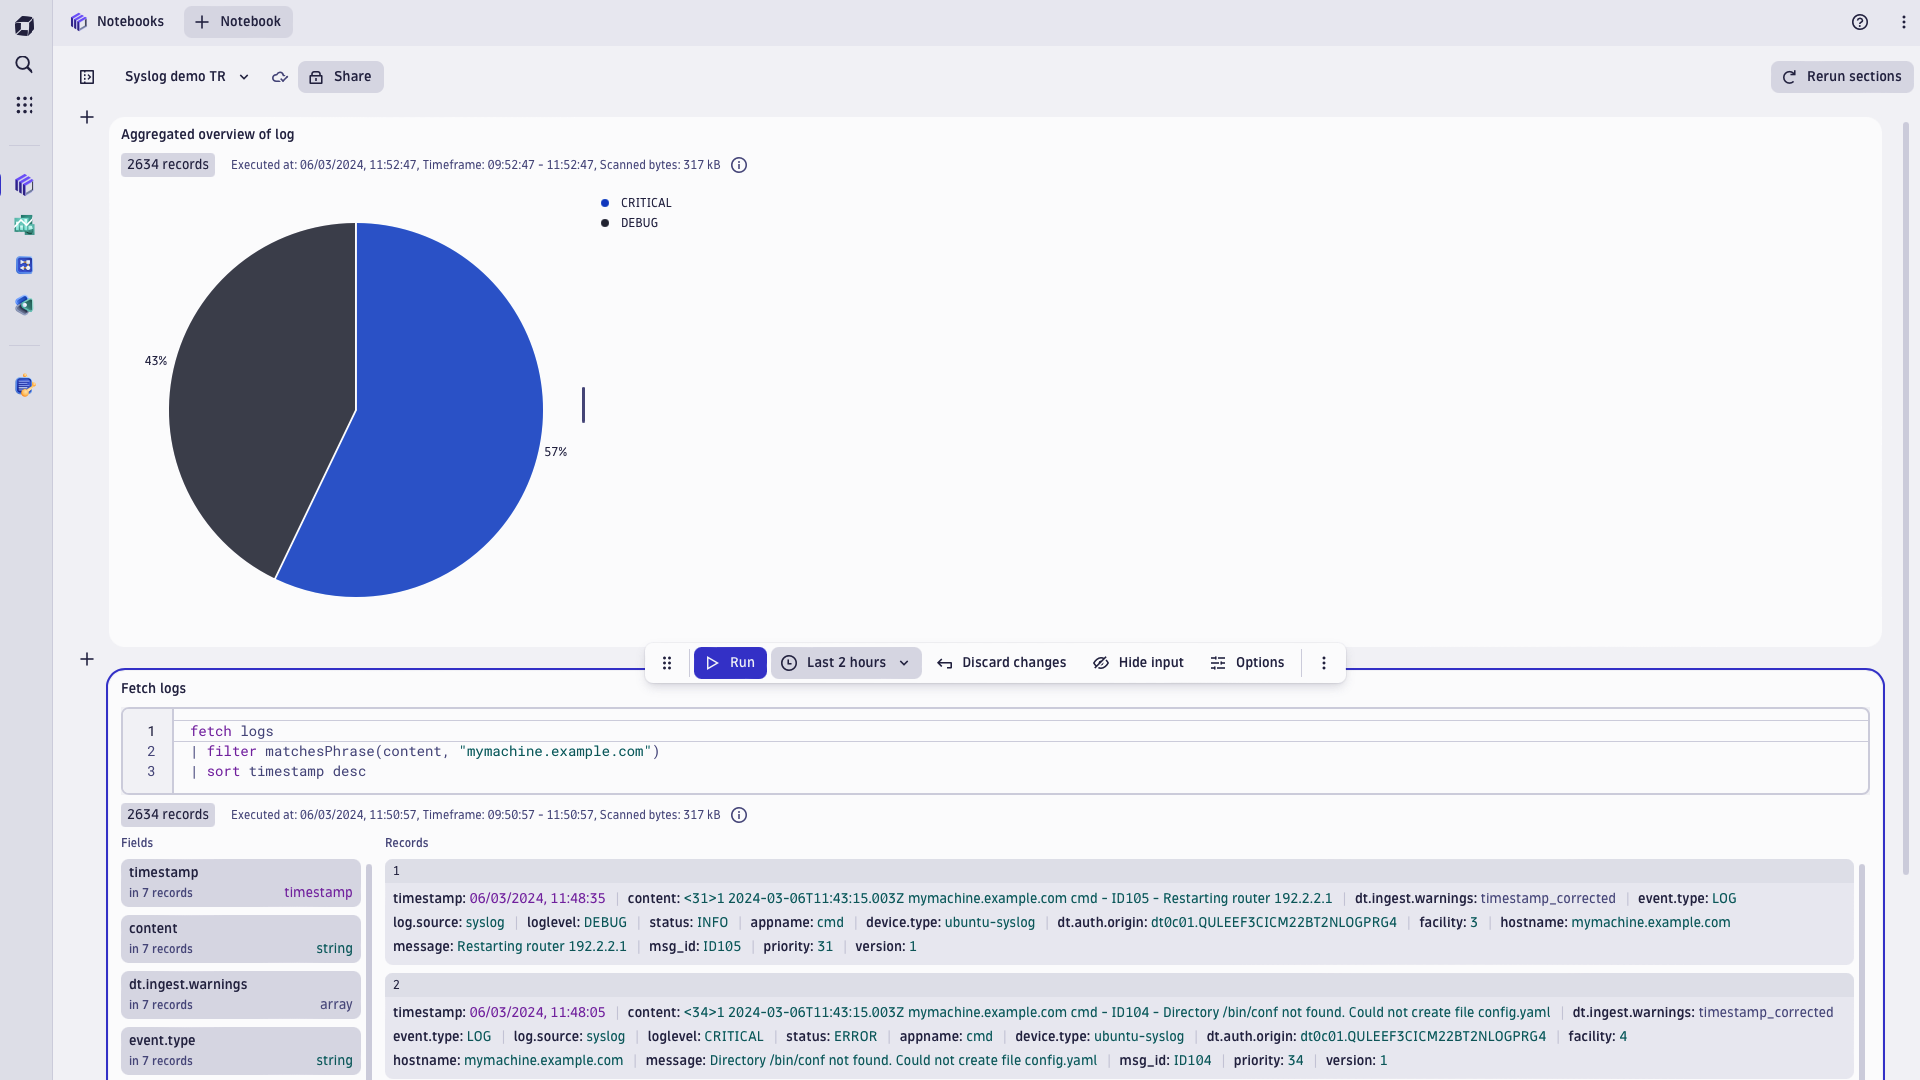
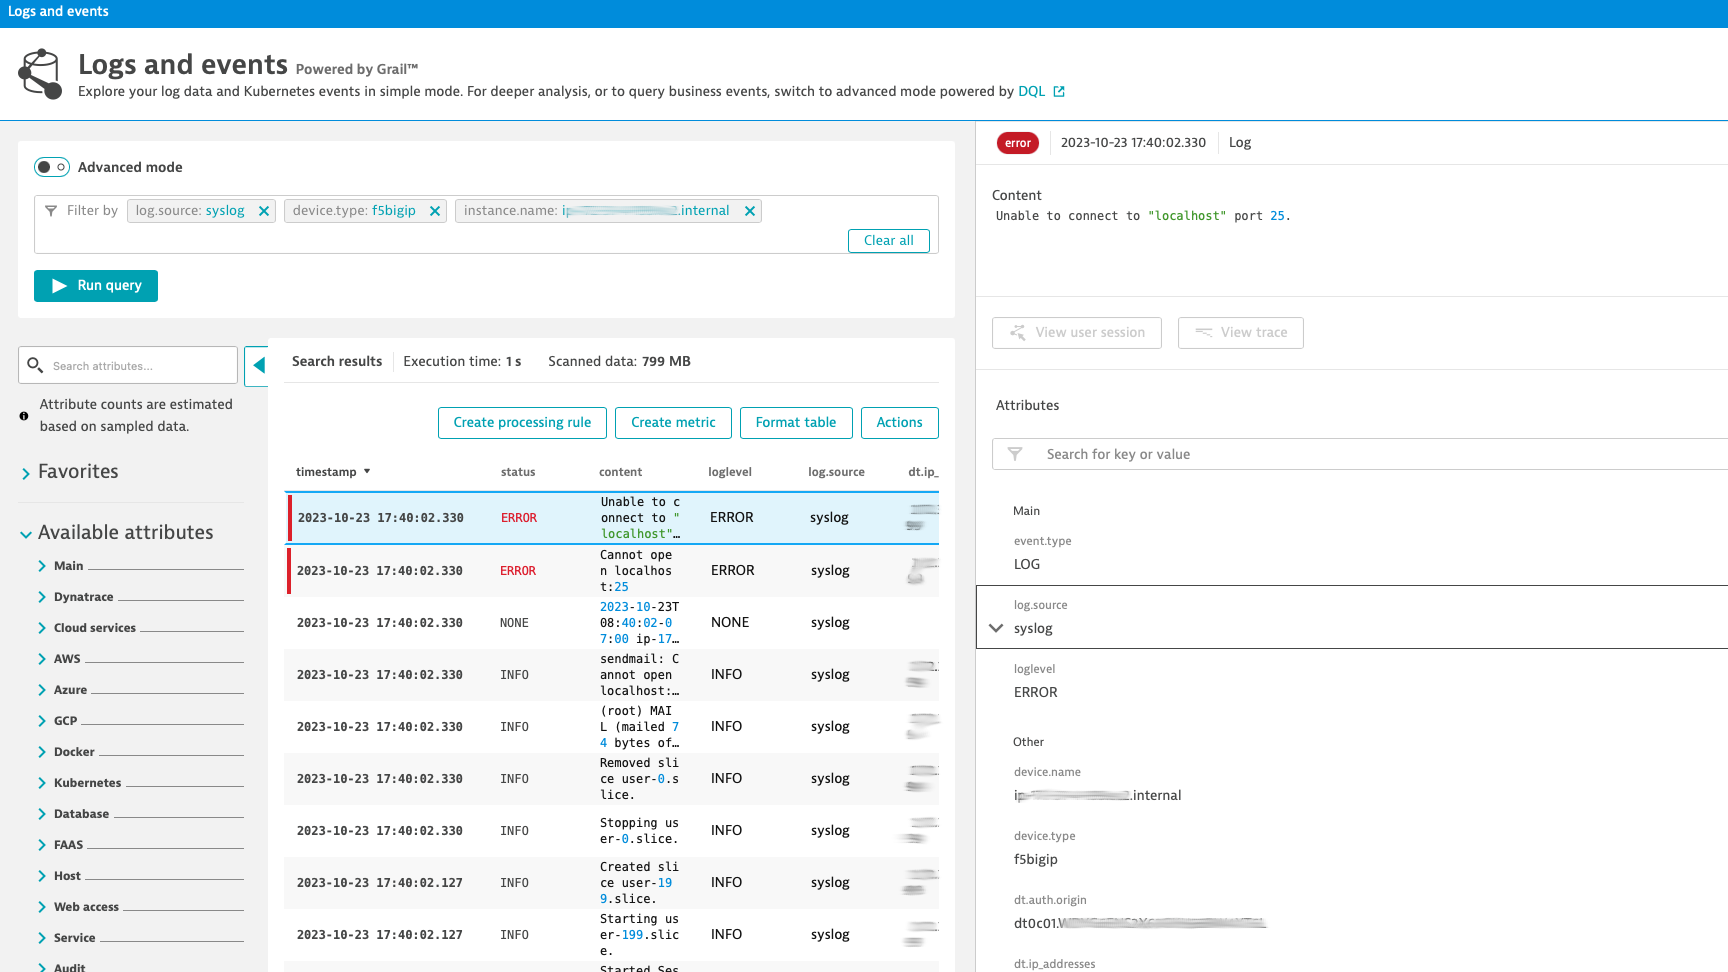
Dynatrace integration diagram: Syslog via OpenTelemetry collectorSyslog analysis and visualisation in Dynatrace NotebooksTroubleshooting use case: Error syslogs from f5 BIG-IP instance
  • Product information

Overview

Syslog is a standard protocol for message logging and system logs management. Devices like routers, firewalls, hosts, switches, and many other devices across many platforms use the Syslog standard to log users' activity, system/software life-cycle events, status, or diagnostics.

In network monitoring, the Syslog protocol is very useful because of its client-server architecture, where the remote Syslog server listens to the client's log messages. Such consolidation of logging data in a central repository allows taking advantage of unified Dynatrace Log Management and Analytics Powered by Grail for actionable insights and automation.

OpenTelemetry collector is an open source vendor-agnostic way to receive, process and export telemetry data. Log processor and forwarding capabilities allow you to collect data/logs from different sources, unify and send them to multiple destinations

With the Dynatrace OpenTelemetry Collector Distribiution we are providing a streamlined and supported way to collect logs over syslog protocol. This makes it hassle-free to stream syslog to Grail data lakehouse that integrates logs with other observability data.

Stream syslog via OpenTelemetry Collector if you already collect logs with it or if a specific use case requires an additional component (e.g., forwarding logs to different targets). If you want to benefit from a secure, trusted edge component with enterprise support and life-cycle management, please refer to Syslog ingest via Dynatrace ActiveGate.

In the case where Linux system syslog observability is the main focus, we recommend deploying OneAgent, which autodiscovers host syslog data, preserves topology context, and requires minimal configuration and maintenance.

This is intended for users who want to: Complement observability data in Dynatrace, extend the Davis AI engine and enable App Owners, DevOps, and SRE teams to analyze all syslog data centrally.

This enables you to: Leverage the OpenTelemetry standards to get syslogs from your devices into Dynatrace where you can immediately benefit from Dynatrace AI-driven root cause analysis.

Use cases

Once setup is finished you can preview your logs in Dynatrace Notebooks for deep analysis and share your findings with the team, Logs and events viewer for quick analysis and dashboard or fuel Dynatrace automation engine to automate BizDevSecOps workflows.

Get started

Set up the logs integration from Syslog producer over OpenTelemetry Collector to Dynatrace with the following steps:

  1. Get a Dynatrace API token with the logs.ingest (Ingest Logs) scope

  2. Deploy Dynatrace OpenTelemetry Collector Distribution

  3. OpenTelemetry Collector settings

  • Syslog receiver configuration.

    • You can expose a required number of Syslog endpoints for a number of device types or instances existing in your environment. This depends on the desired granularity for log stream differentiations.
    • For example, if syslogs from your infrastructure don't include a proper differentiation factor in the log message you can send them to different endpoints to decorate logs with desired attributes on the OpenTelemetry collector. This could be an IP address or device.type attribute.
    • UDP and TCP protocols are supported
  • Transform your data (optional)

    • Transforming telemetry basics
    • Logs Transform Processor
    • Transform Processor
    • OpenTelemetry Transformation Language
  • Derive metrics from logs with count connector (optional)

    • It allows to count the number of log records that satisfy a specified filter condition, and they can also be aggregated based on their attributes. Examples:
      • Count logs with a severity of ERROR or higher.
      • Count logs with a severity of ERROR or higher. Maintain a separate count for each environment.
  • OTLP/HTTP Exporter configuration

    • Destination: Set Dynatrace OTLP logs API url with tenant id: https://{your-tenant}.live.dynatrace.com/api/v2/otlp
    • Destination alternative: You can set OTLP logs API url available on Environmental Active Gate.
    • Authorisation: Set Dynatrace API token in the header
  1. Transform your data with Dynatrace processing (optional)

    • If you send logs to Dynatrace with alternative methods at the same time (OneAgent, cloud log forwarders or other log Ingest API integrations) you may want to maintain a single log processing rule for all ingest channels.
  2. Point your devices to send syslogs to OpenTelemetry Collector

Details

Send syslogs to remote endpoint

Example 1: Configure Rsyslog on Linux Ubuntu to forward syslogs to a remote server.

Add the following line to the syslog daemon configuration file /etc/rsyslog.conf (UDP protocol):

*.* @<OpenTelemetry Collector host IP>:54527

*.* - instructs the daemon to forward all messages to the specified OpenTelemetry Collector instance listening on port 54527 and <OpenTelemetry Collector host IP> needs to point to the IP address of OpenTelemetry Collector.

@@ - if you are using TCP, type two @ symbols

Example 2: Configuring the F5 BIG-IP system to log to a remote syslog server (11.x - 17.x)

Refer to F5 BIG-IP documentation for instructions regarding remote Syslog configuration.

Decorate syslogs with meaningful attributes

The Dynatrace software intelligence platform and its Davis AI engine depend on context-rich, high-quality data. You can provide the context for your data ingested via Generic log ingest API that supports a set of keys and semantic attributes. You can also provide custom attributes that don't require indexing in Dynatrace Grail data lakehouse.

Apply syslog template to your f5 BIG_IP to always include host and IP

This option can be used as an alternative to OpenTelemetry collector receiver configurations described in Example 3.

modify syslog {
    include "
    options {
        proto-template(t_isostamp);
        long_hostnames(yes); use_dns(no); use_fqdn(no);
    };

    template t_isostamp {
        template(\"$ISODATE $HOST 1xx.xx.xx.xx9 $MSGHDR$MSG\\n\");
    };

    destination remote_server {
        tcp(\"1xx.xx.xx.xx1\"
            port (54526)
            template(t_isostamp)
            persist-name(r1)
        );
    };

    filter f_alllogs {
        level (debug...emerg);
    };

    log {
        source(s_syslog_pipe);
        filter(f_alllogs);
        destination(remote_server);
    };
"
}

Example 3: OpenTelemetry Collector configuration:

  • To successfully configure your Collector instance, you must configure each component (receiver, optional processor, and exporter) individually in a YAML file and enable them via pipelines. Follow below examples or Dynatrace documentation

Receiver configuration

receivers:
  syslog/f5:
    tcp:
      listen_address: "0.0.0.0:54526"
    protocol: rfc5424
    operators:
      - type: add
        field: attributes.log.source
        value: syslog
      - type: add
        field: attributes.dt.ip_addresses
        value: "1xx.xx.xx.xx1"
      - type: add
        field: attributes.instance.name
        value: "ip-1xx-xx-x-xx9.ec2.internal"
      - type: add
        field: attributes.device.type
        value: "f5bigip"
  syslog/host:
    tcp:
      listen_address: "0.0.0.0:54527"
    protocol: rfc5424
    operators:
      - type: add
        field: attributes.log.source
        value: syslog
      - type: add
        field: attributes.device.type
        value: "ubuntu-syslog"

Exporter configuration:

exporters:
  logging:
    verbosity: detailed

  otlphttp/tenant_1:
    endpoint: "https://{your-tenant}.live.dynatrace.com/api/v2/otlp"
    headers:
      Authorization: "Api-Token {your-api-token}"

Processor configuration

processors:
  batch:

Service configuration

service:
  pipelines:
    logs:
      receivers: [syslog/f5, syslog/host]
      processors: [batch]
      exporters: [logging, otlphttp/tenant_1]
  • Dynatrace log processing - parse syslogs ingested to Dynatrace to improve readability

Example 4: Dynatrace processing: Syslog attributes extraction:

In the above configuration yaml file /etc/otelcol-contrib/config.yamlwe explicitly added `attributes.instance.name' attribute that can add additional configuration effort in case of change. If syslog message contains instance name it can be extracted automatically. In this example we assume hostname is always available and added after timestamp. Refer to F5 BIG-IP documentation for template instructions on how to include FQDN of the system by default to all syslogs.

Log sample

{
  "content":"2023-10-18T06:55:01-07:00-07:00 ip-1xx-xx-x-xx9.ec2.internal 1xx.xx.x.xx9 info systemd[1]: Removed slice user-0.slice.",
  "device.type": "f5bigip"
}

Add log processing rule

  1. In Dynatrace UI go to Settings>Log Monitoring>Processing and select Add rule
  2. Name a new rule
  3. Add matcher: device.type == "f5bigip"
  4. Add processor definition: PARSE(content,"NSPACE SPACE NSPACE:instance.name")

Test result:

{
  "content": "2023-10-18T06:55:01-07:00-07:00 ip-1xx-xx-x-xx9.ec2.internal 1xx.xx.x.xx9 info systemd[1]: Removed slice user-0.slice.",
  "device.type": "f5bigip",
  "instance.name": "ip-1xx-xx-x-xx9.ec2.internal"
}
Dynatrace
By Dynatrace
Dynatrace support center
Copy to clipboard
Dynatrace Hub
Hub HomeGet data into DynatraceBuild your own app
Dynatrace Intelligence - Agentic Operations SystemThe Dynatrace Agentic AI ecosystem
All (914)Log Management and AnalyticsAI and LLM ObservabilityInfrastructure ObservabilitySoftware DeliveryApplication ObservabilityApplication SecurityBusiness ObservabilityDigital Experience
Filter
Type
Built and maintained by
Deployment model
SaaS
  • SaaS
  • Managed
Partner FinderBecome a partnerDynatrace Developer

Kubernetes

Dynatrace is the only Kubernetes observability platform on the market that integrates full-stack end-to-end observability with intelligent analytics, automation, and security.

Essentials

Kubernetes logo

Kubernetes

All-in-one Kubernetes observability for K8s infrastructure and apps teams.

Dashboards logo

Dashboards

Transform complex data into clear visualizations with custom dashboards.

Applications in Kubernetes

Distribution

Amazon Elastic Kubernetes Service (EKS) logo

Amazon Elastic Kubernetes Service (EKS)

Harness automation and AI to simplify Kubernetes observability at scale.

Azure Kubernetes Service (AKS) logo

Azure Kubernetes Service (AKS)

Harness automation and AI to simplify Kubernetes observability at scale.

Google Kubernetes Engine (GKE) logo

Google Kubernetes Engine (GKE)

Harness automation and AI to simplify Kubernetes observability at scale.

Red Hat OpenShift logo

Red Hat OpenShift

Harness automation and AI to simplify observability on OpenShift at scale.

Kubernetes ecosystem integrations

Prometheus in Kubernetes logo

Prometheus in Kubernetes

Collect metrics from Prometheus exporters in Kubernetes for Dynatrace analytics.

Fluent Bit logo

Fluent Bit

Stream logs to Dynatrace via Fluent Bit for analysis and AI observability.

Istio Service Mesh logo

Istio Service Mesh

Monitor Istio health and performance with Prometheus metrics.

Linkerd logo

Linkerd

LInkerd service mesh provides runtime debugging, observability, reliability, and security with zero code changes.

Fluentd logo

Fluentd

Stream log data to Dynatrace via Fluentd for analysis.

Prometheus Alertmanager (v2) logo

Prometheus Alertmanager (v2)

Receive Prometheus Alertmanager events and open problems in Dynatrace.

More resources

Azure Container Instance logo

Azure Container Instance

Deploy and manage serverless containers on the Microsoft Azure cloud, without having to manage any underlying infrastructure.

Consul Service Mesh (StatsD) logo

Consul Service Mesh (StatsD)

Extend visibility into your Consul Service Mesh instances to monitor health and improve performance.

containerd logo

containerd

Distributed tracing and metrics for services in containerd in Kubernetes.

cri-o logo

cri-o

Distributed tracing and metrics for services in cri-o containers in Kubernetes.

[Deprecated] Kubernetes PVCs logo

[Deprecated] Kubernetes PVCs

Monitor your Kubernetes persistent volume claims and alert on capacity limits.

Nutanix Kubernetes Platform (NKP) logo

Nutanix Kubernetes Platform (NKP)

All-in-one Kubernetes observability for K8s infrastructure and apps teams.

OpenTelemetry Collector logo

OpenTelemetry Collector

Collect, enrich and export your traces, metrics and logs, supported by Dynatrace.

OpenTelemetry Dashboards logo

OpenTelemetry Dashboards

Ready-made dashboards for OpenTelemetry.

Red Hat Enterprise Linux logo

Red Hat Enterprise Linux

Scale existing apps across bare-metal, virtual, container, and all types of cloud environments.

VMware Tanzu logo

VMware Tanzu

Harness automation and AI to simplify Kubernetes observability at scale.

Are you looking for something different?

We have hundreds of apps, extensions, and other technologies to customize your environment

More resources

A toggle to rule them all: alerting for Kubernetes

A toggle to rule them all: alerting for Kubernetes

The absolute foundation for managing a Kubernetes cluster is establishing basic alerting. With the introduction of out-o...
Read more

Kubernetes root cause analysis for Davis AI

Kubernetes root cause analysis for Davis AI

A paradigm shift for meeting Kubernetes performance goals.
Read more
Simplify Kubernetes complexity

Simplify Kubernetes complexity

Learn how to optimize Kubernetes resource quotas, build customized dashboards and take advantage of AI-powered problem resolution.
Read more
A K8s into the wild report

A K8s into the wild report

Rapid Kubernetes adoption is driven and challenged by a growing ecosystem of advanced technologies. In this Kubernetes survey report, learn how top organizations use Kubernetes ...
Read more
Kubernetes vs Docker: What's the difference?

Kubernetes vs Docker: What's the difference?

If cloud-native technologies and containers are on your radar, you've likely encountered Docker and Kubernetes and might be wondering how they ...
Read more