



















Skip to technology filters Skip to main content
Dynatrace Hub

Extend the platform,
empower your team.

Popular searches:
Home hero bg
Observability for Developers on VSCodeObservability for Developers on VSCode
Observability for Developers on VSCode

Observability for Developers on VSCode

Get Real time Code-Level data directly to your VSCode IDE.

Technology
Free trialDocumentation
Real-time code-level snapshot in VSCode IDE
  • Product information

Overview

Instantly access live, code-level data to troubleshoot and understand complex, cloud-native applications, reduce troubleshooting time and enhance productivity and developers satisfaction. Main capabilities include:

  • You can access the necessary and relevant data without adding additional code, waiting for redeployment, or attempting to reproduce issues locally.

  • Using non-breaking breakpoints, you can instantly see the complete state of your app, including stack trace, variable values, and more, all without stopping or breaking your running code.

  • Having the Dynatrace data presented directly in your IDE, helps you maintain the flow without losing time or losing context jumping between tools and screens.

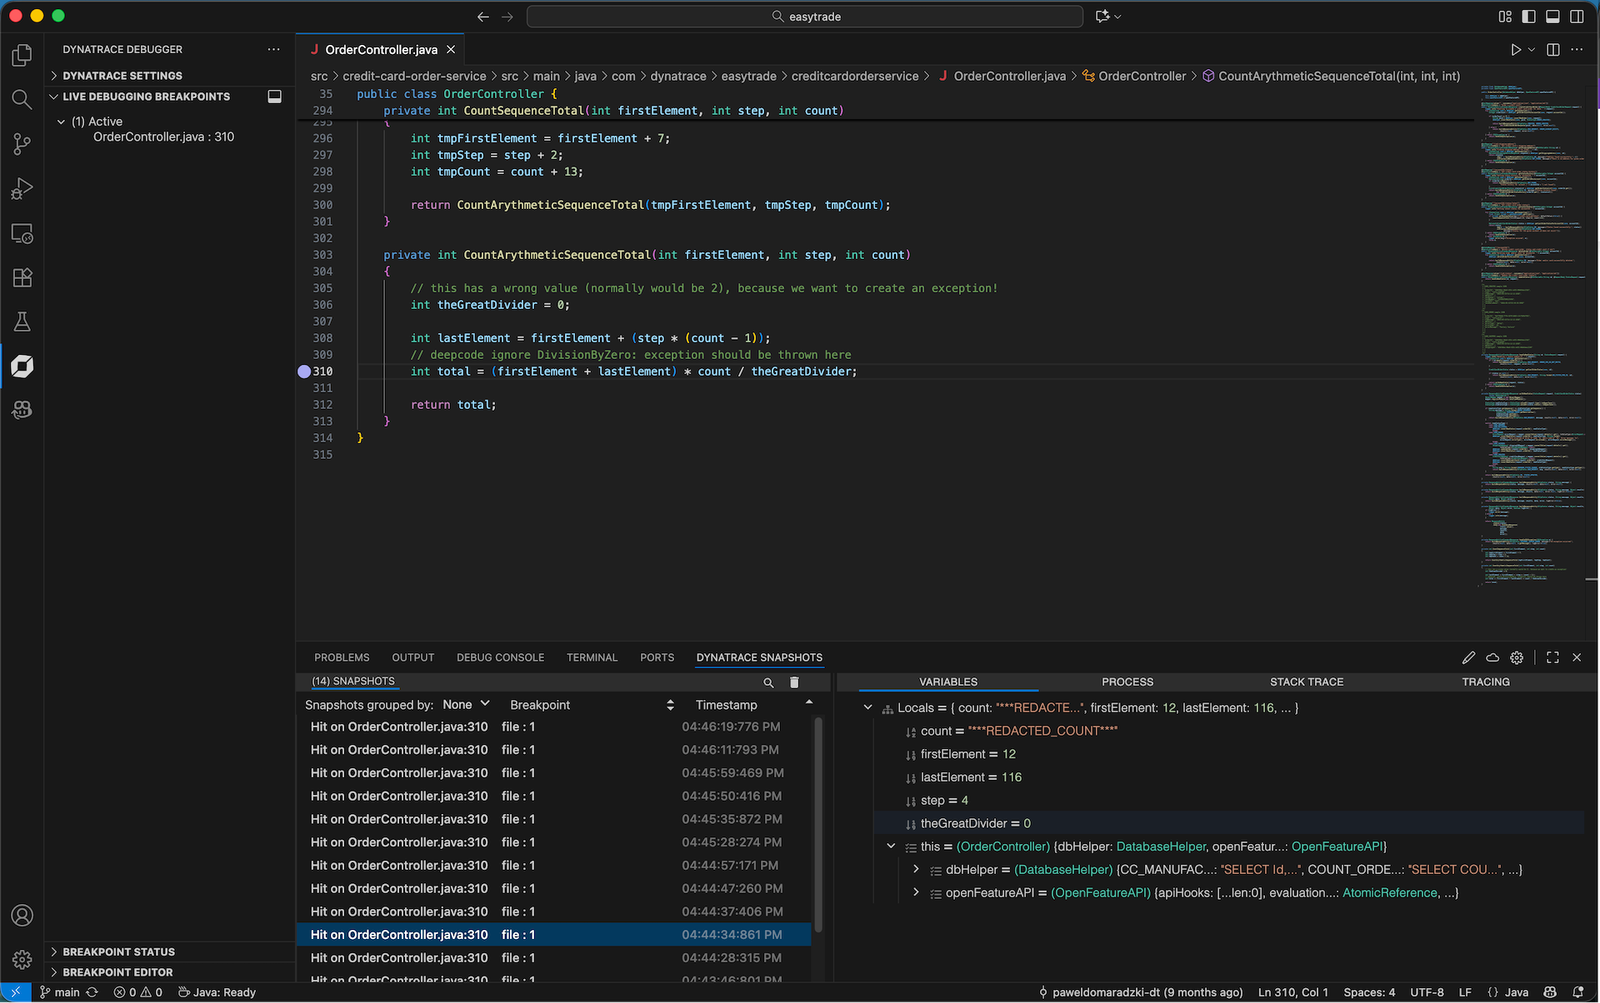
  • The Dynatrace live snapshot contains variables values, stack trace, process and tracing information.

  • The code you want to debug is already present and ready in the IDE, hence source fetching is not needed (as in the Live Debugging web-app).

  • Enhance your troubleshooting experience by integrating MCP server and asking Dynatrace to help with real-time data and insights in natural language via MCP client and AI assistance. learn more of Dynatrace MCP Server and the Local MCP Hubtiles.

Use cases

  • Capture real-time debug data - Instantly understand the state of your application with instant snapshot output of data and context

  • Troubleshoot faster - Instantly debug complex flows and apps including third party and opensource components without stopping your app

  • Dev-friendly debugging experience - On-demand and intuitive access to code-level data from any environment directly to your VSCode IDE

  • Test and optimize your code faster - Instantly understand if specific line of code was reached at all with exploratory analytics

Get started

Requirements:

  • A Dynatrace account with DPS licensing

  • Code Monitoring rate card enabled

  • VSCode version 1.85.0

  • For all permissions pls refer to Docs here

You can install the extension from the Microsoft Visual Studio Code Marketplace or directly from the extensions tab inside your Visual Studio Code IDE.

Install the extension:

  • Open the Dynatrace Snapshots panel. The panel is located at the bottom of the IDE.

  • Log in to your Dynatrace account from the Dynatrace Snapshots panel.

  • Select the environment you’d like to debug by clicking on the cloud icon in the Dynatrace Snapshots panel header. The environment picker will open above, displaying all Dynatrace environments where you have Live Debugging permissions. Select an environment from the list.

  • Configure your debug session by clicking on the pencil icon in the Dynatrace Snapshots panel header. Only instances with Live Debugging enabled will appear. Select filters for the instances you’d like to debug and click “Set”.

  • Add a Live Debugging breakpoint. Right click next to a line number to add a Live Debugging breakpoint. The breakpoint will be applied to instances matching the filters you configured in step 5, within the environment selected in step 4.

  • View data. When your breakpoints are triggered, data will stream into the Dynatrace Snapshots panel. Click on a snapshot to see local variables, stack trace, process information, and tracing data.

Details

Works with VSCode version 1.85.0 or later

Dynatrace
DocumentationMore Information
By Dynatrace
Dynatrace support center
Copy to clipboard
Dynatrace Hub
Hub HomeGet data into DynatraceBuild your own app
Dynatrace Intelligence - Agentic Operations SystemThe Dynatrace Agentic AI ecosystem
All (914)Log Management and AnalyticsKubernetesAI and LLM ObservabilityInfrastructure ObservabilityApplication ObservabilityApplication SecurityBusiness ObservabilityDigital Experience
Filter
Type
Built and maintained by
Deployment model
SaaS
  • SaaS
  • Managed
Partner FinderBecome a partnerDynatrace Developer

Software Delivery

Empower DevOps platform engineers, SREs, and development teams to deliver higher quality software, faster, and more securely.

Popular integrations

See more (1)
GitHub logo

GitHub

Automate GitHub issues, pull requests, and workflows from Dynatrace.

Jira logo

Jira

Open, update, and close Jira tickets automatically from Dynatrace Workflows.

Jenkins logo

Jenkins

Trigger Jenkins builds and monitor job status from Dynatrace Workflows.

GitLab logo

GitLab

Amend files in GitLab repositories, trigger pipelines, and manage issues.

Slack logo

Slack

Automate Slack messaging for security incidents, attacks, remediation, and more.

ServiceNow logo

ServiceNow

Create and manage ServiceNow incidents from Dynatrace Workflows.

More options

Workflows logo

Workflows

Automate tasks in your IT landscape and move towards autonomous operations.

Keptn logo

Keptn

Event-based control plane for continuous delivery and automated operations.

Configuration as Code logo

Configuration as Code

Manage observability and security configurations as code via Terraform or Monaco.

Site Reliability Guardian logo

Site Reliability Guardian

SRG: Automated change impact analysis for your deployment and release processes.

Service-Level Objectives logo

Service-Level Objectives

Manage SLOs and error budgets to ensure service performance and reliability SLAs.

More resources

AWS Connector logo

AWS Connector

Automate your AWS infrastructure with actions across EC2, S3, Lambda, and more.

Claude Connector for Workflows logo

Claude Connector for Workflows

Connect with Claude and send prompts for further analysis using Workflows.

CI/CD Observability logo

CI/CD Observability

Monitor CI/CD pipelines such as Azure Devops, Gitlab, Github and more.

Observability for Developers on Cursor logo

Observability for Developers on Cursor

Get Real time Code-Level data directly to your Cursor IDE.

Email logo

Email

Send out-of-the-box targeted Emails with workflows.

Gemini Connector for Workflows logo

Gemini Connector for Workflows

Connect with Gemini and send prompts for further analysis using Workflows.

GitHub Copilot Coding Agent logo

GitHub Copilot Coding Agent

Automate vulnerability remediation and boost developer productivity.

GitHub Copilot Custom Agent logo

GitHub Copilot Custom Agent

Automate your development workflows with specialized agent definitions.

Observability for Developer on JetBrains logo

Observability for Developer on JetBrains

Get real-time code-level data directly to your Jetbrains IDE.

Kubernetes Connector logo

Kubernetes Connector

Automate your Kubernetes clusters: Delete failed pods and restart deployments.

Microsoft 365 logo

Microsoft 365

Send targeted emails from workflows using your Microsoft 365 account.

OpenAI Connector for Workflows logo

OpenAI Connector for Workflows

Connect with OpenAI and send prompts for further analysis using Workflows.

Ownership logo

Ownership

Enables the import of and access to ownership information of entities.

Pagerduty for Dynatrace Workflows logo

Pagerduty for Dynatrace Workflows

Streamline incident management with automated Pageruty workflows.

Red Hat Ansible logo

Red Hat Ansible

Integrate with Red Hat Ansible (EDA, AAC, AWX) to trigger job templates.

Snowflake for Workflows logo

Snowflake for Workflows

Access, query, and store Snowflake data to analyze further within Dynatrace.

Observability for Developers on VSCode logo

Observability for Developers on VSCode

Get Real time Code-Level data directly to your VSCode IDE.

Cursor IDE logo

Cursor IDE

Boost developer productivity and get real-time, code-level insights into Cursor.

Observability for Developers on Windsurf logo

Observability for Developers on Windsurf

Get real-time code-level data directly to your Windsurf IDE.

Are you looking for something different?

We have hundreds of apps, extensions, and other technologies to customize your environment

Extend your knowledge

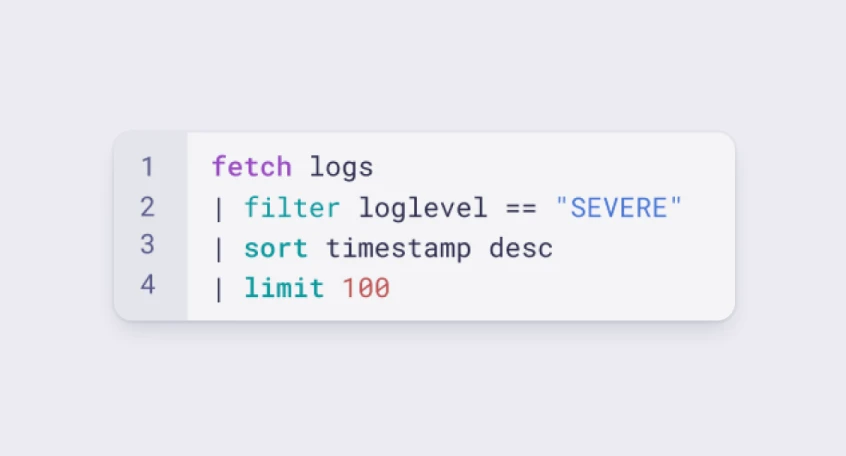
Learn the Dynatrace Query Language

Learn the Dynatrace Query Language

Explore data, discover patterns, anomalies and outliers, and create statistical modeling with DQL, our powerful query language.
Learn DQL
Solve problems with custom apps

Solve problems with custom apps

Dynatrace Developer makes it easy to create custom apps for your organisation. Start with one of our templates or use your own code.
Build apps